Araştırma Makalesi / Research Article - Complex Network Analysis Approach to Examining Undergraduate Program Preferences - DergiPark
←
→
Page content transcription
If your browser does not render page correctly, please read the page content below
BEÜ Fen Bilimleri Dergisi                                                                       BEU Journal of Science
8 (1), 176-186, 2019                                                                              8 (1), 176-186, 2019

                                 Araştırma Makalesi / Research Article

      Complex Network Analysis Approach to Examining Undergraduate
                         Program Preferences

                                  Volkan TUNALI *1, Erdal GÜVENOĞLU2
                       1
                           Maltepe University, Department of Software Engineering, Istanbul
                       2
                           Maltepe University, Department of Computer Engineering, Istanbul

Abstract
In this study, we analyzed undergraduate program preferences of students by using complex network analysis
techniques. We collected program preferences data from the YokAtlas portal provided by the Council of Higher
Education using a web crawler we developed. We constructed a kind of co-occurrence network we called co-
preference network of 622 nodes and 6,136 edges from the collected raw data. We performed a comprehensive
exploratory complex network analysis on the co-preference network using Cytoscape and NodeXL tools. Using
several node centrality measures, we identified the most popular programs that students frequently preferred
together with other programs. In addition, we observed the clusters of programs embedded in the network using
several network community detection methods. Finally, we performed a structure analysis to compare our network
to a corresponding random network, and we showed that our network had the common characteristic properties
that many real-world networks exhibit.

Keywords: Network Science, Complex Network Analysis, Higher Education, Undergraduate Program.

               Yükseköğretim Programı Tercihlerinin İncelenmesinde
                         Karmaşık Ağ Analizi Yaklaşımı

Öz
Bu çalışmada, karmaşık ağ analizi teknikleri kullanarak, öğrencilerin yükseköğretim programı tercihlerini analiz
ettik. Program tercihleri verisini, kendi geliştirdiğimiz bir web sayfası tarama aracı kullanarak, Yükseköğretim
Kurulu tarafından sağlanan YökAtlas portalından topladık. Toplanan ham veriden 622 düğüm ve 6.136 kenara
sahip, birlikte tercih edilme ağı olarak adlandırdığımız bir çeşit birliktelik ağı oluşturduk. Cytoscape ve NodeXL
araçlarını kullanarak, bu ağ üzerinde keşif türünden kapsamlı bir karmaşık ağ analizi gerçekleştirdik. Çeşitli düğüm
merkezilik ölçütleri kullanarak, öğrencilerin diğer programlarla birlikte sıklıkla tercih ettiği en popüler programları
tespit ettik. Ayrıca, çeşitli topluluk tespiti yöntemleri kullanarak, ağ içerisinde yerleşik program kümelerini
gözlemledik. Son olarak, ağımızı, karşılık gelen rasgele ağ ile karşılaştırmak amacıyla bir yapı analizi
gerçekleştirdik ve ağımızın çoğu gerçek hayat ağının sergilediği ortak karakteristik özelliklere sahip olduğunu
gösterdik.

Anahtar kelimeler: Ağ Bilimi, Karmaşık Ağ Analizi, Yükseköğretim, Yükseköğretim Programı.

1. Introduction

In Turkey, the higher education system requires that students take a series of university entrance exams
and specify their undergraduate program preferences after their exam grades are announced. The whole
process called the Student Selection and Placement System (Öğrenci Seçme ve Yerleştirme Sistemi –
ÖSYS) is administered by the Center for Measurement, Selection and Placement (Ölçme, Seçme ve
Yerleştirme Merkezi – ÖSYM) which selects and places students in available programs, considering
their performance on the university entrance exams and their undergraduate program preferences [1].

*
Sorumlu yazar: volkan.tunali@gmail.com
Geliş Tarihi: 26.07.2018, Kabul Tarihi:14.11.2018

                                                         176
V. Tunalı, E. Güvenoğlu / BEÜ Fen Bilimleri Dergisi 8 (1), 176-186, 2019
There are several studies conducted on university and undergraduate program selection of
students in the literature. These studies mostly focused on identifying the factors that affected the
decisions of prospective students, such as interest in the program, tuition and availability of funding,
geographic location, and campus facilities [2-4]. Similar studies were also conducted for specifically
Turkish universities. Ağaoğlu and Yurtkoru [5] evaluated program preference criteria of students with
respect to study areas, academic units, education type, language of instruction, and gender. Özgüven [6]
estimated private university preference rankings by analytic hierarchy process using several criteria.
In this study, we aim to analyze undergraduate program preferences of students by means of
complex network analysis techniques. Rather than analyzing the influential factors in deciding the
undergraduate programs, we investigate the associations between the programs preferred together. One
plausible approach to analyzing such relationships is to use the classical Association Rule Mining from
Data Mining techniques. However, this type of analysis usually generates many rules depending on the
thresholds like minimum support and minimum confidence, and it becomes difficult to interpret the
rules to gain valuable insights. Besides, from many single rules, it is hard to reach the larger structure
and patterns. Therefore, in our research, we use complex network analysis tools and techniques to
explore and analyze the program preferences of students. Complex network analysis makes it possible
to analyze the data in terms of the global structure of connected entities as well as in terms of local
individual entities. In addition, complex network visualization techniques enable us to analyze the data
and perceive the patterns visually. This study in general takes an exploratory approach to answer the
following research questions:
What are the most central and important (in other words, the most co-preferred) programs?
Are there any structural patterns in undergraduate program preferences of students, or instead,
do these preferences happen to be random? Can we understand the phenomenon by analyzing the co-
preference network? If any patterns are observed, do they reflect the attitude and the way of thinking of
prospective university students in general?
Do the co-preference network we construct have similar structural properties observed in most
real-world networks?
This paper is organized as follows. In Section 2, we give the details of the material and the
method we used for the analysis. In Section 3, we present and discuss our findings. Finally, we conclude
the paper and give some directions for future research in Section 4.
2. Material and Method
Our research methodology consists of four distinct phases: data collection, data cleansing, network
modeling and construction, and complex network analysis. Details of each phase are given under their
respective sub-sections in this section.
2.1. Data Collection
Data for this study are collected from the Higher Education Program Atlas (Yükseköğretim Program
Atlası) web portal (abbreviated as YokAtlas), which is provided by the Council of Higher Education
(Yükseköğretim Kurulu – YÖK) to help prospective university students make university and
undergraduate program preferences consciously [7]. In this portal, very comprehensive and detailed
statistics about each undergraduate program by the years 2015, 2016, and 2017 under 31 different
headings are accessible via a very user-friendly web interface, such as several preference statistics of
the program, other universities and programs that the students enrolled in the program preferred together,
and university entrance exam grades and ranks of the students enrolled in the program.
For this study, we made use only of the statistical data of the programs that the students enrolled
in a program in 2017 preferred together. For example, Table 1 shows the list of programs (and their
preference counts) that were preferred together by the students enrolled in Maltepe University, Faculty
of Engineering and Natural Sciences, Software Engineering (English) (Full Scholarship) program in
2017. For each one of total 23,245 undergraduate programs offered by 207 universities, this list was
crawled and saved into a text file by a Python program we developed. Specifically, we made use of
Selenium [8] to obtain the contents of the necessary web pages, and lxml [9] to extract the tabular data
from the web pages crawled. After collecting the preferences data in text file format, the data were
177V. Tunalı, E. Güvenoğlu / BEÜ Fen Bilimleri Dergisi 8 (1), 176-186, 2019
inserted into a relational database for further easy querying and processing. In the program preferences
table, there were 765,712 data rows (roughly 33 preferences per program).
Table 1. Sample data crawled from YokAtlas
Program Name (Original) Program Name (in English) Preference Count
Bilgisayar Mühendisliği Computer Engineering 27
Elektrik-Elektronik Mühendisliği Electrical-Electronic Engineering 9
Yazılım Mühendisliği Software Engineering 7
Endüstri Mühendisliği Industrial Engineering 6
Fizyoterapi ve Rehabilitasyon(Fakülte) Physical Threapy and Rehab. (Faculty) 4
Elektronik ve Haberleşme Mühendisliği Electronics and Communication Eng. 2
Kontrol ve Otomasyon Mühendisliği Control and Automation Engineering 2
Elektrik Mühendisliği Electrical Engineering 1
2.2. Data Cleansing
Since the collected data were not readily available for network modeling and analysis as they contained
several problems, we first needed to perform several data cleansing operations on the data. In Turkish
higher education, there are several variants of most undergraduate programs depending on the language
of instruction and the scholarship opportunities. For example, there were eight variants of Medicine
program with two different language options (Turkish and English) and four different scholarship
options (100%, 50%, 25% scholarship, and no scholarship) at Maltepe University. Nevertheless, the
preferences data provided by YokAtlas lacked these details; that is, only the bare profession names were
supplied instead of full program names. Therefore, we needed to normalize the names of the 23,245
programs in order to make them compatible with the preferences data. For this normalization, program
language and other similar options that appeared in program names within brackets were all removed.
We also made a similar normalization for the preferred program names as they sometimes contained
similar distinguishing elements inside brackets. In addition, we saw that the same program name was
recorded with different capitalizations, which would cause problems during the analysis phase as we
needed unique names. Thus, we transformed such program names to a single common one. Furthermore,
there were several program names in the preferences data like “Kıbrıs”, “KKTC”, and “Yabancı” that
were not correct undergraduate program names at all. Then, we omitted these names from our unique
program names list, and the number of valid undergraduate program names were 631. However, nine of
them were not preferred with any other program together, therefore, we removed them from the final
list. Finally, we obtained 622 distinct undergraduate program names (actually profession names) and
72,571 co-preference data rows.
2.3. Network Modeling and Construction
A very common way of network construction is to use the co-occurrence of events in any domain. In
this work, we used the data of undergraduate programs preferred together by university students during
the program selection. We called this type of data “program co-preference data”. Once we obtained the
program co-preference data, it was a straightforward process to construct the “co-preference network”.
Each undergraduate program was represented by a distinct node in the network. Due to the nature of the
data YokAtlas provided, if a student enrolled in program A had preferred program B, then a directed
edge was created between the corresponding nodes in the network from A to B. Therefore, the
relationships between some programs were expected to be reciprocal; that is, if there is a directed edge
from A to B, then there is also another directed edge from B to A. Furthermore, we ignored the edge
weights because most complex network analysis methods do not use the weights (unless the weights
represent a meaningful distance value in the network of interest).
Using the above network construction method, we constructed the co-preference network of 622
nodes and 72,571 directed edges. 27,633 node pairs had reciprocal edges and 17,305 node pairs had only
single-direction edges. Since the network was highly dense (undirected density was d=0.233),
visualization of it did not reveal the underlying structural patterns easily. Besides, we considered most
edges as noise that prevented the conceivable analysis of structural properties of the network. Then, we
178V. Tunalı, E. Güvenoğlu / BEÜ Fen Bilimleri Dergisi 8 (1), 176-186, 2019
followed a sort of filtering approach that permitted a better analysis. Instead of using all co-preferred
programs, we selected top 10 most co-preferred programs (in descending order of preference count) for
each program, and then constructed a new network with the same method.
The new network had 622 nodes and 6,136 directed edges. 516 node pairs had reciprocal edges
and 5,104 node pairs had only single-direction edges.
2.4. Complex Network Analysis
Complex Network Analysis is a set of techniques that study the statistics, the structure and the function
of large and complex networks where nodes represent any kind of entities, and edges represent any kind
of relationships between the entities [10]. It is based on theories and methods from several disciplines
including mathematics, physics, computer science, statistics, and sociology. A network analysis study
usually involves the following steps after a network representation of the complex phenomenon is
obtained. First, the network data is visualized and patterns are searched for visually. Then, the structural
analysis is performed to understand the general characteristics of the network as a whole. For example,
structural measures like degree distribution of nodes, clustering coefficient, average path length, and
diameter give us important information about the network. Third, centrality analysis is employed, where
structurally the most central and important nodes are identified using appropriate centrality measures
like degree, closeness, betweenness, and eigenvector centrality. A final analysis called community
analysis is performed to reveal the transitive relationships between nodes to detect the clusters or dense
groups in the network [11].
In this study, we used Cytoscape 3.6.1 [12] and NodeXL Basic 1.0 [13] to visualize and analyze
the undergraduate program co-preference network. Cytoscape is a general-purpose, open-source
software environment specifically developed for the large scale integration of molecular interaction
network data. However, it can be used to analyze any type of network owing to its extensive analysis
capabilities and plugin-based extensibility. NodeXL Basic is a free, open-source template for Microsoft
Excel 2007 and later versions that integrates the ease of use of Excel with powerful network analysis
and visualization capabilities.
3. Results and Discussion
Using the above mentioned network analysis tools, we analyzed the co-preference network in four
distinct phases. First, we visualized the network to see its general structure and layout. Then, we
performed structural network analysis. Next, centralities of the nodes were analyzed. Finally, we tried
to reveal the community structures embedded in the network.
3.1. Visual Network Analysis
The very first step of any complex network analysis usually involves the visualization of the network
using an appropriate layout algorithm that enables one to see the organization of the nodes and their
relationships with each other as clearly as possible. For this reason, we visualized the network using
Fruchterman-Reingold layout algorithm available in NodeXL [14]. Fruchterman-Reingold is a fast and
effective layout algorithm that distributes the nodes in such a way that the edges intersect minimally to
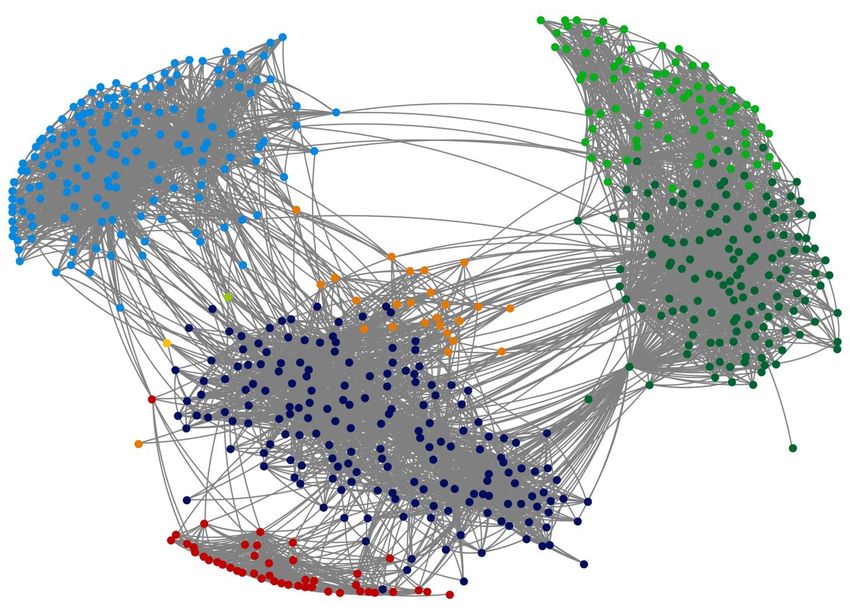
provide a clear view of the network. The visualization of the network is shown in Figure 1. The figure
clearly reveals without any further effort that there are three big and one relatively small clusters. A
detailed analysis of these cluster formations are given in Section 3.4.
3.2. Structural Network Analysis
We obtained the general structural measures of the network using Cytoscape, such as density, clustering
coefficient, diameter, centralization, and characteristic path length. All these measures are presented in
Table 2.
179V. Tunalı, E. Güvenoğlu / BEÜ Fen Bilimleri Dergisi 8 (1), 176-186, 2019
Figure 1. Visualization of the network
Table 2. Structural measures of the network
Measure Name Value
Nodes 622
Edges 6,136
Clustering coefficient 0.543
Characteristic path length 3.019
Density 0.029
Connected components 1
Diameter 6
Radius 3
Average number of neighbors 18.071
Centralization 0.170
We also obtained the degree distribution chart shown in Figure 2. Degree distribution suggests
that the network exhibits a degree distribution close to the Power Law distribution, which is the
distribution usually observed in most real-world networks regardless of the type and size of the network
[11]. This distribution indicates that most of the nodes have a relatively low degree (number of
neighbors) while a few nodes have a very high degree. High number of neighbors (or degree) can be
attributed to the popularity of the node (the corresponding undergraduate program).
In order to check whether the network structure was a result of a random process or rather there
was a natural force or process that generated the network which was far from random, we applied a
further empirical analysis. In this analysis, we created 10 different Erdös-Rényi [15] random graphs with
the same number of nodes and edges as our co-preference network using the network randomizer plugin
in Cytoscape. Then, we compared the structural analysis results of this corresponding random graphs to
the results of our network. On the average, the random graphs had a clustering coefficient of 0.031 and
a characteristic path length of 2.487. In addition, the random graphs had a degree distribution different
180V. Tunalı, E. Güvenoğlu / BEÜ Fen Bilimleri Dergisi 8 (1), 176-186, 2019
from the Power Law distribution. These findings were in line with the general expectation. It is a well-
known fact that random networks do not exhibit the high clustering of real-world networks. Clustering
coefficient 0.543 of our network was very much higher than the clustering coefficient 0.031 of the
corresponding random graphs. Short characteristic path length is also a common behavior of both real-
world and random networks. Therefore, it was very normal that we observed close characteristic path
lengths of 3.019 and 2.487. Finally, the random graphs had a Poisson degree distribution as expected as
a result of random edge addition between nodes. According to these three characteristic properties, our
co-preference network was said to be far from randomness. This is not surprising because students do
not make program choices randomly from the list of all undergraduate programs offered by the
universities. Instead, they mostly prefer similar or related undergraduate programs together according
to their likely future professions along with several other criteria.
Figure 2. Degree distribution of the network
3.3. Centrality Analysis
In this phase of the analysis, we calculated degree, closeness, betweenness, and eigenvector centralities
of the nodes in the network using NodeXL. These are the most commonly used centrality measures that
usually give useful insights about the relative importance of nodes in the network. The higher the
centrality value, the more central a node is. Top 20 programs are ranked by their degree, closeness,
betweenness, and eigenvector centralities in Table 3, 4, 5, and 6 respectively.
While different centrality measures compute the importance of nodes from different
perspectives, we often see that their results support each other, which was also the case in our analysis.
We see that all top 10 programs in Table 4 (betweenness centrality ranking) except “Worker’s Health
And Job Safety” appear in all other centrality tables. These programs are emphasized in the tables with
boldface font. We can interpret these findings that these were the most co-preferred programs in 2017.
181V. Tunalı, E. Güvenoğlu / BEÜ Fen Bilimleri Dergisi 8 (1), 176-186, 2019
Table 3 (degree centrality ranking) displays a blend of these nine programs with the most
popular engineering programs in Turkey. Table 6 (eigenvector centrality ranking) shows a similar result
by placing these engineering programs at the top of the list. These programs are emphasized in the tables
with italic font. This result is reasonable because eigenvector centrality calculation also depends on the
degrees of the nodes but it gives more importance to the nodes whose neighbors have also higher
degrees. We can infer that these engineering programs were very popular among students and that the
students choosing these programs also chose other popular programs together.
Table 3. Top 20 programs by their degree centralities
Rank Program Name (Original) Program Name (in English) Degree
1 Halkla İlişkiler ve Tanıtım Public Relations and Publicity 123
2 Okul Öncesi Öğretmenliği Preschool Teaching 116
3 İşletme Business Administration 115
4 Bilgisayar Mühendisliği Computer Engineering 115
5 Hemşirelik Nursing 110
6 Bankacılık ve Sigortacılık Banking and Insurance 110
7 Elektrik-Elektronik Mühendisliği Electric-Electronic Engineering 103
8 Çocuk Gelişimi Child Development 102
9 Makine Mühendisliği Mechanical Engineering 99
10 İlahiyat Theology 93
11 Adalet Jurisprudence 92
12 İnşaat Mühendisliği Civil Engineering 92
13 Endüstri Mühendisliği Industrial Engineering 91
14 Büro Yönetimi ve Yönetici Asistanlığı Office Management and Executive As. 87
15 İktisat Economics 85
16 Tıbbi Dokümantasyon ve Sekr. Medical Documentation and Secr. 81
17 Muhasebe ve Vergi Uygulamaları Accounting and Taxation 79
18 Siyaset Bilimi ve Kamu Yönetimi Political Science and Public Adminis. 77
19 Uluslararası İlişkiler International Relations 77
20 İş Sağlığı ve Güvenliği Worker’s Health And Job Safety 75
Table 4. Top 20 programs by their betweenness centralities
Rank Program Name (Original) Program Name (in English) Betweenness
1 Hemşirelik Nursing 28,319.01
2 İş Sağlığı ve Güvenliği Worker’s Health And Job Safety 21,306.84
3 Halkla İlişkiler ve Tanıtım Public Relations and Publicity 20,746.26
4 Okul Öncesi Öğretmenliği Preschool Teaching 19,129.26
5 İlahiyat Theology 17,082.51
6 Çocuk Gelişimi Child Development 15,757.27
7 Bankacılık ve Sigortacılık Banking and Insurance 12,863.82
8 İşletme Business Administration 10,854.83
9 Adalet Jurisprudence 6,800.76
10 Tıbbi Dokümantasyon ve Sekreterlik Medical Documentation and Secr. 6,702.67
11 Bilgisayar Mühendisliği Computer Engineering 6,209.62
12 İlk ve Acil Yardım First and Emergency Aid 5,895.35
13 Maliye Public Finance 5,361.08
14 Grafik Tasarımı Graphic Design 5,115.28
15 İktisat Economics 5,076.25
16 Endüstri Mühendisliği Industrial Engineering 5,070.34
17 Turizm ve Otel İşletmeciliği Tourism and Hotel Management 4,451.93
18 Sınıf Öğretmenliği Primary School Education 4,451.69
19 Muhasebe ve Vergi Uygulamaları Accounting and Taxation 4,376.92
20 Endüstri Ürünleri Tasarımı Industrial Product Design 4,236.66
182V. Tunalı, E. Güvenoğlu / BEÜ Fen Bilimleri Dergisi 8 (1), 176-186, 2019
Table 5. Top 20 programs by their closeness centralities
Rank Program Name (Original) Program Name (in English) Closeness
1 Okul Öncesi Öğretmenliği Preschool Teaching 0.000743
2 İlahiyat Theology 0.000734
3 Çocuk Gelişimi Child Development 0.000708
4 Sınıf Öğretmenliği Primary School Education 0.000700
5 Halkla İlişkiler ve Tanıtım Public Relations and Publicity 0.000688
6 Hemşirelik Nursing 0.000687
7 Bankacılık ve Sigortacılık Banking and Insurance 0.000686
8 Adalet Jurisprudence 0.000684
9 İşletme Business Administration 0.000680
10 İş Sağlığı ve Güvenliği Worker’s Health And Job Safety 0.000678
11 Tıbbi Dokümantasyon ve Sekr. Medical Documentation and Secr. 0.000677
12 Maliye Public Finance 0.000671
13 Sağlık Yönetimi Healthcare Management 0.000663
14 Bankacılık ve Finans Banking and Finance 0.000656
15 Özel Eğitim Öğretmenliği Special Education Teaching 0.000654
16 Otel Yöneticiliği Hotel Management 0.000653
17 İktisat Economics 0.000650
18 Sosyal Hizmetler Social Services 0.000646
19 Rehberlik ve Psikolojik Danışmanlık Guidance and Psychological Counseling 0.000646
20 Grafik Tasarımı Graphic Design 0.000644
Table 6. Top 20 programs by their eigenvector centralities
Rank Program Name (Original) Program Name (in English) Eigenvector
1 Bilgisayar Mühendisliği Computer Engineering 0.010240
2 Elektrik-Elektronik Mühendisliği Electric-Electronic Engineering 0.009405
3 Hemşirelik Nursing 0.009083
4 Makine Mühendisliği Mechanical Engineering 0.008937
5 İnşaat Mühendisliği Civil Engineering 0.008730
6 Endüstri Mühendisliği Industrial Engineering 0.008383
7 Halkla İlişkiler ve Tanıtım Public Relations and Publicity 0.008378
8 Çocuk Gelişimi Child Development 0.007316
9 Bankacılık ve Sigortacılık Banking and Insurance 0.007124
10 Okul Öncesi Öğretmenliği Preschool Teaching 0.006950
11 Adalet Jurisprudence 0.006554
12 Büro Yönetimi ve Yönetici Asistanlığı Office Management and Executive As. 0.006271
13 İlahiyat Theology 0.006071
14 İşletme Business Administration 0.005965
15 Mimarlık Architecture 0.005811
16 Tıbbi Dokümantasyon ve Sekr. Medical Documentation and Secr. 0.005798
17 Matematik Mathematics 0.005160
18 Muhasebe ve Vergi Uygulamaları Accounting and Taxation 0.005155
19 Diş Hekimliği Dentistry 0.004809
20 Siyaset Bilimi ve Kamu Yönetimi Political Science and Public Adminis. 0.004691
3.4. Community Analysis
In this final phase of the complex network analysis, we used NodeXL to detect the clusters or dense
groups of nodes in the network. First, we applied Clauset-Newman-Moore clustering method [16] and
found three large and one relatively small clusters that we could easily distinguish when we visualized
the network as seen in Figure 1. Then, we applied Wakita-Tsurumi method [17] and found eight clusters
of different sizes. These clusters are shown in Figure 3 where nodes in distinct clusters appear with
183V. Tunalı, E. Güvenoğlu / BEÜ Fen Bilimleri Dergisi 8 (1), 176-186, 2019
distinct colors. In this study, a cluster is a collection of programs that were preferred together highly
often by the students. Table 7 gives the properties of the clusters found.
Figure 3. Visualization of the clusters in the network
Table 7. Clusters found in the network
# Node Color Cluster Size Program Themes in the Cluster
1 176 Economics, Administration, Communication, Education
2 157 Engineering, Medicine, Natural Sciences
3 139 Vocational School (mix with no specific theme)
4 79 Vocational School (Medical, Technology)
5 44 Language, Literature, Interpreting
6 25 Vocational School (Banking, Insurance, Tourism)
7 1 Art and Social Sciences
8 1 Marine School Deck
Clusters detected clearly show the general tendency of students while specifying their program
preferences. Cluster 1 comprises of economics and business related programs as well as communication
and education programs. Programs within Cluster 2 are related to engineering, medicine, and natural
sciences, which are frequently preferred together by students from a science and maths background in
Turkey. We see that vocational school programs are grouped into three distinct clusters 3, 4 and 6,
depending on the relative affinity of the programs within the clusters. Cluster 5 contains the language,
literature and interpreting programs. Clusters 7 and 8 have single members, “Art and Social Sciences”
and “Marine School Deck”, respectively. Although these two programs are connected to a few other
programs, the clustering algorithm did not place them into any other cluster most probably because of
their unique structural characteristics.
4. Conclusion and Future Directions
In this research, we analyzed the undergraduate program preferences of students by using complex
network analysis techniques. First, we collected program preferences data from the YokAtlas portal
184V. Tunalı, E. Güvenoğlu / BEÜ Fen Bilimleri Dergisi 8 (1), 176-186, 2019
using a web crawler we developed. Then, we applied several cleansing and transformation operations
on the data to make it convenient to construct the preference network. Next, we constructed the network
we called “co-preference network” of 622 nodes and 6,136 edges. Once the network was available in a
suitable format, we used Cytoscape and NodeXL tools to explore and analyze it. With regard to research
questions we introduced before, we obtained the findings as follows.
First, using several centrality measures, it was possible to identify the most central (in other
words, the most important) programs that the students frequently preferred together with other programs.
We saw that “Nursing”, “Public Relations and Publicity”, “Preschool Teaching”, and “Banking and
Insurance” programs were highly popular. Besides these programs, we could see that “Computer
Engineering”, “Electric-Electronic Engineering”, “Mechanical Engineering”, “Civil Engineering”, and
“Industrial Engineering” engineering programs were the most popular ones as we would expect in
Turkey.
Second, we observed cluster formations both by visual and community analysis. These clusters
show that undergraduate programs preferred together are the result of a conscious and meaningful
decision process rather than being at random.
Finally, we wanted to check whether the co-preference network we constructed had the
characteristic properties that were commonly observed in most real-world networks. In order to do this,
we calculated the clustering coefficient, characteristic path length and obtained the node degree
distribution of our network. Then, we constructed a number of Erdös-Rényi random graphs with the
same number of nodes and edges as our co-preference network, and calculated the same metrics from
these random graphs. After that, we compared the two set of values and degree distributions. We
observed that our co-preference network also had the common characteristics that many real-world
networks exhibit.
In this study, we focused only on the data of 2017 preferences. However, it is possible to obtain
the data of 2015 and 2016 from the YokAtlas portal, and to apply the same methodology to them. This
way, it would be possible to compare the program preferences and observe the differences and
similarities. Moreover, the YokAtlas portal provides the university preferences of students, and it is
possible to conduct a similar study on the co-preferred universities network.
References
[1] ÖSYS. 2018. ÖSYS: Öğrenci Seçme ve Yerleştirme Sistemi.
http://www.osym.gov.tr/TR,8832/hakkinda.html (Erişim Tarihi: 30.06.2018).
[2] Briggs S., Wilson A. 2007. Which university? A study of the influence of cost and information
factors on Scottish undergraduate choice, Journal of Higher Education Policy and Management, 29
(1): 57-72.
[3] Daily C.M., Farewell S., Kumar G. 2010. Factors Influencing the University Selection of
International Students, Academy of Educational Leadership Journal, 14 (3): 59-75.
[4] Abubakar B., Shanka T., Muuka G.N. 2010. Tertiary education: an investigation of location
selection criteria and preferences by international students–The case of two Australian universities,
Journal of Marketing for Higher Education, 20 (1): 49-68.
[5] Ağaoğlu M., Yurtkoru E.S. 2013. A Research on Students' University and Program Preference
Criteria, Öneri Dergisi, 10 (40): 115-124.
[6] Özgüven N. 2011. Vakıf Üniversitesi Tercihinin Analitik Hiyerarşik Süreci ile Belirlenmesi,
Dumlupınar Üniversitesi Sosyal Bilimler Dergisi, (30): 279-290.
[7] YÖK Atlas. 2018. Yükseköğretim Program Atlası. https://yokatlas.yok.gov.tr/ (Erişim Tarihi:
30.06.2018).
[8] Salunke S.S. 2014. Selenium Webdriver in Python: Learn with Examples, CreateSpace Independent
Publishing Platform. 86s.
[9] lxml. 2018. lxml - XML and HTML with Python. https://lxml.de/ (Erişim Tarihi: 30.06.2018).
[10] Zweig K.A. 2016. Network Analysis Literacy: A Practical Approach to the Analysis of Networks,
Springer-Verlag. 535s. Austria.
[11] Tunalı V. 2016. Sosyal Ağ Analizine Giriş, Nobel Akademik Yayıncılık. 200s. Ankara.
185V. Tunalı, E. Güvenoğlu / BEÜ Fen Bilimleri Dergisi 8 (1), 176-186, 2019
[12] Shannon P., Markiel A., Ozier O., Baliga N.S., Wang J.T., Ramage D., Amin N., Schwikowski B.,
Ideker T. 2003. Cytoscape: A Software Environment for Integrated Models of Biomolecular
Interaction Networks, Genome Research, 13 (11): 2498-2504.
[13] Hansen D.L., Shneiderman B., Smith M.A. 2011. Analyzing Social Media Networks with NodeXL:
Insights from a Connected World, Morgan Kaufmann. Boston.
[14] Fruchterman T.M.J., Reingold E.M. 1991. Graph Drawing by Force-directed Placement, Software:
Practice and Experience, 21 (11): 1129-1164.
[15] Erdös P., Rényi A. 1959. On Random Graphs, Publicationes Mathematicae Debrecen, 6: 290-297.
[16] Clauset A., Newman M., Moore C. 2004. Finding community structure in very large networks,
Physical Review E, 70 (6): 66-111.
[17] Wakita K., Tsurumi T. 2007. Finding community structure in mega-scale social networks:
[extended abstract], 16th international conference on World Wide Web, pp1275-1276, Banff,
Alberta, Canada.
186You can also read