Addressing Gaps in Broadband Infrastructure Availability and Service Adoption - A Cost Estimation & Prioritization Framework - ACA Connects

Page created by Ben Guerrero
 
CONTINUE READING
Addressing Gaps in Broadband Infrastructure Availability and Service Adoption - A Cost Estimation & Prioritization Framework - ACA Connects
Addressing Gaps in Broadband Infrastructure
                                             Availability and Service Adoption
                                                        A Cost Estimation & Prioritization Framework
                                                                         June 2021

www.cartesian.com
Copyright © 2021 Cartesian, Inc. All rights reserved.                                         INTERNAL DRAFT
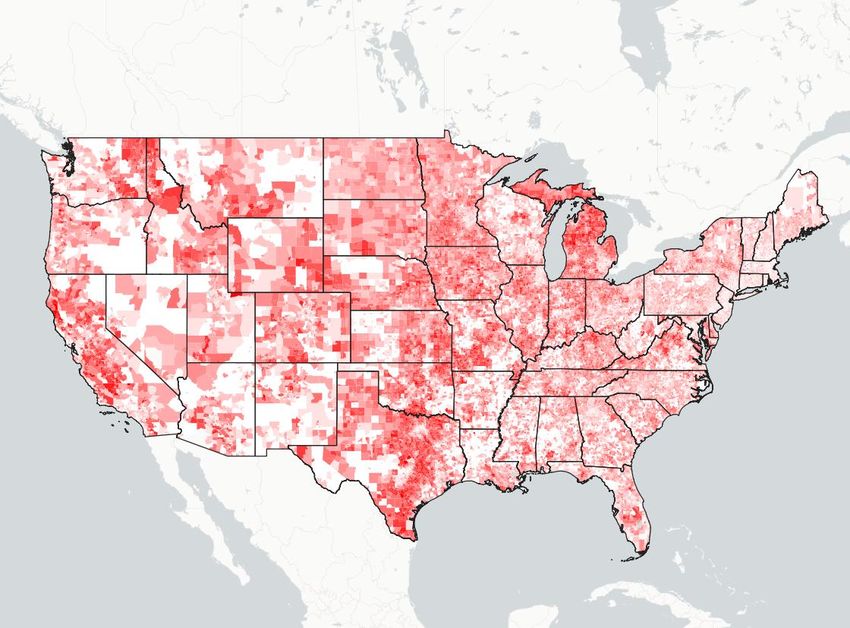
Addressing Gaps in Broadband Infrastructure Availability and Service Adoption - A Cost Estimation & Prioritization Framework - ACA Connects
Summary

                                                  The digital divide is both an availability problem and an adoption problem
                                                  Approximately 12M households do not have access to 25/3 Mbps broadband service (the
                                                  FCC’s current definition), and about 30M do not subscribe to such service when it is available

                                                  Policymakers can address both broadband needs with funding under discussion
                                                  This analysis offers a framework that policymakers can use to help determine the proper
                                                  allocation of funding to maximize both the availability of robust broadband service and the
                                                  number of low-income households that subscribe

                                                  More ambitious goals require broadband infrastructure funding amounts to be
                                                  set at higher levels than what has so far been proposed
                                                  For example, building future-proof networks to all locations with less than 100/100 Mbps
                                                  service would cost approximately $106B - $179B

Source: ACA Connects, Cartesian
Copyright © 2021 Cartesian, Inc. All rights reserved.                                  2
Addressing Gaps in Broadband Infrastructure Availability and Service Adoption - A Cost Estimation & Prioritization Framework - ACA Connects
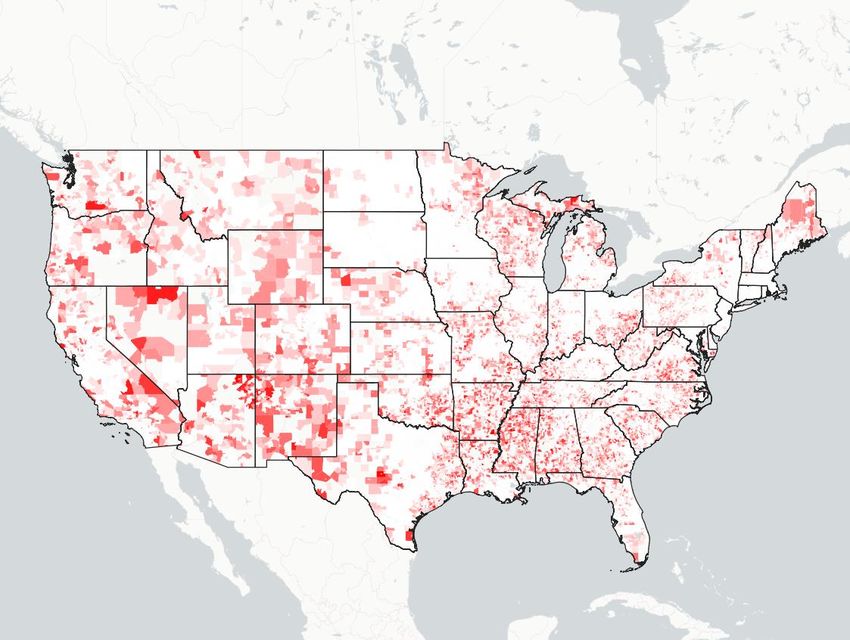
U.S. Broadband | Objectives
        There is broad agreement among policymakers that we should deploy future-proof networks in unserved
        areas, and that all Americans should be able to connect to broadband service

       “Our mission [is] to address the digital                                     “High-speed broadband is essential                                “Our country’s technological capabilities are
       divide. The disparate effects of that                                                                                                          revolutionizing the way Americans communicate
                                                                                    in the 21st Century economy…                                      and work with each other, but many Americans who
       divide have been amplified during the
                                                                                    Just like rural electrification several generations               live in rural communities are being left behind…
       COVID-19 pandemic and exposed the
                                                                                    ago, universal broadband is long overdue and
       urgency of ensuring universal                                                critical to broadly shared economic success.”
                                                                                                                                                      it is critical to support efforts to close
       access to high-speed internet.”                                                                                                                the digital divide.”
                                                                                                                                     – JoeBiden.com
          – Congressman Jim Clyburn (D-SC)                                                                                                                         – Congressman Bob Latta (R-OH)

                                                                                                              “With the COVID-19 pandemic now
        “Congress needs to explore the feasibility of allocating                                                                                                “When we invest in broadband
                                                                                                              plaguing our nation, our urgency to
        more resources for broadband deployment                                                                                                                 infrastructure, we invest in opportunity
                                                                                                              ensure all Americans have                         for all Americans … we should be able to
        to areas that are not economical to serve
                                                                                                              access to affordable, high-speed                  bring high-speed internet to
        or to families that have experienced
                                                                                                              broadband internet has only increased.”           every family in America.”
        economic hardships because of the pandemic.”
                                                                                                                 – Congressman Frank Pallone (D-NJ)               – Senator Amy Klobuchar (D-MN)
                                          – Senator Roger Wicker (R-MS)

Source: klobuchar.senate.gov, joebiden.com, latta.house.gov, energycommerce.house.gov, connectamericansnow.com, ACA Connects, Cartesian
Copyright © 2021 Cartesian, Inc. All rights reserved.                                                                                3
Addressing Gaps in Broadband Infrastructure Availability and Service Adoption - A Cost Estimation & Prioritization Framework - ACA Connects
U.S. Broadband | Key Questions
        As policymakers seek to close the digital divide in America, there are three key questions to consider in
        developing a comprehensive plan for universal broadband availability and adoption

                       Key Questions                        What is the state of broadband service availability
                                                        1
                                                            and adoption today?

                                                            What would it cost to address both the availability
                                                        2
                                                            and adoption gaps?

                                                            How can available funds be prioritized in order to
                                                        3
                                                            make meaningful progress towards both objectives?

Source: ACA Connects, Cartesian
Copyright © 2021 Cartesian, Inc. All rights reserved.                 4
Addressing Gaps in Broadband Infrastructure Availability and Service Adoption - A Cost Estimation & Prioritization Framework - ACA Connects
What Service is Available Today?
        U.S. Broadband | Availability: 2020

                                                          U.S. Households (HH)1 by Census Block (CB) Max Speed2 (as of June 2020)
                                                     Based on FCC Form 477 Reported Maximum Speeds Available to Each Census Block – Assumes Fully Served Census Blocks

              FCC Tier by                                             Unserved                                                   Baseline                                             Above Baseline                                    Gigabit
           Speed (Mbps)4                           No Service                                900/500

                                                                                                                                                                         54.3M
                                                                                                                                                                            43%                                                        46.8M
                                                                                                                                                                                                                                         37%
              Num. HHs
                     % of HHs                                                                                                                                                                                   14.0M
                                                                                            3.0M                                   6.8M                                                                             11%
                                                     0.8M                                                                            5.4%
                                                      0.7%                                   2.4%

                 Cumulative
                  Share HHs                           0.7%                                     3%                                      9%                                   52%                                    63%                  100%

           Unserved Households in Partially Served Census Blocks                                                                                                                    12M Total HHs without 25/3 Mbps
           There are an additional estimated 8.2M households in census blocks                                                                                                       Accounting for partially served census blocks,
           that are reported as ‘served’5 that do not have broadband service                                                                                                        an estimated 12M households nationwide do
           available                                                                                                                                                                not have access to 25/3 Mbps service
1 Includes all households in the U.S., irrespective of federal or state subsidy status (e.g., including 5.2M locations recently awarded funding through the Rural Digital Opportunity Fund (RDOF))
2 Based on FCC Form 477 data that considers all households in a census block to have access to a given speed tier if any household in the block has access to that speed
3 95% of the 100/20 – 100/100 Mbps group have gigabit or near-gigabit download speeds but below 100 Mbps upload speeds, as a result of being served by cable
4 Speed tiers include all households passed by at least the bottom of the range (i.e., inclusive) without access to the speed at the top of the range (i.e., exclusive)
5 Reflects known issue in FCC Form 477 reporting where a census block is reported with a given speed if a single household in the block is served with that speed, estimated from a BroadbandNow study (see appendix)
Source: FCC Form 477 June 2020 (Apr 7 2021 release), U.S. Census, BroadbandNow, ACA Connects, Cartesian
Copyright © 2021 Cartesian, Inc. All rights reserved.                                                                                              5
What Service is Available Today?
        U.S. Broadband | Availability: 2018-2020
        Gigabit availability has increased, but many areas continue to have only baseline and below service options

                FCC Tier                               Share U.S. Households (HH)1 by Census Block (CB) Max Speed (2018-2020)                                                                                                                Significant Growth
                                                     Based on FCC Form 477 Reported Maximum Speeds Available to Each Census Block – Assumes Fully Served Census Blocks
                 Speed                                                                                                                                                                                                                        in Gigabit Service
                                                                Jun. 2018                                                     Jun. 2019                                                     Jun. 2020                                     • Gigabit availability has
                                                                                                                                                                                                                                            increased by 50% since
                                                                                                                                                                                                                                            2018 as competition
                     Gigabit                                                                    +6pp                                                          +6pp
                                                                                                                                                                                                                                            drives network upgrades
                >900/500 Mbps                                         25%                       +7.8M HHs                                                     +7.7M HHs
                                                                                                                                    31%                                                                                                   • Approximately 90% of this
                                                                                                                                                                                                  37%                                       growth comes from
                                                                                                                                                                                                                                            households that
              Above Baseline
                                                                                                                                                                                                                                            previously had access to
              100/20 – 900/500
                                                                                                                                                                                                                                            above-baseline service
                   Mbps

                    Baseline                                                                                                                                                                                                                 Minimal Reduction
                 25/3 – 100/20                                        63%                                                                                                                                                                   in Baseline & Below
                     Mbps                                                                                                           58%
                                                                                                                                                                                                  54%                                     • Recent investment has
                                                                                                                                                                                                                                            missed the unserved –
                   Unserved                                                                                                                                                                                                                 availability of baseline and
What Service is Available Today?
        U.S. Broadband | Adoption
        Affordability is a significant barrier for lower-income households to adopt fixed broadband
                                                                                                             Income                     Household income is highly correlated with internet
                                  ~30M HHs                                                                                              adoption – 36% of all households without a fixed
                                                                                                                                        broadband connection make below $20K/year, and 14%
                                                                                                                                        make above $75K/year3
                                                                                                                                        — American Community Survey (ACS) 20193
                                                                                                          Geography
                                                                                                                                        Broadband adoption is a concern in both rural and non-rural
                                                                                                                                        areas – 29% of rural homes and 28% of non-rural homes do
                                                                                                                                        not subscribe to fixed broadband when it is available4
                                                                                                                                        — Cartesian Analysis of 2019 ACS3 and Census Data

                                                                                                                 Age                    Age does not seem to be correlated with broadband adoption
        An estimated 30 million households
        do not subscribe to fixed broadband                                                                                             – adoption is approximately 28% in areas with and without
                                                                                                                                        higher proportions of senior citizens (i.e., age 65+)5
         at home for “reasons other than
                                                                                                                                        — Cartesian Analysis of 2019 ACS3 and Census Data
               network availability”1
                         — National Urban League                                                      In addition to affordability, studies suggest that digital readiness and perceived lack of relevance are also barriers to broadband adoption 6

1 Approximation from the National Urban League, which assumes that 80-90% of ACS’ 36M non-adoption households have access to at least one available fixed terrestrial service. NUL approximation is based on American Community Survey tally of households with “broadband
such as cable, fiber optic or DSL” – this excludes households whose only connectivity is through a mobile provider, but may include a small number of households with a sub-25/3 connection (refer to appendix for further detail)
2 The federal poverty line for a 3-person household in 2020 was $21,720 | 3 Based on American Community Survey 2019 5-year rolling average estimate of households without access to home internet through any technology (e.g., fixed broadband, mobile, satellite, etc.)
4 Around 10% of total households subscribe only to a cellular data plan, which provides some connectivity but is unsuitable for many of the use cases enabled by fixed broadband
5 Higher 65+ population = at least 25% of the census block group as 65+ (see appendix) | 6 Based on the Lewis Latimer Plan For Digital Equity And Inclusion, published by the National Urban League
Source: FCC Form 477 June 2020 (Apr 7 2021 release), American Community Survey 2019 5-year Estimates, Pew Research Center, National Urban League Lewis Latimer Report, ACA Connects, Cartesian
Copyright © 2021 Cartesian, Inc. All rights reserved.                                                                                          7
What Service is Available Today?
        The Digital Divide | Availability, Adoption, Demographics
        More households don’t subscribe to broadband than don’t have it available – availability and adoption both
        need to be addressed in order to close the digital divide
                              Broadband Availability and Adoption by Demographic (Approximate)
                                                                                                                                                                                                                                       Notes
                             Group:        Nationwide4                      Asian                      White                       Black                   Hispanic                 Native Am.
                Availability Gap                              3%                         1%                         3%                         3%                          2%                                 Minimal Availability Gap:
           Fixed Broadband Not                                                                                                                                                            12%                 • Across all groups except Native Americans,
                     Available1                                              17%
                                                                                                        25%                                                                                                     broadband1 is available to 97%+ of HHs
                 Adoption Gap2                   28%4                                                                              33%                                                                        • This does not account for partially served
               Fixed Broadband
                                                                                                                                                               37%
                                                                                                                                                                                                                census blocks, which may represent an
         Available, no Adoption                                                                                                                                                           29%                   additional ~6.5% of U.S. households
                                                                                                                                                                                                              Sizeable Adoption Gap:
                                                                                                                                                                                                              • There is a gap in broadband adoption across
                                                                                                                                                                                                                all populations – Hispanic and Black
                                                                                                                                                                                                                populations have the largest adoption gap
                                                                                                                                                                                                              • While about one third of households
         Broadband Adopted                                                   82%                                                                                                                                without a fixed broadband connection have
              Fixed Broadband                     69%                                                   72%                                                                                                     mobile connectivity, this is insufficient for
        Available and Adopted3                                                                                                     64%                         61%                        59%                   some use cases (e.g., remote learning)5

                                                                                                                                                                                                               Accounting for partially served census blocks,
                                                                                                                                                                                                               there may be ~2x as many households that
                                                                                                                                                                                                               don’t subscribe to broadband when it’s
                                                                                                                                                                                                               available (22%) than don’t have access (10%)

1 Based on availability data from Form 477 of households with access to speeds of at least 25/3 Mbps – availability by demographic is estimated based on demographic and geographic distribution data from Experian
2 Defined as the share of population with broadband available minus the share of population that subscribe to broadband | 3 From a National Urban League report on the share of each demographic with fixed broadband at home based on ACS data. Nationwide data also uses
ACS estimates of households with “broadband such as cable, fiber optic or DSL” – this excludes households whose only connectivity is through mobile, but may include a small number of households with a sub-25/3 connection
4 Nationwide average adoption gap implies 34M households that choose not to subscribe to broadband – this is slightly different to National Urban League estimate of 29-32M households as a result of slight differences in methodology
5 Of total U.S. households, ~10% have an internet connection through mobile only – this group is approximately one third of the 28% that do not subscribe to fixed broadband
Source: FCC Form 477 June 2020 (Apr 7 2021 release), Experian, National Urban League, ACA Connects, Cartesian
Copyright © 2021 Cartesian, Inc. All rights reserved.                                                                                         8
ACA Connects Broadband Study | Most Recent, Comprehensive Assessment
        Our study uses the most recent data and comprehensive analysis for gigabit deployment cost assessment

                                     2016                                                          2018                                                            2019                                                            2021
                             Paul de Sa                                                 Jim Stegeman1

                   Office of Strategic Planning & Policy Analysis

                                           Where prior studies fall short in determining gig availability costs for 2021                                                                                   Latest data, most comprehensive
           • Uses outdated (2015) data                                     • Uses outdated (2016 A-CAM)                                    • Uses outdated (December                                      ✓ Uses latest data (June 2020)
             (14% of locations were
What Does Gigabit Availability Cost?
        Estimated Costs | Gigabit Deployment
        There are three categories of locations that require funding to ensure gigabit is available to all Americans –
        for each category, we estimate a range of costs to make gigabit available
                                                                                                 We estimate a gigabit deployment cost range for each of the location categories below:
                                                                                                 • Low end: Based on winning gigabit bids in the RDOF auction, which estimates the
                            Location-Based
                                                                                                   minimum government support needed to incentivize deployment using a reverse auction
                        Cost Model Estimation1
                                                                                                 • High end: Full fiber deployment costs based upon actual builds, which estimates the
                                                                                                   maximum possible support amount, should subsidies for the full cost be needed

                                                                                                 The cost to provide access to gigabit to all locations – households/housing units, businesses,
                               Unfunded, Unserved
                                                                                                 and anchor institutions – in unserved census blocks that are not currently receiving funding
                               Census Blocks
                                                                                                 under RDOF or other FCC programs

                               Partially Served                                                  The cost to provide gigabit to unserved households in census blocks that are reported as
                               Census Blocks2                                                    served due to a known FCC reporting issue2

                                                                                                 The cost to provide gigabit to households and businesses in unserved census blocks that are
                               Unserved Areas Receiving                                          currently receiving funding under FCC programs (i.e., ROR, ACAM, and CAF Phase II Auction) –
                               Sub-Gigabit FCC Funding3                                          most of these programs do not require the provision of speeds above 25/3 Mbps and
                                                                                                 therefore may require supplemental funding

1 Cost assessment is based on model that relies on household density, agnostic of proximity to existing infrastructure – see page 21 in appendix for more detail
2 Reflects known reporting issue in FCC Form 477 data that counts a census block as ‘served’ with a given speed if any household in that census block is able to purchase that speed – estimates based on a 2021 study from BroadbandNow measuring the extent of this issue
3 Excludes areas that were funded under RDOF, because FCC review of longform applications is still ongoing
Source: ACA Connects, Cartesian
Copyright © 2021 Cartesian, Inc. All rights reserved.                                                                                         10
What Does Gigabit Availability Cost?
        Estimated Costs | Gigabit Deployment
        Estimated deployment costs increase as the ‘unserved’ threshold increases to higher levels of service
                                                                        All Locations1 with                                    All Locations1 with                                    All Locations1 with                                    All Locations1 with
                Cumulative Costs to
What Does Subsidizing Adoption Cost?
        Estimated Costs | Broadband Adoption
        Estimated adoption subsidy costs increase as program participation rate and duration increase

                                                             Broadband Adoption Cost1 by Program Participation Rate and Duration
                   Duration
                    (Years):
                                               1                       2                      3                       4                      5                       6          7               8               9              10

               Total Cost                        25% Participation                              100% Participation                      Approximate Cost Range                                                                $201B
                        $200B

                                                Currently, 27% of 33M eligible households participate in
                                                 the Lifeline program2 – given this program would offer
                        $150B                                                                                                                                                $142B
                                                   higher subsidies, participation is likely to be higher

                                                                                                                                        $102B                               A ten-year $50/HH subsidy program for Lifeline-
                        $100B                                                                                                                                                 eligible households could cost ~$50B-$201B,
                                                                                                                                                                                   depending on its participation rate1
                                                                                          $63B
                          $50B
                                           $23B                                                                                                                                                                               $50B
                                                                                                                                                                              $35B
                                                                                                                                         $26B
                            $0B                                                           $16B
                                             $6B

1 Based on estimated 33 million households that are currently eligible for the Lifeline program, and $50/mo broadband subsidy plus $100 one-time connected device subsidy
2 From program data on USAC.org (accessed May 2021)
Source: USAC, ACA Connects, Cartesian
Copyright © 2021 Cartesian, Inc. All rights reserved.                                                                                      12
Estimated Costs | Fully Fund Gigabit Availability & Broadband Adoption
        With $400B, policymakers could ensure full gigabit availability and fund an extended adoption program

                                   Full Gigabit                                                                             Full Broadband
                                                                                                                                                                                                     Grand Total
                                   Availability                                                                             Adoption

              $117B - $198B                                                                   +             $50B - $201B                                                                 =    $167B - $399B

            ENSURE EVERY HOUSEHOLD, BUSINESS,                                                              OFFER HIGH-SPEED BROADBAND                                                          ALL-IN ESTIMATED COST OF FULLY
            AND INSTITUTION HAS GIGABIT SPEED                                                             SUBSIDIES TO EVERY LOW-INCOME                                                      FUNDING GIGABIT AVAILABILITY AND
                  BROADBAND AVAILABLE1                                                                         FAMILY FOR 10 YEARS                                                                 BROADBAND ADOPTION

1 Not including locations in areas that were assigned RDOF support, where winning providers are mandated to begin offering 100/20 Mbps+ or gigabit service in almost all areas by 2030
Source: ACA Connects, Cartesian
Copyright © 2021 Cartesian, Inc. All rights reserved.                                                                                    13
How Can Policymakers Prioritize?
        Prioritizing Broadband Funding
        Given the finite – albeit substantial – funding available, how might policymakers set priorities?

               Funding Goal: Maximize the number of Americans that can access essential digital resources

                                                           How should funding be allocated between programs to address the
            Key Questions:
                                                           availability and adoption gaps?

                             1                                Availability Gap                                                                               2                                   Adoption Gap
                         • What threshold should constitute ‘unserved’                                                                                    • What households should be eligible for support?
                           areas that are prioritized for funding?                                                                                        • What per-month subsidy amount should be
                         • What mechanisms1 should be utilized to allocate                                                                                  provided to each eligible household?
                           funds?                                                                                                                         • How many eligible households are likely to
                         • How should new deployment program(s)                                                                                             participate in the program?
                           coordinate with existing federal and state                                                                                     • How long should the program last?
                           programs?

1 E.g., Reverse auctions (as seen in RDOF Phase I) prioritize providers that can connect locations the most cheaply, resulting in a subsidy-efficient mix of new builds and upgrade to existing networks
Source: ACA Connects, Cartesian
Copyright © 2021 Cartesian, Inc. All rights reserved.                                                                                             14
How Can Policymakers Prioritize?
        Example Funding Approach | Cost Assessment
        For $61B-$118B, the U.S. could make gigabit available to 19M locations with less than 100/20 Mbps service
        and substantially increase broadband adoption
                                                                                  Availability                                                                                                                Adoption
                Ensure that the U.S. has adequate infrastructure to enable all households, businesses,                                                                                    Provide support to low-income households
                          and anchor institutions to access speeds of at least 100/20 Mbps                                                                                                  to increase broadband adoption rates

                          Unfunded, Price Cap Areas1                                                Areas Receiving Sub-Gigabit FCC Funding1
                       Unfunded, Unserved CBs                                                                ROR/ACAM                                                                             Low-Income Household
                       All locations in census blocks               $16B-$31B                                All locations in ROR/ACAM     $4.4B-$9.1B                                            Broadband Subsidy3              $26B-$51B
                       reported as not receiving                    8.8M locations                           census blocks that lack       1.8M locations                                                                         8.3M-17M HHs
                                                                                                                                                                                                  5-year subsidy program for
                       100/20 Mbps service                                                                   access to 100/20 Mbps service                                                        Lifeline-eligible households,
                                                                                                                                                                                                  25-50% adoption rate
                       Partially Served CBs2                                                                 CAF II Auction
                       Households lacking 100/20                    $13B-$24B                                All locations in CAF II auction $1.4B-$2.9B
                       Mbps service, in census                      7.4M locations                           census blocks that lack          522K locations
                       blocks reported as                                                                    access to 100/20 Mbps service
                       receiving such service

                                                              $35B-$67B, 19M Locations                                                                                                                      $26B-$51B
                                        Total Cost of $61B-$118B to Ensure Available, Affordable High-Speed Broadband
1 Not including areas that received funding under RDOF Phase I Auction, as nearly all locations were won at 100/20 Mbps or greater
2 Estimate based on a study by BroadbandNow – data from the FCC around broadband availability will be needed to more precisely assess the number of households impacted by partially served CBs
3 Includes $50/month service subsidy and $100 one-time connected device subsidy for participating households
Source: FCC Form 477 June 2020 (Apr 7 2021 release), U.S. Census, BroadbandNow, ACA Connects, Cartesian
Copyright © 2021 Cartesian, Inc. All rights reserved.                                                                                    15
Other Broadband-Related Initiatives
        Additional broadband-related initiatives are competing with broadband deployment and adoption
        programs for limited infrastructure funding
                                       Digital Equity & Inclusion1                                                                                                               Network Backup Generators3
                   1 2                 Investments in digital inclusion initiatives                                                                                              Redundancies to keep Americans connected
                       3
                                       aimed at historically under-connected
                                                                                                                   ~$1B                                                          through climate-related environmental
                                                                                                                                                                                                                                                          ~$2.3B
                                       communities                                                                                                                               contingencies

                                       Additional E-Rate Support2                                                                                                                Climate Resilience for New Builds3
                                       Expansion of existing E-Rate funding                                                                                                      Funding for new deployments to ensure
                                       program to provide support for connectivity
                                                                                                                   ~$3B                                                          resilience to climate events (e.g., floods,
                                                                                                                                                                                                                                                        ~$6-10B
                                       and connected devices                                                                                                                     wildfires, hurricanes)

                                       School Bus WiFi Support2                                                                                                                  Sustainability Incentives3
                                                                                                                                                                                 Incentive programs to provide add’l funding
                                       Outfitting school buses for connectivity for                                ~$1B                                                          for sustainable new builds
                                                                                                                                                                                                                                                          ~$4-7B
                                       commuting students
                                                                                                                                                                                 (e.g., sourcing sustainable materials)

                                                                                                                                                     + Additional sustainability objectives:
                                       Next-Gen 9111                                                                                                    • Installing renewable energy sources to power infrastructure
                                       Completion of the transition of all 911                                   ~$15B                                  • Incorporating sustainable materials and processes in network upgrades
                                       systems from analog to IP-based systems
                                                                                                                                                        • And more…

                                       Low Interest Deployment
                                                                                                                                                                          Education                                      Environment & Sustainability
                                       Financing1                                                                  ~$5B
                                       Provide below market debt financing to                                                                                             Community Investments
                                       accelerate deployments

1 Cost estimates are as quoted in the LIFT Act legislation – remaining estimates explained in appendix (page 29) | 2 Programs enumerated in the Accessible, Affordable Internet for All Act | 3 Programs enumerated in the GREEN Communications Act (S. 1506)
Source: LIFT Act, Accessible Affordable Internet for All Act, GREEN Communications Act (S. 1506), ACA Connects, Cartesian
Copyright © 2021 Cartesian, Inc. All rights reserved.                                                                                        16
Conclusion                                      The digital divide is both an availability problem
                                                        and an adoption problem

                                                        Policymakers can address both broadband needs
                                                        with funding under discussion

                                                        More ambitious goals require broadband
                                                        infrastructure funding amounts to be set at higher
                                                        levels than what has so far been proposed

                                                            See appendix for additional material documenting approaches, calculation methodologies, and supplemental detail

Copyright © 2021 Cartesian, Inc. All rights reserved.                                    17
Appendix

Copyright © 2021 Cartesian, Inc. All rights reserved.      18
Cost Assessment Methodology

                               Additional Availability & Adoption Analyses

Copyright © 2021 Cartesian, Inc. All rights reserved.             19
Cost Assessment Methodology & Example Funding Approach Overview
        Estimation methods for each cost item of the example funding approach outlined below are explained in
        further detail in this section
                     Item in Example Funding Approach                                    Methodology Summary                               Cost Estimate          Pages
                             Unfunded, Unserved Census Blocks                Estimate household and business counts using Census                              $
                             All locations in census blocks reported as      and FCC data, anchor institutions using Experian and           $16B-$31B             22-25
                                                                                                                                            8.8M locations
                             not receiving 100/20 Mbps service               USAF data, and apply cost model framework

                             Partially Served Census Blocks                  Derive estimate of unserved locations in CBs reported
                                                                                                                                            $13B-$24B
                             Households lacking 100/20 Mbps service,         to have service based on FCC and BroadbandNow data
                                                                                                                                            7.4M locations
                                                                                                                                                                   26
                             in CBs reported as receiving such service       and apply average costs from cost model framework

                             ROR/ACAM                                        Map reported ROR/ACAM-supported locations against                                $
                             All locations in ROR/ACAM census blocks         FCC Form 477 deployment data and apply cost model
                                                                                                                                            $4.4B-$9.1B
                                                                                                                                            1.8M locations
                             that lack access to 100/20 Mbps service         framework to remaining unserved census blocks
                                                                                                                                                                   27
                             CAF II Auction                                  Map reported CAF II-supported locations against FCC                              $
                             All locations in CAF II Auction census blocks   deployment and apply cost model framework to                   $1.4B-$2.9B
                                                                                                                                            522K locations
                             that lack access to 100/20 Mbps service         remaining unserved census blocks

                             Low-Income Household Broadband Subsidy          Model total cost of subsidy based on Lifeline adoption
                                                                                                                                            $26B-$51B
                             5-year subsidy program for Lifeline-eligible    rates, program duration, and stipulated subsidy
                                                                                                                                            8.3M-17M HHs
                                                                                                                                                                   28
                             households, 25-50% adoption rate                amounts

                                                                                           $ Uses location-based cost model estimation explained on page 21
Source: ACA Connects, Cartesian
Copyright © 2021 Cartesian, Inc. All rights reserved.                                       20
$       Location-Based Cost Model Estimation
        We used RDOF auction funding data and a full FTTH deployment model to establish low- and high-end
        gigabit deployment cost estimates
                                                                                                     Gigabit Deployment Cost Estimation
                    Approximates range of cost to provide gigabit (i.e., future-proof speeds) to all ‘unserved’ locations, where ‘unserved’ threshold varies based on the scenario modeled

                     Low End: RDOF Auction-Based Gigabit Subsidy Estimates                                                                                                             High End: FTTH Build Cost Estimates
             Use data from the recent RDOF (904) auction around funding per                                                                                   Use density-based modeling around cost of fiber to the home
           location to predict minimum funds needed to incentivize deployment                                                                                        deployment to estimate full fiber build costs
            We examined the results of the RDOF allocation auction (904):                                                                           FTTH build costs are a good high-end estimate:
                                                                                                                                                     • FTTH is currently the only commercially available technology capable of
                                 Winning subsidy per                                          Assessment of the
                                                                                                                                                       delivering gigabit (i.e., >900/500 Mbps)
                                 location for each census                                     relationship between HH
                                 block to receive gigabit                                     density and auction subsidies                          • Cost estimates capture the maximum possible support amount, should
                                                                                                                                                       subsidies for the full build cost be needed to incentivize deployment
            We used the relationship between HH density and cost to predict                                                                         We estimate the cost to pass a household with fiber based on
            support costs associated with new census blocks:                                                                                        the density of that household’s surrounding area:1
                Density Range                   Support per
                                                                                                                                                                                                  Cpass = $7,549 - $2,161 * log10(Density)
                  (HHs/mi2)                      Location

                                                                                                                                                      Cost to Pass One
                                                                                                                                                                         $10,000
                                                                                                                                                                                                           MN Fiber Co.

                                                                                                                                                        Household
                      1 – 10                         $2.7K
                    10 – 100                         $1.4K                            Support = $3,449 -                                                                  $5,000       VA Fiber Co.
                                                                                                                                                                                                                                        TN Muni-fiber Network
                                                                                                                                                                                                                                                    VZ FiOS Network
                  100 – 1000                         $1.1K                           $845 * log10(Density)                                                                                            Google Fiber, Kansas City
                                                                                                                                                                             $0                            Cincinnati Bell Telecom
                 1000 – 10000                        $732
                                                                                                                                                                                   1                  10                  100                   1,000                 10,000
                     10000+                          $635                                                                                                                                                Household Density (per mi2)
1 Deployment data and analysis conducted in a 2019 Cartesian/Fiber Broadband Association study estimating the cost of increasing fiber deployment in the United States
Note: Locations already served with fiber that have at least 50 Mbps upload have a cheaper upgrade path to gigabit than other technologies – costs in these areas were estimated to be 10% of our model predictions, since existing fiber infrastructure generally removes the
need for new pipes, and instead only requires upgrades to electronics
Source: FBA, FCC, ACA Connects, Cartesian
Copyright © 2021 Cartesian, Inc. All rights reserved.                                                                                       21
Locations in Unfunded,
        Unfunded, Unserved Census Blocks                                                                                                                                              Unserved CBs

        We identified unserved census blocks and calculated a range of estimated gigabit deployment costs

                                                                • Exclude Previously Funded Census Blocks
             Identify Applicable                                  Remove census blocks that received funding through existing FCC programs (i.e., ROR, ACAM, RDOF,
               Census Blocks                                      CAF Phase II Auction) in order to prioritize blocks that have not yet been allocated FCC support

                                                                • Exclude Geostationary Satellite Providers
                                                                  Geostationary satellite internet has lower capacity with higher latency, and is therefore insufficient
                                                                  for many critical internet use cases (e.g., video conferencing)
                 Identify Census
                 Blocks that Are                                • Identify Maximum Available Speeds
                                                                  Use FCC Form 477 data (June 2020) to identify reported maximum speeds to each census block
                    Unserved
                                                                • Group Census Blocks According to Available Speeds
                                                                  Identify which census blocks are unserved, e.g., with less than 100/20 Mbps speeds available

                                                                • Locations within Unfunded Unserved Census Blocks
                                                                  Estimate total locations in each category using various data sources:
           Identify Households,
            Businesses, Anchor                                                     Households                                 Businesses                                  Anchor Institutions
                                                                     Append 2010-2020 U.S. Census Data to census   Estimate based on a ratio of RDOF-supported   Identify unfunded anchor institutions using
               Institutions                                          blocks that were unfunded or unserved         businesses to household locations             Experian and published FCC E-Rate recipients

Source: FCC Form 477 June 2020 (Apr 7 2021 release), U.S. Census, ACA Connects, Cartesian
Copyright © 2021 Cartesian, Inc. All rights reserved.                                                              22
Locations in Unfunded,
        Household Location Tabulation                                                                                                                                 Unserved CBs

        We estimate households per census block using 2020 census block group level population

                                               2020 Household Estimation                                           Final Household Location Determination
            • Data Limitations: At the time this report was created, 2020 census                         • Choosing Housing Units or Households: We use the greater of
              block-level tabulations were unavailable                                                     2010 housing units or 2020 households per census block to
                                                                                                           ensure that housing stock with no residents would not be unfairly
            • Population Growth: To approximate 2020 households, we obtained
                                                                                                           excluded from our cost model
              block-group-level 2010-2020 population growth rates from the
                                                                                                                                    Census Block A:
                                                                                                                                                                   Household Location
              American Community Survey (via Experian) and applied them to all
              blocks in each group                                                                                                                                   Model Input:
                                                                                                            2010                                            CB A grew in HHs by 20%:
                                                                                                            existing HH                                     6 HHs > 5 2010 HUs: 6 locations
                          2010 Households:                            2020 Households:
                                                                                                            2010-2020
                                                                                                            added HH                Census Block B:
                             CB HHs                                        CB HHs
                                                                            115                             2010                                            CB B grew in HHs by 66%:
                              100                                                   CB HHs CB HHs
                                                  CB HHs CB HHs                                             Housing Unit                                    5 HHs < 7 2010 HUs: 7 locations
                                                   500    300                        525    315
                 CB HHs                                           CB HHs
                  200                                              230

                                                                                                          Estimated Costs to Connect Unserved, Unfunded Households
               CBG pop growth:                 CBG pop growth:
                    15%                              5%                                                                        7.4M
                                                                                                               $          UNSERVED, UNFUNDED      Location-Based      $14B - $27B
                                                                                                                        HOUSEHOLDS
Locations in Unfunded,
        Unserved Businesses                                                                                                                                                         Unserved CBs

        We used the ratio of households to businesses from the RDOF auction to approximate business locations

                       Calculate RDOF Business to Household Ratio                                                                    Approximate Businesses in Prioritized Census Blocks
                We approximated the ratio between households and                                                                 We used this ratio from the RDOF auction to approximate the
               business locations included as part of the RDOF auction                                                            number of businesses in prioritized unserved census blocks
           • Identified Locations for Funded Census Blocks: Using the FCC RDOF                                              • Identified Unserved Households: Using Form 477, we identified all
             Dashboard, we found all census blocks that received support, and                                                 ‘unserved’ census blocks, and calculated the number of households in
             the corresponding number of locations                                                                            these census blocks
           • Assessed Households in Each Census Block: For each census block,                                               • Applied Previous RDOF Business Ratio: We applied the previous RDOF
             we identified the number of households associated with the census                                                household-to-business ratio to approximate the total businesses that
             block using U.S. census data                                                                                     would also require funding in that area
           • Inferred Difference as Business Locations: We subtracted the                                                   • Approximated Range of Costs: We estimated a range of costs associated
             number of households in these census blocks from number of                                                       with gigabit deployment using the average gigabit RDOF award per location
             locations – remaining locations should correspond to businesses                                                  (low end), and average fiber deployment cost per location (high end)

             Estimated Business Locations in RDOF (904) Auction:                                                             Approximate Business Locations and Costs, E.g.,
Locations in Unfunded,
        Anchor Institutions Cost Methodology                                                                                                                                                          Unserved CBs

        We identified anchor institutions without service, eliminating any with existing funding

                                    Anchor Institutions                                                                 Identify Unserved (E.g., 100/20 Mbps)1
                                                (375K)
                                                                                                                      384K                                  Unserved Institutions:
                                       Justice and                                                               Remaining anchor                           Remaining anchor institutions without access to service at the
                                  Safety Activities                                                                Institutions                             speed threshold (e.g.,
Unserved Households
        Unserved Households in Partially Served CBs                                                                                                                                                                                         in Partially Served CBs

        There are additional households lacking service in ‘served’ census blocks due to a reporting limitation
                             Form 477 Methodology Limitation                                                                                Calculate Households in Partially Served Census Blocks
           Form 477 is known to systematically overstate broadband
                                                                                                                                                                                                                                  Internet at Form 477 Reported Speeds
           availability:                                                                                                                  Illustrative                                                                            No Internet Availability
                                                                                                                                                                                                                                  Broadband Connection
              • Form 477 does not ask ISPs to report location-level service availability                                                  Example of
              • If an ISP serves at least one household in a census block, they simply                                               Partially Served
                report that the census block is served                                                                                 10 Household                                                                                Form 477 would suggest the
                                                                                                                                                                                                                                      ISP in this census block
              • As a result, some census blocks are only ‘partially served’, with some                                                  Census Block
                                                                                                                                                                                                                                     serves all 10 households
                households in the block having either:
                       A Slower Speeds Than Reported                                                                                                                                                                         !    20% do not have any internet

                    B No Service at All
              • Most historical broadband funding programs, including CAF II and RDOF,                                              ESTIMATION METHODOLOGY FOR HOUSEHOLDS IN PARTIALLY SERVED CBS
                have determined eligibility at the census block level, thereby withholding                                          (E.G., BELOW 100/20 MBPS ESTIMATE)
                funding for households in partially served census blocks                                                            There is no precise data on the number of households in partially served census blocks – we
                                                                                                                                    approximate based on the results of a recent study:1
           This limitation has been widely acknowledged:                                                                                                                                                                  $1.8K/HH
                                                                                                                                         6.7%1                    110.7M                                                   RDOF GIGABIT

             “There's strong evidence…that the percentage of Americans without                                                        HHS LISTED AS
                                                                                                                                                                US HHs WITH AT                 7.4M                        BENCHMARK3                         $13B -
                                                                                                                                                                 LEAST 100/20               HOUSEHOLDS
             broadband access is much higher than the figures reported by the FCC.”                                                   SERVED THAT
                                                                                                                                        ARE NOT
                                                                                                                                                                 SERVICE, EXCL               IMPACTED                     $3.2K/HH                            $24B
                                    — John Kahan, Chief Data Analytics Officer, Microsoft                                                                     PREVIOUSLY FUNDED2                                               FTTH
                                                                                                                                                                                                                            BENCHMARK3

                        Households in partially served census blocks should be                                                        This estimate assumes a similar distribution of households in partially served census blocks throughout
                                                                                                                                                         the country, regardless of speeds available to the census block
                        identified and included in future broadband programs
1 Based on BroadbandNow study that sampled serviceability for 11.6k households and compared to Form 477 data – several assumptions in that study were conservative, including the assumption that smaller providers for which serviceability was not validated always provided
Form 477 advertised speeds. Study found that ~6.5% of additional U.S. households are unserved, in addition to those that the FCC reports – these households are all concentrated in areas the FCC reports as having 25/3 Mbps+, which implies that 6.7% of ‘served’ households are not
2 Based on Cartesian analysis of U.S. households in Census Bureau data (see page 23) | 3 Derived from costs associated with median density of populated census blocks using the location-based cost model
Source: Cartesian, FCC Form 477 June 2020 (Apr 7 2021 release), Microsoft, BroadbandNow Research: ‘FCC Reports Broadband Unavailable to 21.3 Million Americans, BroadbandNow Study Indicates 42 Million Do Not Have Access’
Copyright © 2021 Cartesian, Inc. All rights reserved.                                                                                        26
Unserved ROR/ACAM,
        Areas Receiving Sub-Gigabit FCC Funding                                                                                                                    CAF Phase II Locations

        We modeled the cost of providing gigabit to unserved census blocks that are currently receiving funding
        under FCC programs – these programs may require supplemental funding to provide gigabit

           Subsidy Program                                                               ROR/ACAM                                                CAF PHASE II AUCTION

                 Timeframe                                                               2017-2026                                                    2018-2028

                                                                                 Identified census blocks that were part of each FCC-funded program, and applied the
              Methodology
                                                                                          location-based cost model to those below the ‘unserved’ threshold

                                                         5.8M                4.2M          1.6M        .14x            217K     617K       158K        458K         .14x         64K
                                                                              HHs                    BUSINESS                               HHs                   BUSINESS
                                                          TOTAL                          UNSERVED                  UNSERVED     TOTAL                 UNSERVED                 UNSERVED
                                                                             WITH                     TO HH                                WITH                    TO HH
                                                           HH                              HHs                     BUSINESSES    HH                     HHs                    BUSINESSES
                                                                            100/20+                   RATIO                               100/20+                  RATIO

        Estimated Costs to
               Connect                                                                               $1.8K/HH                                                     $1.8K/HH
                                                                                                      RDOF GBPS                                                    RDOF GBPS
                                                                   Location-                                       $380M -           Location-                                 $112M -
       (e.g.,
Low-Income Household
        Broadband Adoption Subsidy Estimated Costs                                                                                                                                                  Broadband Subsidy

        With 25-50% participation, 5-year subsidies for broadband and connected devices would cost $26B-$51B

                                                                                                                       Program Duration
                                                                                                                                                                                              • Program cost1 includes a
                                                                 1 Year                        2 Years                         3 Years                         5 Years         10 Years         $50/month broadband
                                                                                                                                                                                                subsidy and $100 one-
                                                                                                                                                                                                time connected device
                                         10%                     $2.3B                           $4.3B                           $6.3B                         $10.2B          $20.1B           credit per participating
                                                                                                                                                                                                household
                                                                                                                                                                                              • Overall cost is dependent
                                         25%                     $5.8B                          $10.7B                         $15.7B                          $25.6B          $50.3B           on participation rate and
                                                                                                                                                                                                program duration

             Program
           Participation                 50%                    $11.6B                          $21.5B                         $31.4B                          $51.2B          $100.7B
               Rate                                                                                                                                                                           • 27% of eligible
                                                                                                                                                                                                households participate in
                                         75%                    $17.3B                          $32.2B                         $47.0B                          $76.7B          $151.0B          the Lifeline program2 –
                                                                                                                                                                                                given this program would
                                                                                                                                                                                                offer higher subsidies,
                                                                                                                                                                                                adoption may be even
                                        100%                    $23.1B                          $42.9B                         $62.7B                         $102.3B          $201.3B          higher

                                                                                                                                                                    Low Cost      High Cost
1 Based on estimated 33 million households that are currently eligible for the Lifeline program, and $50/mo broadband subsidy plus $100 one-time connected device subsidy
2 From program data on USAC.org
Source: FCC Form 477 June 2020 (Apr 7 2021 release), U.S. Census, ACA Connects, USAC, Cartesian
Copyright © 2021 Cartesian, Inc. All rights reserved.                                                                                      28
Other Broadband-Related
                         Costs Associated with Broadband-Related Initiatives                                                                                                                                          Initiatives

                         There are significant costs associated with other proposed broadband-related initiatives
                                          Line Item                                                                                                        Modeling Approach
                                Additional E-Rate Support1                                               $5K                                 $3K                         $15K                           146K
                                Subsidy to increase on premise connectivity                       SUBSIDY FOR MODEM                  SUBSIDY FOR HOTSPOTS        SUBSIDY FOR CONNECTED                 TOTAL E-RATE            ~$3B
                                across rural schools                                                AND/OR ROUTER                       AND REPEATERS                    DEVICES                      INSTITUTIONS3

                                School Bus WiFi Support1                                                                                                                 90%                            $1.5K
                                Subsidy to subsidize WiFi connectivity for rural
                                                                                                        114K                                  5                    E-RATE PARTICIPATION         YEARLY COST FOR BUS WI-FI      ~$1B
                                                                                               CURRENT E-RATE SCHOOLS3                 BUSES PER SCHOOL4
                                school buses                                                                                                                               RATE                         SERVICE

                                Network Backup Generators2                                                            $143K                                           32K                               50%
                                Redundancies to keep Americans connected                          COST TO OUTFIT A NETWORK CENTRAL OFFICE WITH                  CENTRAL OFFICES AND             EXISTING LOCATIONS WITH       ~$2.3B
                                through climate-related environmental emergencies               BACKUP GENERATORS AND FUEL SUPPLY, 2021 DOLLARS5             HEADENDS IN U.S. NETWORKS                   BACKUP

                                                                                                                    $8.5B + $28.5B ($37B)                                $7.1B + $35.6B ($6B INCR.)
                                Climate     Resilience2                                         LOW:           IMPLIED ALLOCATION OF FUNDS TO AERIAL AND                 IMPLIED ALLOCATION OF FUNDS TO AERIAL AND
    E.g.,
Summary of Key Cost Model Assumptions
        There are a number of assumptions involved in our cost model
               1       Support amounts for gigabit deployment under the RDOF auction are a reasonable proxy for future deployment
                       subsidy requirements in areas with similar household density

               2       Future fiber deployment costs would be similar to previous fiber deployment costs in areas with similar
                       household density (i.e., estimation does not account for proximity to existing infrastructure)

               3       Number of households per census block would be equivalent to 2010 census data with proportional population
                       growth applied

               4       Deployment costs to households in partially served census blocks would be similar to average per-location costs
                       from the location-based cost model

               5
                       Areas currently receiving FCC funding would have similar costs of gigabit deployment as other areas (i.e., same
                       models used to estimate cost of gigabit deployment for all areas)

               6       Areas with fiber available but sub-gigabit speeds would require ~10% of modeled costs to upgrade to gigabit
                       speeds (i.e., typically only electronics upgrades required)

               7
                       Businesses have similar geographic dispersion as households (i.e., costs to deploy fiber to businesses are similar
                       to that of households in areas with similar household density)

Source: ACA Connects, Cartesian
Copyright © 2021 Cartesian, Inc. All rights reserved.                        30
Broadband Cost Assessment Studies
        Our fiber deployment costs for unserved rural areas are lower than previously published studies – this is
        likely because we use updated deployment data, and unserved HHs have decreased over time
                 Study and Year                                                                  Key Finding                                                                        Comparison to This Assessment
                                                                                                                                                                                             Fiber to All Sub-Gigabit Areas:
                                                                 “…90% of US HHs can be passed with fiber for an                                                                                 $128B – $210B
                                                                         estimated [incremental2] amount of $70B”                                                   The Fiber Broadband Association study did not model costs for the top
                                                                                                                                                                    10% most expensive areas, but methodologies are similar between our
                             2019                                                                                                                                                     study and the FBA assessment

                 Jim Stegeman1                                                                                                                                                     Fiber to All Unserved (
Cost Assessment Methodology

                               Additional Availability & Adoption Analyses

Copyright © 2021 Cartesian, Inc. All rights reserved.             32
Gigabit Download Availability over Cable
        Over 50 million U.S. households with cable broadband service have access to gigabit download speeds –
        these networks typically offer at least 20 Mbps upload
                                                                                             Number of Households with:
                                                                                                                 Above Baseline
                        Unserved                                              Baseline                                                                        Gigabit1
ISP Speed Tiers between 100/20 and 100/100 Mbps
        Of 54.3M Americans with access to a sub-100/100 package but above baseline1 service, 51.5M (95%) have
        access to gigabit or near-gigabit download speeds
                                                             Top 10 Packages In 100/20 - 100/100 Mbps Group by Total Households
                 Speed Tier2                                                                               Number of Households
                     940/35                                                                                                                           19.3M
                     987/35                                                                                                                           19.2M
                    1000/50                                                                         5.6M
                    1000/35                                                                         5.4M
                    1000/20                                   820K
                     400/50                                471K
                    1000/25                               348K
                     400/40                               335K
                     300/50                              317K
                     100/20                              280K
                      Other                          1.4M 922K            2.3M
                                                                                                                          Gigabit or Near-Gigabit Download Speeds
1 “Above Baseline” = 100/20 Mbps – 900/500 Mbps
2 Reflects the maximum speeds available to each census block (highest download speed prioritized)
Source: FCC Form 477 June 2020 (Apr 7 2021 release), U.S. Census, ACA Connects, Cartesian
Copyright © 2021 Cartesian, Inc. All rights reserved.                                                      34
Geographic Distribution of Availability and Adoption Gap
        Areas with a larger broadband availability gap are typically rural, while the problem of broadband non-
        adoption is geographically diverse
                                                                    Availability Gap                                                 Adoption Gap
                                                   (% of HHs without 25/3 Mbps+ available)                      (% of HHs with fixed broadband available that don’t subscribe)
           0%
         Size of Gap

                                      Places with a larger availability gap are typically                              Adoption gap is widespread across both
       100%                             localized to extremely rural parts of the U.S.                                        rural and non-rural areas

Source: FCC Form 477 June 2020 (Apr 7 2021 release), Experian, American Community Survey 2019, Cartesian
Copyright © 2021 Cartesian, Inc. All rights reserved.                                                      35
Overview of 2019 ACS Broadband Adoption Data
        The American Community Survey provides the most recent statistics on broadband adoption for American
        families – results from the 2019 ACS are used throughout our report and are summarized below
                                                                                                                                                  Connectivity Types and Survey Questions:
                                   121M American Households
                                                                                                                   “No access to the Internet”: 20.5M                                                                   No
            38M American                                                                                           At this house, apartment or mobile home – do you or any member of this household have
              households                                                                                                                                                                                             Internet
                                                               17%                                                 access to the internet?
                  without
                                                                                                                   “Cellular data plan with no other type of Internet subscription”: 12.1M
               broadband                                                               0.4%
                (includes both no                              10%                                                 Do you or any member of this household have access to the Internet using a cellular data plan
                                                                                                                   for a smartphone or other mobile device?
               availability and no                                                     1%
                        adoption)                                                                                  “Dial-up Internet service with no other type of Internet subscription”: 437K
                                                                                       3%                          Do you or any member of this household have access to the Internet using a dial-up Internet
                                                                                                                                                                                                                     Unfixed
                                                                                                                   service installed in this household?                                                              or Likely
                                                                                                                                                                                                                       Sub-
                                                                                                                   “Satellite Internet service with no other type of Internet subscription”: 1.1M                    Baseline
                                                                                                                   Do you or any member of this household have access to the Internet using a satellite Internet     Service
           83M American                                                                                            service installed in this household?
         households with                                       69%
         fixed broadband
                                                                                                                   Other combination of services1: 3.8M

                                                                                                                   “Broadband such as cable, fiber optic or DSL”: 83.2M                                               Likely
                                                                                                                   Do you or any member of this household have access to the Internet using a broadband (high        Baseline
                                                                                                                   speed) Internet service such as cable, fiber optic, or DSL service installed in this household?   or Above

Note: Specific figures may differ slightly from NUL/Census reporting due to use of 5-year estimate vs. 1-year spot estimates (these figures reflect the 2019 5-year estimates)
1 Including any households with an internet subscription who do not fall under any of the previous four categories, or have some combination of cellular / satellite / dial-up connectivity
Source: FCC Form 477 June 2020 (Apr 7 2021 release), U.S. Census, American Community Survey 2019, Cartesian
Copyright © 2021 Cartesian, Inc. All rights reserved.                                                                                            36
Adoption and Age
        Areas with the greatest share of population 65+ have the same adoption gap as younger areas
                                  Broadband Availability and Adoption by % of Population Above 65
          Share of Census Block
                                                        Nationwide                                     < 10%                                   10-25%                                    >25%                  Commentary
                   Group as 65+
            % of Census Block Groups                            100%                                      21%                                      66%                                   13%

                     Availability Gap                                            3%                                       1%                                        4%                          4% Based on this analysis, there does
                 Fixed Broadband Not
                           Available1                                                                                                                                                                not seem to be a correlation
                                                                                                         28%                                                                                         between age and broadband
                       Adoption Gap2                           28%                                                                                28%                                    28%         adoption
                    Fixed Broadband
              Available, no Adoption
                                                                                                                                                                                                     Slight Difference in Availability Gap:
                                                                                                                                                                                                     On average, about 16% of the
                                                                                                                                                                                                     population nationally is above 65. Areas
                                                                                                                                                                                                     with younger populations tend to have
                                                                                                                                                                                                     a smaller availability gap as they tend to
                                                                                                                                                                                                     be located in more developed urban
                                                                                                                                                                                                     areas
              Broadband Adopted
                   Fixed Broadband                             69%                                       71%                                      68%                                    68%         No Difference in Adoption Gap:
             Available and Adopted3                                                                                                                                                                  The population of retirement-age
                                                                                                                                                                                                     Americans is not correlated with a
                                                                                                                                                                                                     difference in the adoption gap – census
                                                                                                                                                                                                     blocks with a >25% of the population
                                                                                                                                                                                                     65+ has a nearly identical adoption gap
                                                                                                                                                                                                     as the nationwide average

1 Based on availability data from Form 477 of households with access to speeds of at least 25/3 Mbps – availability by group is estimated based on age distribution data from Experian
Source: FCC Form 477 June 2020 (Apr 7 2021 release), Experian, Cartesian
Copyright © 2021 Cartesian, Inc. All rights reserved.                                                                                         37
BOSTON

                                                                            KANSAS CITY

                                                                             LONDON

                                                                            NEW YORK

                                                                               PARIS

www.cartesian.com   Copyright © 2021 Cartesian, Inc. All rights reserved.
You can also read