Full Technical Report: Climate Change and Flash Floods
←
→
Page content transcription
If your browser does not render page correctly, please read the page content below
Copernicus Climate Change Service

                         Full Technical Report:
          Climate Change and Flash Floods

Author name: Günter Humer 1, Stefan Achleitner 2, Simon Lumassegger 2, Andreas Reithofer 1

Author organization: 1: Dipl.-Ing. Günter Humer GmbH, Austria
                     2
                      : Unit of Hydraulic Engineering, University of Innsbruck, Austria

Full Technical Report: Climate Change and Flash-Floods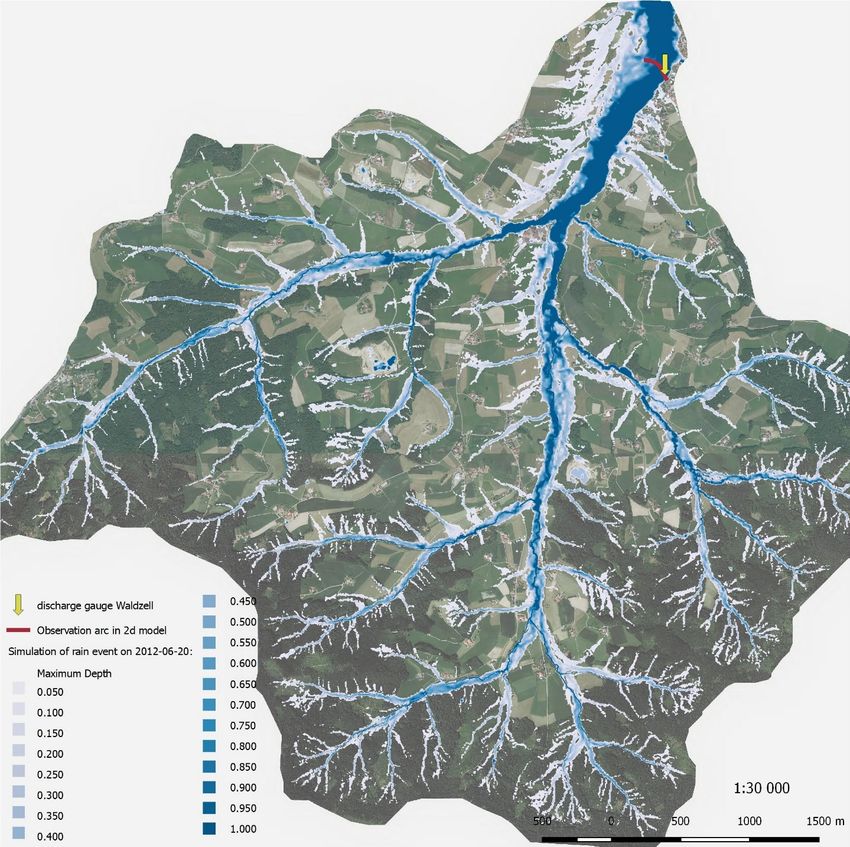
Copernicus Climate Change Service

Summary
The government of Upper Austria prepares a tender for a state-wide hazard map of flash flood
endangered areas away from permanent water bodies. Areas prone to inundation shall be delineated
using computer simulations. The boundary conditions for these simulations (design rain under
climate change, initial soil moisture conditions) must be derived.
The investigation of flash-floods and the triggering preconditions showed that rain exceeding a
certain amount can trigger a flash flood independent of preconditions, although the necessary rain
must be higher if soil is less saturated following less antecedent rain. As the first results show a big
influence of preconditions on the discharge of a flash-flood, we recommend using a highly saturated
soil.
The IDF curves from this study showed lower intensities that the corresponding Austrian design rains.
The climate impact indicators show an increase in rain intensities for all emission scenarios.
Therefore, it can be assumed that design-rains should increase accounting for future climate
conditions. The client will set the rain intensities for his project of a hazard-map considering these
insights.

Full Technical Report: Climate Change and Flash-Floods
Copernicus Climate Change Service

Contents
Introduction............................................................................................................................................. 1
   Step 1: Assessment of relative changes of design rainfall based on pan European indicator
   (provided by SWICCA) ......................................................................................................................... 2
       Description: ..................................................................................................................................... 2
       Results: ............................................................................................................................................ 3
   Step 2: Relative changes to design rainfalls (varying durations and intensities) from pan European
   data are applied to local design rainfalls............................................................................................. 5
       Description: ..................................................................................................................................... 5
       Results: ............................................................................................................................................ 5
   Step 3: Simulation of flash flooding considering varying inputs (durations and intensities) .............. 6
       Description: ..................................................................................................................................... 6
       3.1 Project region Poneggen ........................................................................................................... 6
       3.2 Project region Wallern............................................................................................................... 6
       Results: ............................................................................................................................................ 7
       3.1 Project region Poneggen ........................................................................................................... 7
       3.2 Project region Wallern............................................................................................................. 13
   Step 4: Assess preconditions given at past flash flood events. Prior rainfall intensity and/or sums
   may be derived from pan European or local rainfall datasets. ......................................................... 15
       Description: ................................................................................................................................... 15
       Results: .......................................................................................................................................... 17
   Step 5: Simulation of flash flooding (hydrology and hydraulic) using different preconditions. ....... 21
       Description: ................................................................................................................................... 21
       Results: .......................................................................................................................................... 22
   Step 6: Derive flood extent maps (local data, e.g. DEM) .................................................................. 26
       Description: ................................................................................................................................... 26
       Results: .......................................................................................................................................... 26
   Step 7: Derive flood inundation maps based on local data (e.g. DEM)............................................. 27
       Description: ................................................................................................................................... 27
       Results: .......................................................................................................................................... 27
   Step 8: Comparison of flood extent and inundation maps due to original and altered design rainfall
   input. Present the results to the client and describe the effects of preconditions and altered design
   rains on flash floods. Derive flood inundation maps based on local data (e.g. DEM) ...................... 31
       Description: ................................................................................................................................... 31

Full Technical Report: Climate Change and Flash-Floods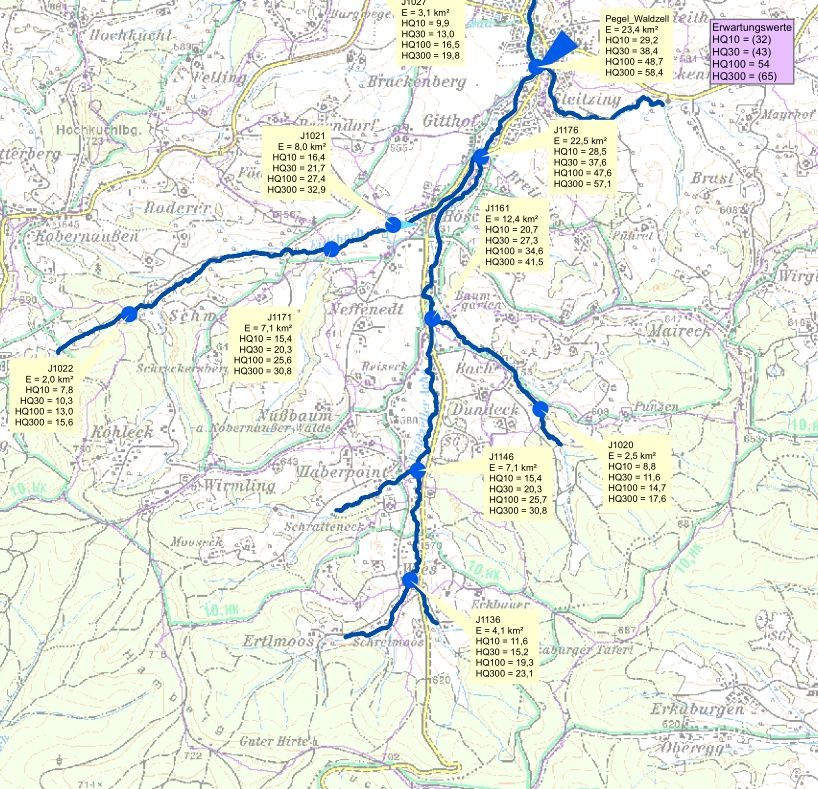
Copernicus Climate Change Service

       Results: .......................................................................................................................................... 31
   Step 9: Derivation of the sensitivity of flood extents / inundations onto initial loss variations ....... 32
       Description: ................................................................................................................................... 32
       Results: .......................................................................................................................................... 32
Conclusion of Full Technical Report ...................................................................................................... 33
References ............................................................................................................................................. 34

Full Technical Report: Climate Change and Flash-Floods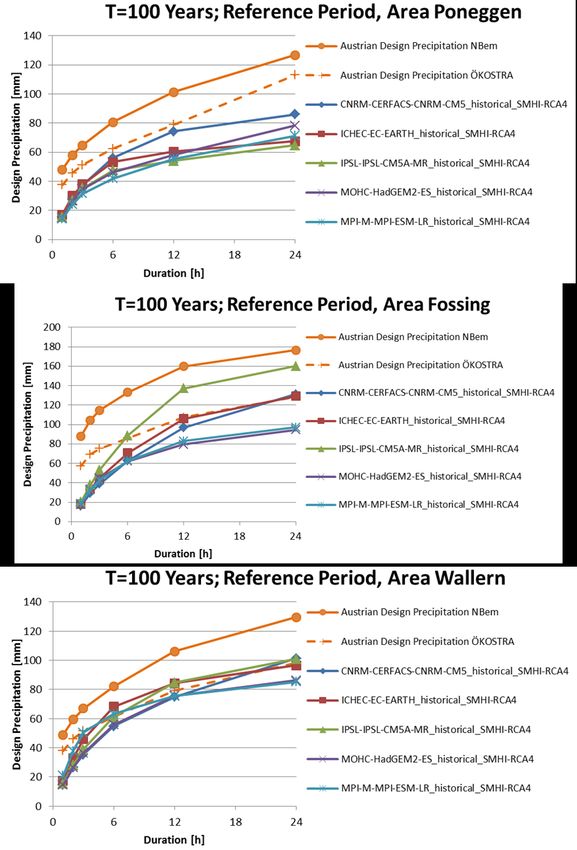
Copernicus Climate Change Service

Introduction
The government of Upper Austria prepares a tender for a state-wide hazard map of flash flood
endangered areas away from permanent water bodies. Areas prone to inundation shall be delineated
using computer simulations. The boundary conditions for these simulations (design rain under
climate change, initial soil moisture conditions) must be derived.
For the client, basically two aspects are of interest:
    •     What assumption can be made for the initial loss in a design process?
    •     How do design rainfalls alter under climate change conditions?
The first aspect can be categorized as an indicator regarding the proneness to flash flooding with
regard to initial conditions of a catchment. The second question is answered by providing (a) the
relative or (b) the absolute change of rainfall input.
The case study deals with flash floods occurring away from permanent water bodies. Storm event of
high intensity introduce an overland flow and flood situation before the water reaches a river or
creek. Today, the federal government seeks to prepare state wide maps, indicating zones prone to
flash flood. Instead of deriving classical flood hazard maps indicating recurrence intervals and flood
inundations for certain recurrence intervals, zones being save from flash flooding are intended to be
mapped. Classical inundation mapping is planned in a second step, considering a more detailed
simulation approach.
For the flash flood simulations, standardized boundary conditions, initial conditions and inputs under
current and future climate situation are to be derived. Whereas current design rainfalls are available
in Austria, altered design rainfalls (or relative changes) are not. Secondly, the preconditions in the
rainfall-runoff situation are to be defined. Change in design rains and soil moisture data in
combination with daily rain-sums for the reference period and future period give the bandwidth for
the selection of initial conditions and allow accounting for the future situation.

     Change of           Relative changes        Simulating
                             in design          flash floods                               Comparison of
     design rain            discharges          with varying                                  maps
                                                   inputs
                                                                                 Flood
                                                               Flood extent
                                                                              inundation
                                                                   maps
      Preconditions:        Correlation     Simulating flash                     maps       Derivation of
       events from         between rain       floods with                                   the sensitivity
    firebrigade, prior    and flashfloods       different                                  of flood extents
       rainfall-sums                         preconditions

Full Technical Report: Climate Change and Flash-Floods                                                        1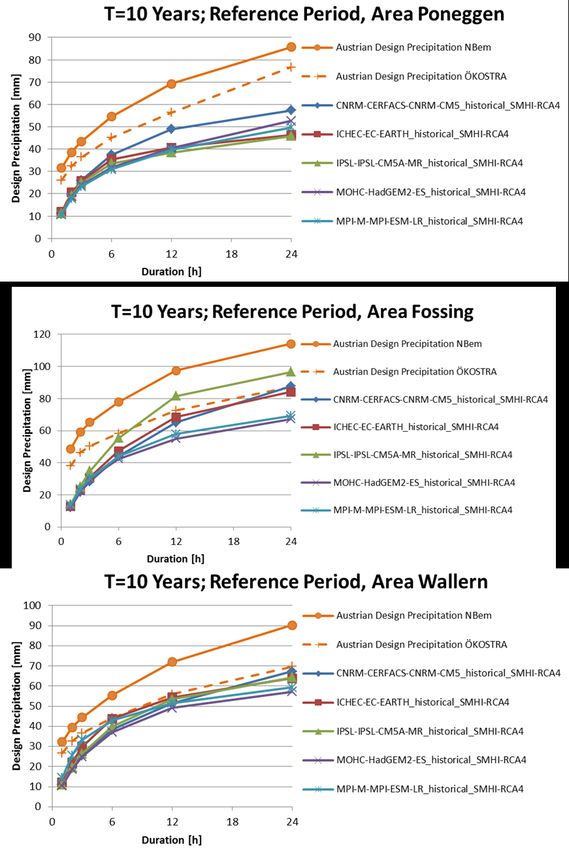
Copernicus Climate Change Service

Step 1: Assessment of relative changes of design rainfall based on pan
European indicator (provided by C3S SIS for water)
Description:
For part (a), altered design rainfall under climate change conditions, the following indicators have
been used and compared:
Copernicus Climate Change Services Sectorial Information Service for water (C3S SIS for Water)
portal: “Precipitation Intensity Duration” (formerly: “Intensity Duration Frequency IDF”)
Portal of National Hydrological Service http://ehyd.gv.at: “Bemessungsregen” (design precipitation)
In the first step, the pan European design rainfall indicators provided by C3S SIS waterwere
compared with Austrian design rainfall values. The local design rainfalls were retrieved from the
internet platform “eHYD”, which is a portal of the Austrian hydrological service. On this platform,
three types of design rainfalls are specified for different durations and return periods. The ÖKOSTRA
design rainfalls are based on the statistical evaluation of heavy rain events from rain gauges. They
form the lower boundary of applicable design rainfalls in Austria. The MaxMod data were derived
from precipitation model calculations under maximized initial boundary conditions. The values are
generally considered to be too high and therefore form the upper limit of possible design rainfalls.
The design rainfall data NBEM correspond to the weighted mean of MaxMod and ÖKOSTRA and are
commonly applied for flood protection measurements.
A general limitation of the data sets obtained from the demonstrator is that design rainfall durations
are limited to hourly values as a minimum time span. Relevant events for flash floods in the past
showed often smaller, sub-hourly durations. Most of the observed events are between 20-45
minutes.
In the test areas large discrepancies have been observed for short duration events which are the key
driver for flash floods. This is shown in Figure 1 for a recurring interval of 10 years and in Figure 2 for
a recurring interval of 100 years. For example, the lowest Austrian design precipitation ÖKOSTRA for
a recurring interval of 10 years is considerably higher than the design rainfall values provided from
C3S SIS for water for a 100-year recurring interval. As for our study only punctual values were used, a
bias correction to the pan-European C3S SIS water data was not performed.
For duration stages above 6 hours, the values correspond better but these values are not applicable
for flash flood simulations. To illustrate the discrepancies for the 1h duration stage, even the T=100
value (24,8 mm) for the worst 2080 scenario from C3S SIS water is lower than the ÖKOSTRA T=10
value (26,1 mm) in the test area Poneggen.
For the case studies also the relative changes of adjacent cells provided by C3S SIS water have been
analyzed. For this purpose, the mean relative changes of the 2080 RCP4.5 and RCP8.5 scenarios were
created for a recurrence interval of 100 years. In the study areas Wallern and Fossing, the changes to
adjacent cells were low compared to mean changes between the RCP4.5 and RCP8.5 scenarios.
In the study area Poneggen, the maximum change to an adjacent cell for RCP4.5 was around 10% and
for RCP8.5 around 11%. The difference between the mean RCP 4.5 and RCP 8.5 scenarios for this
area was around 12% hence the spatial relative changes seem very high for this area.

Full Technical Report: Climate Change and Flash-Floods                                                   2
Copernicus Climate Change Service

Results:

Figure 1: Comparison of national and pan European design precipitation values for 10 year recurrence interval

Full Technical Report: Climate Change and Flash-Floods                                                          3
Copernicus Climate Change Service

Figure 2: Comparison of national and pan European design precipitation values for 100 year recurrence interval

Full Technical Report: Climate Change and Flash-Floods                                                           4
Copernicus Climate Change Service

Step 2: Relative changes to design rainfalls (varying durations and
intensities) from pan European data are applied to local design
rainfalls.

Description:
From the portal, the mean relative changes for 2020, 2050 and 2080 of the RCP4.5 and RCP8.5
scenarios were derived (Table 1). These relative changes were applied to the NBEM data for the
study areas Poneggen, Fossing and Wallern.

Results:
Poneggen               2020-T10   2020-T50 2020-T100 2050-T10     2050-T50 2050-T100 2080-T10   2080-T50 2080-T100
D=1h MEAN RCP 4.5        15%        16%       16%      23%          27%       28%      34%        39%       41%
D=1h MEAN RCP 8.5        16%        18%       18%      28%          32%       33%      45%        51%       53%
D=2h MEAN RCP 4.5        14%        14%       14%      19%          20%       21%      34%        39%       41%
D=2h MEAN RCP 8.5        14%        15%       15%      23%          25%       26%      42%        45%       46%
D=3h MEAN RCP 4.5        13%        13%       13%      16%          17%       17%      37%        42%       44%
D=3h MEAN RCP 8.5        11%        11%       11%      19%          21%       21%      40%        42%       43%

Fossing                2020-T10   2020-T50 2020-T100 2050-T10     2050-T50 2050-T100 2080-T10   2080-T50 2080-T100
D=1h MEAN RCP 4.5         3%         2%        2%      12%          12%       13%      18%         3%       18%
D=1h MEAN RCP 8.5        13%        12%       12%      14%          15%       15%      33%        13%       36%
D=2h MEAN RCP 4.5         1%        -1%       -1%      11%          11%       11%      15%        15%       15%
D=2h MEAN RCP 8.5        14%        13%       13%      11%          10%       10%      31%        33%       33%
D=3h MEAN RCP 4.5         1%         0%       -1%      10%          10%        9%      13%        12%       12%
D=3h MEAN RCP 8.5        15%        15%       15%      10%           8%        7%      28%        30%       30%

Wallern                2020-T10    2020-T50 2020-T100 2050-T10    2050-T50 2050-T100 2080-T10   2080-T50 2080-T100
D=1h MEAN RCP 4.5         8%          8%        8%      21%         24%       25%      25%        25%       25%
D=1h MEAN RCP 8.5        21%         22%       23%      26%         28%       29%      50%        56%       59%
D=2h MEAN RCP 4.5         5%          5%        4%      20%         22%       23%      23%        23%       23%
D=2h MEAN RCP 8.5        19%         20%       21%      21%         21%       21%      43%        48%       49%
D=3h MEAN RCP 4.5         2%          0%        0%      18%         19%       19%      20%        19%       18%
D=3h MEAN RCP 8.5        16%         15%       15%      16%         15%       14%      36%        39%       40%

Table 1: Mean relative precipitation changes in the study areas

Full Technical Report: Climate Change and Flash-Floods                                                       5
Copernicus Climate Change Service

Step 3: Simulation of flash flooding considering varying inputs
(durations and intensities)
Description:
In this step flash flood scenarios were simulated in the project regions Poneggen and Wallern. In
course of the scenario analysis the design rainfall NBEM was altered in accordance with Table 1.
Simulations were conducted for a return period of 10 and 100 years. Duration stages of 1 hour and 2
hours were simulated since the minimum duration stage obtained from the demosntrator is limited
to hourly values. In the inundation maps particularly affected critical locations were marked as
Controlpoints and were further used for the scenario comparison. The flood extend was analyzed for
a water level above 20cm in residential areas. Inundation maps based on present design values
(Figure 3, Figure 7, Figure 11, Figure 15) were compared with inundation maps based on the
expected maximum future design values (Figure 4, Figure 8, Figure 12, Figure 16).

3.1 Project region Poneggen
Poneggen is part of the municipality Schwertberg located in the lower Mühlviertel. Poneggen was
flooded in 2011 and 2016 after short intense rainfall events, the water levels of the 2016 event were
used for model calibration. During previous events, only short rainfall durations below one hour were
observed. For these events, the local sewer system can be neglected since it is commonly designed
for a return period of 1-5 years. In case of the most severe flash flood event in Schwertberg 2016,
even inlets with 1m diameter were blocked.
The results in Figure 5 show that water level above 20 cm increased around 53% from the current
design scenario to the maximum climate change induced NBEM 2080 RCP8.5 scenario for a return
period of 100 years. Also the precipitation intensity increased around 53% for the 2080 RCP 8.5
scenario. The maximum change in water level occurred in CP 4 as seen in Figure 6, wherein the water
level increased from 0.37 m to 0.73 m. As clearly apparent from Figure 7 and Figure 8 the flood
extent is significantly lower for the simulation runs with 10 years return period. In Figure 11 and
Figure 12, the 2-hour duration scenarios for a return period of 100 years are shown. The simulation
results illustrate a lower impact of the altered design rainfall on the flood extent and inundation
depth for longer duration stages in Poneggen. The inundation extent increased 30% with a maximum
increase of design rainfall by 46% for the 2080 RCP 8.5 scenario.

3.2 Project region Wallern
Wallern an der Trattnach is located in the district Grieskirchen in Upper Austria. The area was hit by
an extreme flash flood event in 2015 with a return period significantly above 100 years. The
simulation mesh covers the communities Wallern and Bad Schallerbach with a size of 15.8 km².
The comparison of flood maps based on present (Figure 15) and future design values (Figure 16)
show a massive impact on flood level and flood extent. For example in Controlpoint 1 the flood level
raises from 0 to 0.83 m in the maximum climate impact scenario as displayed in Figure 18.

Full Technical Report: Climate Change and Flash-Floods                                              6
Copernicus Climate Change Service

Results:
3.1 Project region Poneggen

Figure 3: Flood extent map Poneggen for simulation run NBEM T=100 years D=1h

Figure 4: Flood extent map Poneggen for simulation run 2080_RCP8.5_NBEM T=100years D=1h

Full Technical Report: Climate Change and Flash-Floods                                    7
Copernicus Climate Change Service

Figure 5: Flood extent for altered design rainfall scenarios T=100years and D=1h

Figure 6: Flood heights at Controlpoints for altered design rainfall scenarios T=100years and D=1h

Full Technical Report: Climate Change and Flash-Floods                                               8
Copernicus Climate Change Service

Figure 7: Flood extent map Poneggen for simulation run NBEM T=10 years D=1h

Figure 8: Flood extent map Poneggen for simulation run 2080_RCP8.5_NBEM T=10years D=1h

Full Technical Report: Climate Change and Flash-Floods                                   9
Copernicus Climate Change Service

Figure 9: Flood extent for altered design rainfall scenarios T=10years and D=1h

Figure 10: Flood heights at control points for altered design rainfall scenarios T=10years and D=1h

Full Technical Report: Climate Change and Flash-Floods                                                10
Copernicus Climate Change Service

Figure 11: Flood extent map Poneggen for simulation run NBEM T=100 years D=2h

Figure 12: Flood extent map Poneggen for simulation run 2080_RCP8.5_NBEM T=100years D=2h

Full Technical Report: Climate Change and Flash-Floods                                     11
Copernicus Climate Change Service

Figure 13: Flood extent for altered design rainfall scenarios T=100years and D=2h

Figure 14: Flood heights at Controlpoints for altered design rainfall scenarios T=100years and D=2h

Full Technical Report: Climate Change and Flash-Floods                                                12
Copernicus Climate Change Service

3.2 Project region Wallern

Figure 15: Flood extent map Wallern for simulation run NBEM T=100 years D=1h

Figure 16: Flood extent map Wallern for simulation run 2080_RCP8.5_NBEM T=100years D=1h

Full Technical Report: Climate Change and Flash-Floods                                    13
Copernicus Climate Change Service

Figure 17: Flood extent for altered design rainfall scenarios T=100years and D=1h

Figure 18: Flood heights at Control points for altered design rainfall scenarios T=100years and D=1h

Full Technical Report: Climate Change and Flash-Floods                                                 14
Copernicus Climate Change Service
Step 4: Assess preconditions given at past flash flood events. Prior
rainfall intensity and/or sums may be derived from pan European or
local rainfall datasets.
Description:
• Theory: If soil is more saturated, it is expected that a flash flood is triggered with a lower
precipitation sum than with dry soil.
• Methodology: Examine an assumed correlation between prior rainfall and flashflood-
triggering heavy rain events
For this step, none of the indicators available from the demonstrator could be used as we had to
compare rainfall sums of past flash flood events with their initial conditions. To filter out such events,
we need precipitation data from rain gauges in high temporal resolution (at least in 15 min intervals,
otherwise convective precipitation events cannot be identified as such) and a data source of
occurred damages (possible minor events with no damage are not subject of investigation). The
indicators wetness 1+2 or precipitation could not be used, as they only were representative for the
period 1970-2000 and included no information about the situation in 2016. On the other hand, we
unfortunately got no data from former flash flood events in that period from 1970-2000.
Flash Flood events have been derived from the following data sources:
• publicly available database of fire brigade operations in the State of Upper Austria (For this
study, data was available only for the months May – September 2016):
http://intranet.ooelfv.at/
• Regional Newspaper articles
• Precipitation sums (5 min intervals) of 63 rain gauges from Upper Austrian Hydrological
Service (data available until 31.12.2015)
• For year 2016: Precipitation sums (5 / 10 / 15 min intervals) of privately owned rain gauges
from Weather Underground Portal (no other data sources available):
https://www.wunderground.com/wundermap
To be able to deduce on the initial conditions, we used the following indicators:
• Accumulated precipitation sums before the respective flood event (12h / 24h / 48h / 72h /
7d / 14d before the flash flood event) from rain gauge data sources stated above
• ERS-1/2 AMI 50 km Soil Moisture Time Series: http://rs.geo.tuwien.ac.at/
• ERS-1/2 AMI 50 km Soil Water Index Time Series: http://rs.geo.tuwien.ac.at/
So far, C3S SIS for water provides daily rainfall sums in a spatial resolution of either a 0,5° grid or the
eHYPE Catchments for the years 1971 to 2000. However, all investigated events are between 2002
and 2016. Therefore, the rainfall time series data could not be used.
For a correct classification of the single flood events, we need a higher temporal resolution as well (at
least 15 minutes), as flash floods are a typical consequence of spatially and temporally restricted
heavy precipitation events. Absolute amount of precipitation can differ substantially even in a range
of 5 – 10 kilometers, so a 0.5° resolution can blur the actual precipitation peeks considerably. As a
consequence, we used data from the local Hydrological Service and – most important – private rain
gauge data from wunderground.com. Without the latter, the network of rain gauges is much too thin
to represent the flood events correctly.
In the following, a total of 67 rain events with known flooding issues (derived from fire brigade
operations database and / or local newspaper articles) and a maximum rain duration of 180 minutes
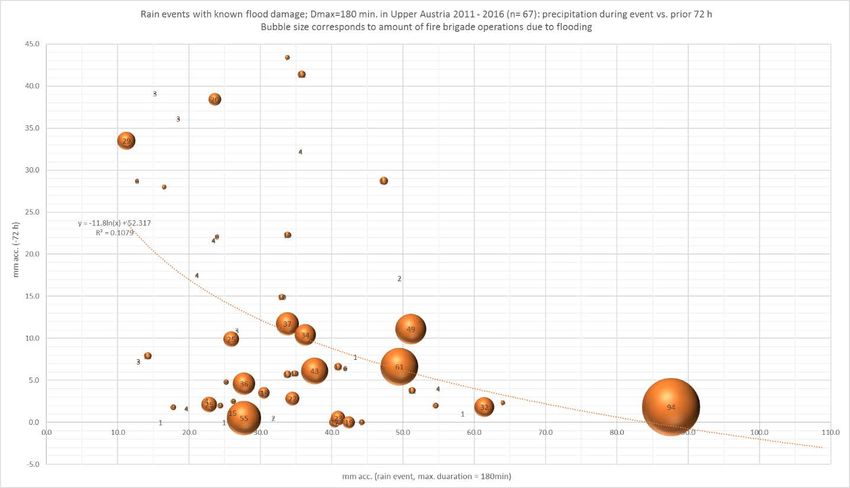
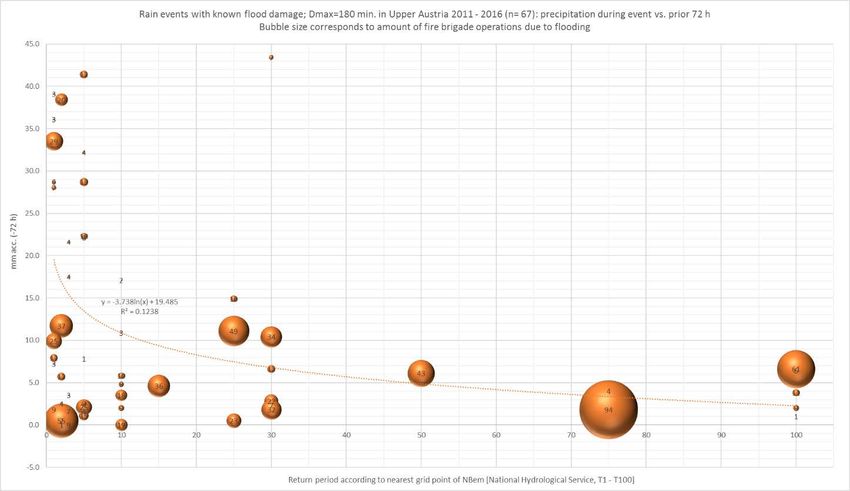
Full Technical Report: Climate Change and Flash-Floods 15Copernicus Climate Change Service (to filter out the long-lasting rain events which are not representative for flash floods) occurred during the last 5 years have been examined. For each single event, the cumulative amount of precipitation occurred during the rain event has been compared with the cumulative precipitation during the last 12 / 24 / 48 / 72 hours and the last 7 / 14 days. The a priori thesis to this examination was an indirectly proportional relation between the cumulative prior rainfall and the total precipitation of the flash flood triggering rain events, as a high antecedent moisture leads to a higher discharge coefficient than the same event would trigger with comparatively dry soil conditions. The results of the examined sample show indeed a weak, but existing relation between these two parameters; as the coefficient of determination for a logarithmic regression line between the cumulative precipitation during the rain event on the x-axis and the cumulative precipitation during the varying prior time intervals rises from 0,0229 for the 24h interval to 0,1079 for the 72h interval (see Figure 20– Figure 22) and then sharply decreases again to values of 0,014 (7 days) and 0,0015 for the 14 days’ interval (see Figure 23, Figure 24). For the 12h interval prior the rain event, the coefficient of determination shows indeed an even higher value (0,1328, see Figure 19, but here, nearly 50% of the sample had no precipitation at all in this interval, so the significance is rather low here. This leads to the conclusion that the antecedent moisture resulting from prior rainfall do have an impact on the discharge coefficient of the examined rain events, but only up to at least 72h. The cumulative rainfall during the last 7 and 14 days do not seem to have an influence on the runoff conditions of the flash-flood-triggering rain events. This can be explained by the fact that flash floods only occur during the summer months (April / May to September / October) at our latitude, where not only precipitation reaches its maximum amount, but also evaporation. Additionally to the different time intervals, two other parameters have been included in the examination: Return period of the flood-triggering event according to National Hydrological Service (eHYD) and the amount of fire brigade operations during the event. Although the latter one has no direct correlation with the heaviness of the single flood event (this is mainly an effect of population density), it still may give a hint on it – at least, nearly all events with a return period of T30 and higher show a number of 10 or more fire brigade operations (See Fig. 26). In Fig. 25, the amount of fire brigade operations has been displayed as size of the corresponding bubbles additionally to the same parameters used in Fig. 21, whereas in Fig. 26, the parameter of the total amount of precipitation during the rain events on the x-axis have been replaced by the corresponding return period. Therefore, an additional 3rd parameter has been considered: intensity of the flood-triggering events. The combination of return period of the flood-triggering rain events and the 72h prior rainfall combined with the amount of fire brigade operations as bubble size in Fig. 26 show a similar result to Fig. 25 (R² = 0,1238 instead of 0,1079): Like in the combination of absolute amount of rainfall versus prior rainfall, Fig. 26 generally shows higher amounts of prior rainfall where the return period of the flood-triggering event is lower and vice versa. This supports the hypothesis stated at the beginning, that more saturated soils trigger flash floods with lower precipitation sums than with dry soil. Full Technical Report: Climate Change and Flash-Floods 16
Copernicus Climate Change Service

Results:

Figure 19: Rain events with known flood damage; Dmax=180 min. in Upper Austria 2011 - 2016 (n= 67): precipitation
during event vs. prior 12 h

Figure 20: Rain events with known flood damage; Dmax=180 min. in Upper Austria 2011 - 2016 (n= 67): precipitation
during event vs. prior 24 h

Full Technical Report: Climate Change and Flash-Floods                                                              17
Copernicus Climate Change Service

Figure 21: Rain events with known flood damage; Dmax=180 min. in Upper Austria 2011 - 2016 (n= 67): precipitation
during event vs. prior 48 h

Figure 22: Rain events with known flood damage; Dmax=180 min. in Upper Austria 2011 - 2016 (n= 67): precipitation
during event vs. prior 72 h

Full Technical Report: Climate Change and Flash-Floods                                                              18
Copernicus Climate Change Service

Figure 23: Rain events with known flood damage; Dmax=180 min. in Upper Austria 2011 - 2016 (n= 67): precipitation
during event vs. prior 7 d

Figure 24: Rain events with known flood damage; Dmax=180 min. in Upper Austria 2011 - 2016 (n= 67): precipitation
during event vs. prior 14 d

Full Technical Report: Climate Change and Flash-Floods                                                              19
Copernicus Climate Change Service

Figure 25: Rain events with known flood damage; Dmax=180 min. in Upper Austria 2011 - 2016 (n= 67): precipitation
during event vs. prior 72 h (Bubble size corresponds to amount of fire brigade operations due to flooding, x-axis = mm
accumulated rainfall during event.)

Figure 26: Rain events with known flood damage; Dmax=180 min. in Upper Austria 2011 - 2016 (n= 67): precipitation
during event vs. prior 72 h (Bubble size corresponds to amount of fire brigade operations due to flooding, x-axis = return
period)

Full Technical Report: Climate Change and Flash-Floods                                                                   20
Copernicus Climate Change Service

Step 5: Simulation of flash flooding (hydrology and hydraulic) using
different preconditions.
Description:
According to the climate change scenarios included in C3S SIS for water, an increase in the maximum
intensity of short duration rains in the two periods of investigation 2050 and 2080 of 12 % and 24 %
respectively (arithmetic mean of all included regional climate models and emission scenarios) is to
expect in Upper Austria. On the other hand, there is no clear increase in the soil water content or the
wetness parameters.
For investigating the influence of different preconditions of soil water content on flood extent and
inundation depth of a specific rain event, different parameter sets (very dry soils with high
infiltration rates, normal soils with calibrated infiltration rates according to the corresponding kf -
values and highly saturated soils with reduced infiltration rates) have been calculated for the area of
Waldzell and Mettmach in the Innviertel region in Upper Austria (catchment areas 23,05 resp. 29,29
sq. km).
The comparison is based on a real flash flood event on 20th of June 2012, where we could receive
discharge gauge data from the gauges in Waldzell and Mettmach as well as rain gauge data from 3
different rainfall stations from the local water administration entity. So, although the catchment
areas are rather big as study object for a flash flood event (which catchment areas are typically
between 0,5 and 3 to 5 sq. km), it’s one of the very rare cases where we have discharge and rain
gauge values from the area – so we have to make a compromise and take what we can get.
The calculated discharge coefficient of the received rain- and discharge data in the time interval from
20th June 2012 6pm until 21st June 2012 6am (12h interval) is 29,41% for Waldzell and 40,05% for
Mettmach. The value for Mettmach is very high, so we consider that cumulative precipitation in the
Mettmach catchment is not precisely recorded. This assumption is backed by the fact that firstly the
accumulative precipitation differs a lot from gauge to gauge (typical for convective rain events), and
secondly, the Mettmach discharge gauge catchment is almost completely covered by the “Stelzen”
rain gauge (see Fig. 27), which rain sum may not be representative for the whole area and lies 20 mm
below the “Schratteneck” gauge, which covers most of the Waldzell discharge gauge catchment.
Therefore, we decided to exclude Mettmach from further analysis and base the comparison of
different runoff characteristics, flood extents and water depths on Waldzell only.

Full Technical Report: Climate Change and Flash-Floods                                              21
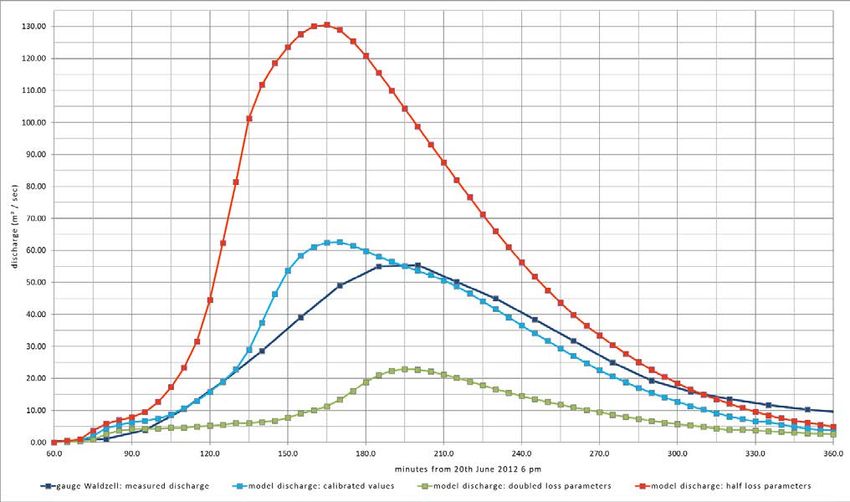
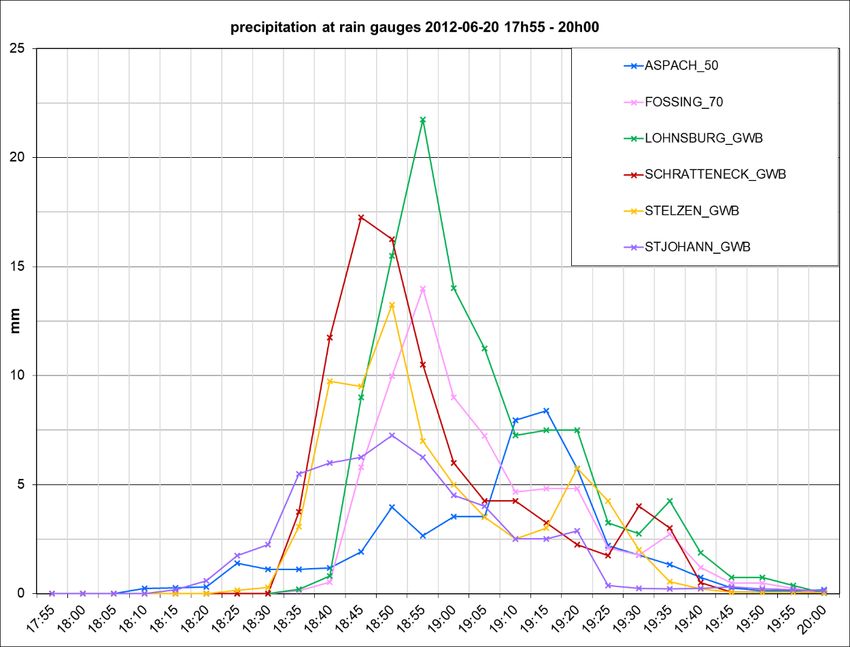
Copernicus Climate Change Service

Results:

Figure 27: precipitation in mm per 5 minutes in the affected area

This historic rain event served as calibration base for the other simulation runs with increased and
reduced initial / continuous losses. The accumulated precipitation in the catchment of the discharge
gauge (computed via the area weighted average of the two rain gauges “Schratteneck” and
“Stelzen”) is 84,84 mm, the resulting load is 1985262 m³. The maximum measured discharge in
Waldzell is 55,46 m³ per second and is reached 200 minutes after the beginning of the rainfall event
(see Figure 29).
The run representing the flash flood event as it happened resulted in a peak discharge of 62,6 m³/s
(reached 170 minutes after beginning of the rain event) and a discharge coefficient of 26,74% for
Waldzell (6pm June 20th until 3 am June 21st), which lies quite close to the target figure (measured
rainfall and discharge) of 27,48% for the same time period.
This run serves as the basis for two other simulation runs, in which we tried to represent different
preconditions of almost saturated soils (with loss parameter values cut by half) and very dry soils
(with doubled loss parameter values). Although being a very generalized and simplified approach, it
is the only possible way to reflect different types of initial soil conditions in our 2d model. In the run
with loss parameter values cut in half (which reflects very wet initial soil conditions), the peak
discharge more than doubles from 62,6 to 130,5 m³/s, while in the run with doubled loss parameter
values (reflecting dry soil conditions), it diminishes down to a peak of 22,9 m³/s.
So, although the relative change in loss parameter values is the same in each direction (+ / - 50%),
the resulting discharge of the same rain amount is more sensitive to these variations, which is also
reflected in the maps of flood extent and inundation depth in chapters (6) and (7).

Full Technical Report: Climate Change and Flash-Floods                                                 22
Copernicus Climate Change Service

Figure 28: measured (dark blue) and modelled discharge with different values for loss parameters in the Waldzell
catchment: calibrated model = light blue, half infiltration rate (red), double infiltration rate (green)

Compared to the results of chapter (4), where the preceding rainfall amounts of a certain damage-
causing rain event have been contrasted with the accumulated precipitation during the actual rain
event, these results are consistent with what we see now – it is clear that the level of antecedent soil
moisture has a significant impact on the resulting discharge, leaving other factors like destruction of
surface soil-structures out of consideration..
This is also shown by the charts of accumulated rainfall for the rain gauges shown in Figure 28:
Whereas the absolute sum of accumulated rainfall during the rain event on 20th June 2012 was 55
mm at the St. Johann gauge, 70mm at Stelzen and 89 mm at Schratteneck, all resulting in serious
flash flood damage, the rain amount at Lohnsburg – with 109 mm the highest of all – did not result in
more damage than at the other regions; at the contrary, recorded damages are especially high in the
mountain ridge areas (gauges Stelzen, St. Johann, Schratteneck), where the total sum during the rain
event is lower, but antecedent rain events resulted in an already high level of soil moisture.
As we have calculated the hazard zone map for the Ach river in this area in our office as well, we can
classify the various discharge amounts to the corresponding return period as well. First, we examine
the return periods of the recorded rainfall amounts (see Table 2): This show us, that the recorded
rainfall amounts differ strongly in their corresponding return period. The sum of the relevant stations
for the Waldzell catchment (Schratteneck and Stelzen) equals to a T100 and a T30 event, the amount
for Lohnsburg equals to an even higher return period >T100, whereas i.e. St. Johann only equals to a
T10 event.
When taking a look at the (peak) discharge values for different return periods of the same catchment
(see Figure 31), it is clear that the discharge resulting from the investigated rain event, which
corresponds to a T100 rain event in the closest rain gauge (Schratteneck) of the Waldzell discharge
gauge, corresponds to a T300 event in this respect – which may explain the high damage and fits in
the picture of the already high soil moisture level due to preceding rainfall (see Figure 30).

Full Technical Report: Climate Change and Flash-Floods                                                             23
Copernicus Climate Change Service

When investigating the altered initial moisture conditions of the same rain event, one sees that with
even lower values for the loss parameters of the rainfall-runoff model, the calculated discharge
quickly reaches values far beyond the T300 value. When doubling the loss values, the peak discharge
diminishes down to 22,9 m³/s, then corresponding not even to a T10 event (which is calculated with
29,2 m³/s).
Obviously, the initial soil conditions have a huge impact on the resulting discharge (and damage),
while keeping the triggering rainfall sum constant.

                                     20.Jun.12 Regensumme Jährlichkeit
                                                  [mm]
                                 Altheim           14,7       10
                                 Lohnsburg        109,9     >>100
                                 Stelzen           70,7       30
                                 Schratteneck      89,4      100

Table 2: return period (right column) according eHYD of the accumulated rainfall at each rain gauge (mid column)

Figure 29: accumulated rainfall for the same rain gauges like in Figure 27 for the rain event on 2012-06-20 and the time
before (=whole month)

Full Technical Report: Climate Change and Flash-Floods                                                                 24
Copernicus Climate Change Service Figure 30: Peak discharge values (m³/s) of different return periods of the same catchment (hazard zone plan Ach river) Full Technical Report: Climate Change and Flash-Floods 25
Copernicus Climate Change Service

Step 6: Derive flood extent maps (local data, e.g. DEM)
Description:
See Step 3 / 7

Results:
See Step 3 / 7

Full Technical Report: Climate Change and Flash-Floods    26
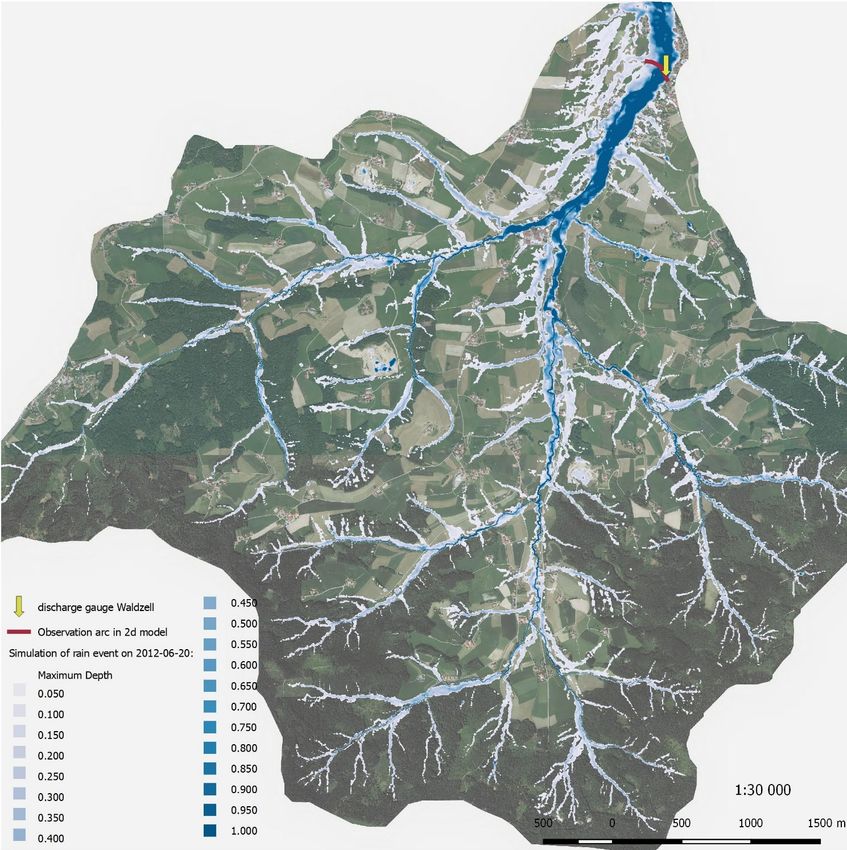
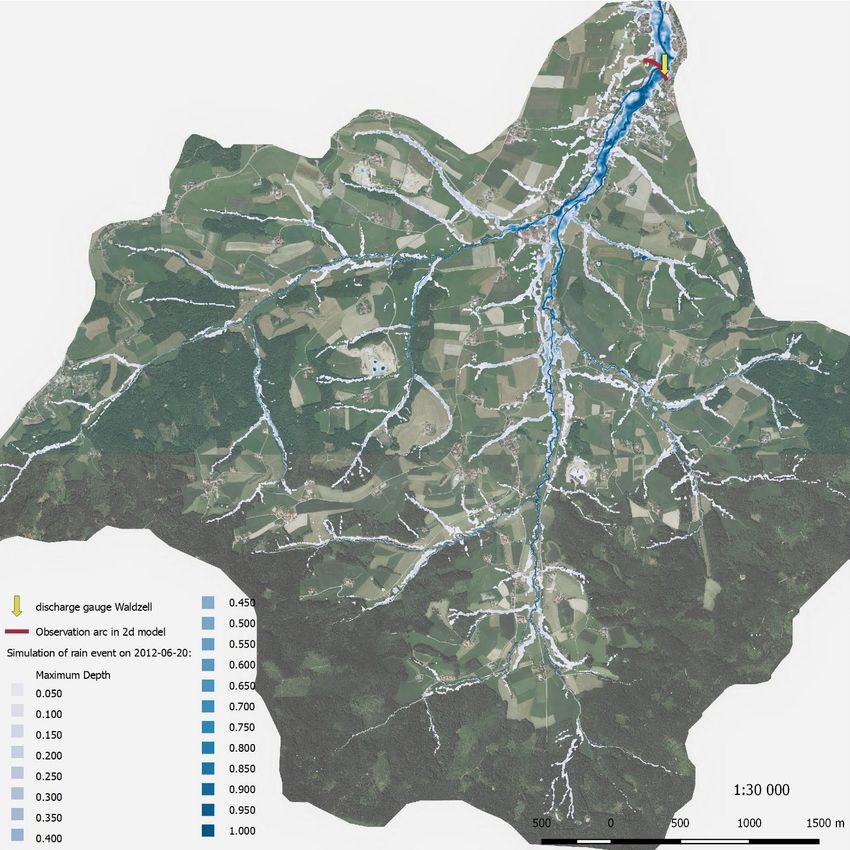
Copernicus Climate Change Service

Step 7: Derive flood inundation maps based on local data (e.g. DEM)
Description:

Results:
On basis of the three scenarios with different initial soil moisture conditions, one can easily see the
difference in extent and inundation depth (see Figure 32 until Figure 34). Compared to the basic
scenario, which refers to the actual rain event in this area in the year 2012 and which represents – as
we have seen before – already a “wet” scenario with highly saturated soils (inundated area =
293,8097 ha with max. depth = 5 cm and above), the flood extent as well as the inundation depth
rises substantially when cutting the loss parameter values by half (426,47 ha, +45%) and on the other
way round shrinks down to 140,52 ha (-52%) in the “dry” scenario (loss parameters doubled):

Full Technical Report: Climate Change and Flash-Floods                                              27
Copernicus Climate Change Service

Figure 31: Flood inundation map for Waldzell area of rain event 20 2012-06-20 (normal loss parameters = average soil
moisture)

Full Technical Report: Climate Change and Flash-Floods                                                           28
Copernicus Climate Change Service

Figure 32: Flood inundation map for Waldzell area of rain event 20 2012-06-20 (half loss parameters = high soil moisture)

Full Technical Report: Climate Change and Flash-Floods                                                                29
Copernicus Climate Change Service

Figure 33: Flood inundation map for Waldzell area of rain event 20 2012-06-20 (doubled loss parameters = low soil
moisture)

Full Technical Report: Climate Change and Flash-Floods                                                              30
Copernicus Climate Change Service

Step 8: Comparison of flood extent and inundation maps due to
original and altered design rainfall input. Present the results to the
client and describe the effects of preconditions and altered design
rains on flash floods. Derive flood inundation maps based on local data
(e.g. DEM)
Description:
See Step 3 / 7

Results:
See Step 3 / 7

Full Technical Report: Climate Change and Flash-Floods               31
Copernicus Climate Change Service

Step 9: Derivation of the sensitivity of flood extents / inundations onto
initial loss variations
Description:
See Step 3 / 7

Results:
See Step 3 / 7

Full Technical Report: Climate Change and Flash-Floods                 32
Copernicus Climate Change Service

Conclusion of Full Technical Report
The climate impact indicator for wetness (preconditions of a storm event) was found to be less
sensitive compared to the bandwidth of changes in rain intensities.
The use of design rainfalls and their altering for different future scenarios introduces a new and
important part in the design of mitigation structures and evaluation of future risk mapping. It is
expected, that allowing the consideration of increased design values in the design process, leads to
more sustainable mitigation structures. Still, from a funding perspective, users (engineering and
political level) are required to set this design strategy to be standard.
We found that there are many datasets regarding precipitation that deal with daily rain sums or
seasonal values. But there is little information about precipitation with shorter duration in the portal
by now. Background is that climate change data is currently limited to larger scale (time and space)
and is as well limited with regard to convective processes included in the climate models. Still, for the
purpose of modelling flash-floods and evaluating future changes, indicators for intense rains with
short duration would be valuable. In this project, we used relative changes indicated for short
durations and applied these to national data sets as a first approach. These data were helpful to
show a bandwidth of possible alterations du to climate change.
Also hosting real time data for precipitation with short time resolution will be a major value for the
upcoming database because it would be of use for many water managers (flashfloods, sewage
systems operation etc.).

Full Technical Report: Climate Change and Flash-Floods                                                33
Copernicus Climate Change Service

References

Correspondence with Client in Case Study:

Von: Felix.Weingraber@ooe.gv.at [mailto:Felix.Weingraber@ooe.gv.at]
Gesendet: Dienstag, 22. August 2017 08:59
An: Stefan.Achleitner@uibk.ac.at; humer@ib-humer.at
Cc: OGW-SW.Post@ooe.gv.at; Gerald.Lindner@ooe.gv.at
Betreff: SWICCA

Dear Mr. Achleitner, dear Mr. Humer!

The government of Upper Austria intends to provide guidance for a state-wide unified approach for
hazard mapping of pluvial flash floods. Basis of such maps are numerical simulations. The boundary
conditions for these simulations (design rain under climate change, initial soil moisture conditions)
shall be provided by the Water Authority of the Provincial Government of Upper Austria.

In the SWICCA project, climate data available online and EU wide was used and applied together with
national available data. Analyzing IDF curves from the SWICCA data-portal for today’s conditions
together with national design rainfall showed different in absolute intensity values. Thus, a pragmatic
way to still utilize climate change information was chosen. Applying relative changes in the SWICCA -
IDF curves due to climate-change were used and applied to the national data sets. Consequently,
future changes for boundary conditions and their impacts inundation and flood extends were test.
Climate impact has further been investigated together with a sensitivity analysis investigating the
impact of varying preconditions of soil-moisture on the inundation-areas.

The provincial government of Upper Austria expects a substantial benefit from the results in
SWICCA. Besides a sensitivity estimated for preconditions which is directly applicable, climate change
indications are as well valuable. Still, design rainfall including climate change is to be discussed with
regard to legal aspect. In any case, the project provide a valuable discussion basis for aiming to set
new, lasting design values. Thus, the questions raised at the project beginning could be answered
complete and serve us in our decision making processes.

Best regards
Felix Weingraber

Amt der OÖ Landesregierung
Abt. Oberflächengewässerwirtschaft
Gruppe Schutzwasserwirtschaft

Kärntnerstraße 10 – 12
4021 Linz

Full Technical Report: Climate Change and Flash-Floods                                                34
You can also read