Establishment of flood damage function model for urban area in Kuantan: A preliminary study - IOPscience
←
→
Page content transcription
If your browser does not render page correctly, please read the page content below

IOP Conference Series: Materials Science and Engineering

PAPER • OPEN ACCESS

Establishment of flood damage function model for urban area in
Kuantan: A preliminary study
To cite this article: N S Romali and Z Yusop 2021 IOP Conf. Ser.: Mater. Sci. Eng. 1144 012066

View the article online for updates and enhancements.

                               This content was downloaded from IP address 46.4.80.155 on 17/09/2021 at 18:52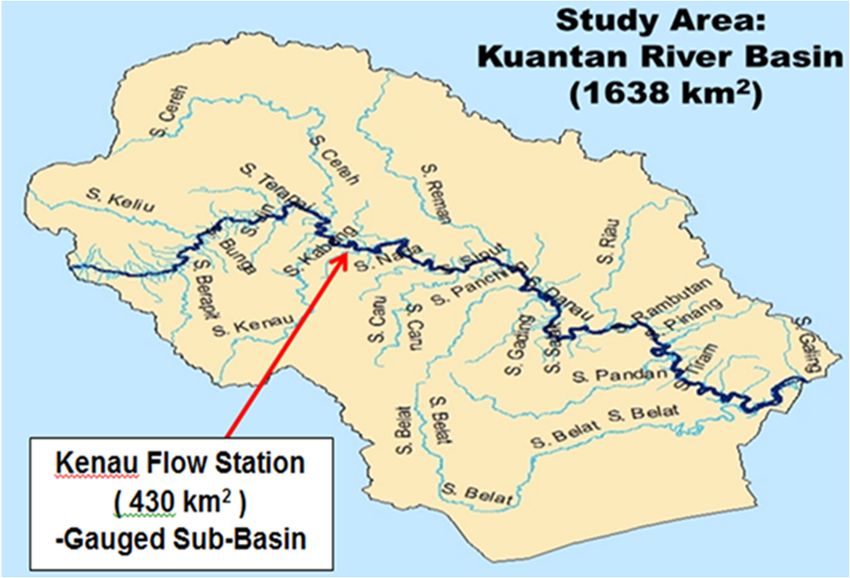
ISCEE 2020                                                                                                               IOP Publishing
IOP Conf. Series: Materials Science and Engineering              1144 (2021) 012066           doi:10.1088/1757-899X/1144/1/012066

Establishment of flood damage function model for urban area
in Kuantan: A preliminary study

                     N S Romali1* and Z Yusop2
                     1
                       Faculty of Civil Engineering Technology, Universiti Malaysia Pahang, 25200 Gambang,
                     Kuantan, Pahang.
                     2
                       Centre of Environmental Sustainability and Water Security, Universiti Teknologi Malaysia,
                     Skudai, 81310 Johor Bharu, Malaysia
                     *Corresponding author: suraya@ump.edu.my

                     Abstract. Previous studies on flood damage assessment mostly discussed the relationship
                     between flood damages and hydrological impacts parameters such as flood depth and flood
                     duration. The influence of resistance parameters on flood damages is rarely investigated. Hence,
                     an attempt has been made to establish a flood damage function model based on the relationships
                     between flood damages and the variables of socio-economic and property characteristics for an
                     urban area in Kuantan. Using a face to face interview technique, a field survey was conducted to
                     gather damage data and related information from the 2013 Kuantan flood. Damages to
                     residential structures were found to be influenced by household income, type of construction
                     materials, and house level. On the other hand, household income, house type, and occupation
                     were identified as the most significant variables that influenced the damages of residential
                     content. For the commercial category, only the areas of the premises were significantly affected
                     by the various structural damages, whereas the content damages depended mostly on the type of
                     business, the surrounding areas, and the premises’ number of floors. The relationship between
                     flood damages and their influencing factors is important and should be further tested before
                     proceeding with any application on a wider scale.

1. Introduction
Network and properties are tremendously affected by floods, which also can degrade environmental
quality, trigger infrastructural interruptions, and jeopardise living comfort. The magnitude of flood
effects relies on the type of activities in the population, the regularity of flooding occurrences, and the
degree of flooding and its potency [1]. If there is inadequate enactment to sustain flood management
strategies, the intensity of flood damages will become higher, which will affect human safety and socio-
economic routines. Currently, a risk-based options for mitigating flood is being emphasised more in
comparison to the prevailing methods of controlling flood. In recent years, the non-structural flood
mitigation measures, such as flood modelling, flood warning system, and flood risk assessment have
been given more attention in flood mitigation compared to structural works. A critical component in
managing flood risks is through assessing the numerous destructions resulting from flooding.
    In developing nations, the challenge of evaluating flood damages is resultant of insufficient data. In
Malaysia, the risk of flooding is normally presented in terms of its hazard, e.g. flood inundation and
flood extent map. The risk of flooding in terms of its consequences is rarely assessed. Studies on
flooding vulnerability are scarce where only few studies have investigated the approximation of
damages. Additionally, the impact of resistance parameters (i.e. the characteristics of the assets involved,
              Content from this work may be used under the terms of the Creative Commons Attribution 3.0 licence. Any further distribution
              of this work must maintain attribution to the author(s) and the title of the work, journal citation and DOI.
Published under licence by IOP Publishing Ltd                          1
ISCEE 2020 IOP Publishing
IOP Conf. Series: Materials Science and Engineering 1144 (2021) 012066 doi:10.1088/1757-899X/1144/1/012066
which include building category or type of materials) on flood damages is seldom examined. The
majority of flood damage evaluation reports deliberated on the correlation between flood damages and
parameters of hydrological effects, such as the depth and duration of floods. In reality, flood risk
evaluation ought to include all scopes of damages to acquire wide-ranging details of damages caused by
flood [2]. In addition, an exploration of flood damages associated with other flood influencing factors,
instead of the flood parameters, may prove to be better in understanding the impact on socio-economic
conditions of one particular region, as well as the property characteristics, which may affect the extent
of flood damages. The notion of social vulnerability in the context of managing disasters was presented
in the 1970s upon researchers’ acknowledgement that vulnerability also encompasses socio-economic
determinants, which influence the resilience of communities [3]. Social vulnerability refers to the socio-
economic and demographic determinants which influence a community’s resilience. Thus, for the
purpose of assisting flood vulnerability evaluation of an urban area in Malaysia, a study was undertaken
to investigate the impacts of resistance parameters to the extent of damages caused by flood. Also
ascertained, was a function model of flood damages, which indicates the correlation between flood
damages and the study area’s socio-economic/property characteristics.
2. Study area
The district of Kuantan in Pahang was selected as the study area. Located 250 km east from Kuala
Lumpur, the Kuantan district covers an area of 2453 km2. The Kuantan River Basin (KRB) is a
significant watershed of Kuantan city [4]. The area of KRB has been estimated around 1638 km2 with a
length of 93.44 km. The basin begins from Sungai Lembing, passing through Kuantan and terminates at
Perkampungan Tanjung Lumpur, before flowing out to the South China Sea. Figure 1 illustrates the
KRB map, showing the area, primary river, secondary tributaries, and the streamflow station. Several
major floods have occurred along the Kuantan river, caused by the high amount of precipitation collected
by the basin throughout the north-eastern monsoon seasons [4]. For the past several decades, the
Kuantan river have faced serious flooding in 2001/02, 2011/12, and the latest in 2013. Major damages
affected properties, infrastructure, and traffic; approximately 14,044 people were evacuated in the 2013
flood. Nevertheless, thus far, a flood vulnerability evaluation has not been considered for the river basin.
Therefore, Kuantan has been chosen as the study area, since the assessment of flood damages is
imperative in evaluating the effects of flood to properties and communities in Kuantan.
Figure 1. Map of Kuantan River Basin (adopted from [5])
2ISCEE 2020 IOP Publishing
IOP Conf. Series: Materials Science and Engineering 1144 (2021) 012066 doi:10.1088/1757-899X/1144/1/012066
3. Methods
3.1. Questionnaire survey
Questionnaire survey for flood damage data collection was developed based on previous literature,
manuals, and reports [6–8]. The questionnaire was used to gather data or information on the flood
features, damages incurred, and losses encountered by the victims of the chosen flood event.
Two separate sets of questionnaires were prepared for the residential and commercial categories.
Each set consists of two main sections: Section A and Section B, as shown in Table 1. The questionnaire
was designed based on three scopes: demographic data, information on residential properties, and
damage data. Section A pertains to demographic details, while Section B relates to information on
residential properties and damages experienced by residents in the 2013 flood. The demographic details
include multiple aspects, such as gender, age, race, education level, occupation, and household income.
Section B is divided into two subsections, i.e. Part 1 and Part 2. The property survey in Part 1 acquired
information on the price of the house, year of purchase, ownership status, house type, number of storeys,
house construction material, house insurance, and the estimated value of the house content (furniture,
appliances, gate, etc.). Part 2 gained information on damages, the depth and duration of flooding, the
cost of damages to fabric/structure, the cost of cleaning, content damage, vehicle damage, and the loss
in wages or income.
Table 1. Outline of questionnaire survey for residential and commercial categories
SECTION A: SECTION B
Category
General information PART 1: PART 2:
Property survey Property damage survey
Address, gender, age Price of properties, year Year of flooding, flood water level,
group, race, education of purchase, rental rate, duration of flooding, frequency of
Residential
level, occupation, and types, no. of storeys, flooding, problems faced due to
the household income building materials, flooding;
insurance status, and Information of property damage,
value of content, or value structural and content damage,
of stocks (for commercial vehicle damage, cleaning cost, and
Address, type of only) daily wages/trading/sales loss (for
Commercial
business commercial only)
3.2. Data collection
This study surveyed a total of 203 residential houses and 134 commercial premises to gain a clearer
picture of the 2013 flood event. Interviews were conducted using questionnaires developed for the
residential and commercial categories. The data collection was carried out around the residential and
commercial areas of KRB that were affected by the 2013 flood. Potential sampling areas were selected
based on the previous information of massive flood events provided by the Department of Drainage and
Irrigation (JPS) Pahang, newspapers, internet sources, and field visits. The data collection areas involved
Sg. Isap, Bukit Rangin, Permatang Badak, Bukit Setongkol, Sungai Soi, and Jalan Tanah Putih. These
places are located along the Kuantan river and have been frequently flooded in the past. During the
survey, a global positioning system (GPS) was used to determine the exact location of the surveyed
properties. Respondents from the respective categories were selected at random to create a database as
a future reference to the 2013 flood event, and characterised the social class, the types of house, the
household content (inventory items), and the damages to residences.
3ISCEE 2020 IOP Publishing
IOP Conf. Series: Materials Science and Engineering 1144 (2021) 012066 doi:10.1088/1757-899X/1144/1/012066
3.3. Flood damage model
This study used a multiple regression model to ascertain the correlation between floods and numerous
variables that influence damages caused by floods. This technique had been implemented by some
researchers to analyse flood damages and their factors. In this current study, every independent variable
value (flood influence factor, x) is linked to the dependent variable value (flood damages, FloodD). The
dependent variable signifies the extent of property damages, which include structural and content
damages. The independent variables are gender, age, race, education background, occupation, and
household income, while the property variables are ownership, price of property, property type, number
of storeys, building materials, and flood insurance status. Equation (1) shows the general regression
equation used in this study:
= + + + +⋯+ + (1)
where i = 1, 2, 3, ……. n, while p and ε signify the numbers of independent variables and the error term,
respectively. The analysis examined the coefficient of determination value (R2), and the p-value
(significance level), with a 5% level of significance (p < 0.05).
4. Results and discussions
4.1. Socio-economic and property characteristics
For the residential category, the respondents’ personal information such as gender, age, race, years of
education, and occupation is shown in Table 2. Female respondents make up 52% of the total sample.
Most respondents (55%) are in the age range of 41–64 years old, with a mean age of 44 years old. Most
of the respondents (99%) are Malay, while others are only 1%.
Table 2. Background of the respondents for the residential category
Percentage
Category Class/class interval Frequency (%)
Gender Male 98 48
Female 105 52
Age 18–19 1 1
20–40 79 39
41–64 111 55
65–100 12 5
Race Malay 202 99
Chinese - -
Indian - -
Others 1 1
Years of 7 7 3
Education 12 115 57
Over 12 76 37
Others 5 2
Occupation Government sector 60 30
Private sector 65 32
Business 23 11
Others 55 27
4ISCEE 2020 IOP Publishing
IOP Conf. Series: Materials Science and Engineering 1144 (2021) 012066 doi:10.1088/1757-899X/1144/1/012066
Years of education was used as proxy for respondents’ education level. The majority of the
respondents (57%) had completed 12 years education until the secondary level, while 2% did not provide
their education background, and was marked as ‘others’. Only 37% of the respondents graduated the
higher-level education, and work mostly with private sectors, as shown in Table 3. On the other hand,
Table 4 shows the distribution of household income for the residential respondents. The average
household income is RM2809. Amongst the 203 respondents, only 10% earn more than RM5000 per
month, while 3% earn less than RM1000 per month. Most (72%) respondents fall under the low-income
category (RM1000 – RM3000).
Table 3. Sample size by educational background and occupation
Occupation
Years of education Government Private sector
(years) sector Business Others
7 0 1 3 3
12 32 28 15 40
Over 19 28 35 4 9
Others 0 2 0 3
Table 4. Distribution of residential respondents by household income
Class interval (RM/month) Frequency Percentage (%) Cum Percentage (%)
5000 20 10 100
Table 5. Property characteristics of the residential category
Category Class/class interval Frequency Percentage (%)
Ownership Yes 175 86
status No 28 14
Price of LPH 173 85
property MPH 29 13
HPH 1 1
Type of Terrace 141 69
Property Semi-detached 12 6
Bungalow 18 9
Others 32 16
Number One-storey 196 97
of storeys Two-storeys 7 3
Building Concrete 126 62
materials Concrete and timber 59 29
Timber 18 9
Flood Yes 76 37
insurance No 127 63
5ISCEE 2020 IOP Publishing
IOP Conf. Series: Materials Science and Engineering 1144 (2021) 012066 doi:10.1088/1757-899X/1144/1/012066
Table 5 shows the characteristics of the residential property, i.e. ownership status, price and type of
property, number of storeys, building materials, and flood insurance status. Most of the respondents
(86%) own their house, while the rest are tenants. The properties are divided into three classes according
to their price: low-priced house (LPH), medium-priced house (MPH), and high-priced house (HPH).
This study surveyed a total of 173 LPH (priced less than RM80,000), 29 MPH (priced between
RM80,000 and RM300,000), and 1 HPH (priced more than RM300,000). The majority of the houses
are in the low class, with property values less than RM80,000. Most of the surveyed houses are terrace
(69%), one-storey type (97%), with concrete as the building material (62%); whereas, 37% of the
respondents have property insurance, suggesting that awareness toward the necessity for flood insurance
still remains low.
The property characteristics of the commercial category are shown in Table 6. The impact of flood
damages can only be observed through the variables of property characteristics, as most respondents are
not the owner of the premises; hence, such information may be insignificant. The interview was
conducted on 54 premises of goods and services, and 80 premises of food and beverages. Only 28% of
the premises are owned by the respondents, while the remaining 72% are rented. The premises’ values
range from RM100,000 to RM300,000, with only 33% being over RM300,000. Most of the premises
are one-storey type (72%), with built-up area of more than 100 m2. Again, awareness toward the
necessity for flood insurance still remains low, since only 3% of the business premises have been
insured.
Table 6. Property characteristics of the commercial category
Category Class/class interval Frequency Percentage (%)
Type of business Good & services 54 40
Food & beverages 80 60
Ownership status Yes 38 28
No 96 72
Price of property 100,000 – 200,000 84 63
(RM) 200,001 – 300,000 6 4
> 300,000 44 33
Area (m2) < 100 49 37
>100 85 63
Number of storeys One-storey 96 72
Two-storeys 38 28
Flood insurance Yes 4 3
No 130 97
4.2. Flood damage function model
4.2.1 Residential. The rate of flood damages was influenced by several variables. If the variables were
tested and found to be significant, they could be used to compute more reliable relationships of flood
damage function. This study’s findings indicated that residential structural damages were influenced by
the household income, type of construction materials, and house level (Table 7). Equation (2) provides
the correlation between residential structural damages and the variables of socio-economic and property.
= −107.38 + 828.43 + 1167.03 + 1186.88 − 603.07 1−
1050.14 2 − 7154.61 1 − 8897.64 2+ (2)
where ε is the error term and FloodRS is the residential structural damages caused by flood (RM); the
affecting determinants are shown in Table 7.
6ISCEE 2020 IOP Publishing
IOP Conf. Series: Materials Science and Engineering 1144 (2021) 012066 doi:10.1088/1757-899X/1144/1/012066
The R2 obtained for this relationship is 0.12. When raw data is used, a low R2 is normal, yet the value
attained in this study is lower in comparison to the result obtained by Poussin et al. [9], in a study
amongst French households on the behaviour of mitigating damages caused by flood (R2 from 0.19 to
0.31). The demographic and socio-economic characteristics of the community did not significantly
influence the damages on residential structures. Among the variables, only household income showed a
significant influence. The damages on residential structures correlated positively with the household
income and building materials. This is consistent with the findings by Win et al. [10], stating that the
rate of flood damages is usually linked to the variables of number in a household, household income,
and building materials. Additionally, Safiah Yusmah et al. [4] discovered that gender showed no
significance in influencing the proneness to flood, because this extent was determined by income.
Assuming that the remaining variables did not change, an increase in an income unit would also increase
in the value of structural damages. This result describes high-income respondents’ affordability in
purchasing more costly houses, wall furnishing, gates, etc., hence, the higher value of damages.
Meanwhile, the structural damage was negatively related to the house level.
Table 7. Results of socio-economic and property characteristics impact on residential structural
damages (RM)
Variable Coefficient Std. Error t-Stat
EDU_secondary 828.43 497.98 1.66
lnINCa 1167.03 415.52 2.81
MAT_concretea 1186.88 492.21 2.41
OCCU_government -603.07 618.50 -0.98
OCCU_private -1050.14 584.77 -1.80
LEVEL_1a -7154.61 3354.83 -2.13
a
LEVEL_2 -8897.64 3608.25 -2.47
Constant -107.38 4611.59 -0.02
a
is significant at 5%. EDU_secondary is the dummy education level for the secondary level, lnINC is ln house
income; MAT_concrete is the dummy construction material for concrete, OCCU_government is the dummy
occupation for the government sector; OCCU_private is the dummy occupation for the private sector; LEVEL_1
is the dummy house level for a one-storey house; and LEVEL_2 is the dummy house level for a two-storey house.
Table 8. Results of the socio-economic and property characteristics impact on residential content
damages (RM)
Variable Coefficient Std. Error t-Stat
OCCU_government -1679.25 1081.79 -1.55
lnINCb 2132.66 738.26 2.89
TYPE_terraceb -3304.65 946.89 -3.49
OCCU_privateb -2771.02 996.54 -2.78
LEVEL_1 -1872.70 2266.49 -0.83
MAT_concrete 197.17 895.24 0.22
Constant -4755.54 6194.38 -0.77
b
is significant at 5%. OCCU_government is the dummy occupation for the government sector; lnINC is ln house
income; TYPE_terrace is the dummy house type for a terrace house: OCCU_private is the dummy occupation for
the private sector; LEVEL_1 is the dummy house level for a one-storey house; and MAT_concrete is the dummy
construction material for concrete.
7ISCEE 2020 IOP Publishing
IOP Conf. Series: Materials Science and Engineering 1144 (2021) 012066 doi:10.1088/1757-899X/1144/1/012066
The damage function model for the residential content is shown in equation (3). As presented in Table
8, the residential content damage is influenced by the household income, type of house, and occupation.
= −4755.54 − 1679.25 1 + 2132.66 − 3304.65 − 2771.02 2−
1872.70 1 + 197.17 2+ (3)
where ε is the error term and FloodRC is the residential content damages caused by flood (RM); the
affecting determinants are shown in Table 8.
Similarly, the R2 obtained for this relationship is low (0.15). The content damage increased for every
unit increase in the household income when other variables did not change. In contrast, the content
damages decreased for terrace houses among respondents working in the private sector. This can be
justified by the cheaper content of terrace houses (furniture, appliances, etc.) compared to the content of
semi-detached houses or bungalows; thus, the lower value of damages. Based on Table 3, most
respondents with higher education work in the private sector. Those with higher education are more
knowledgeable, and are more inclined to be mindful and ready for a natural disaster. Correspondingly,
those with better occupation are more inclined to be aware and well-prepared with early mitigation
decisions. The finding is similar to the result by Romali et al. [5], which discovered that the residential
content damages were influenced by the respondents’ occupation.
4.2.2. Commercial. Table 9 and Table 10 show that only the areas of the premises had significant effects
from the various structural damages, whereas the damages to content depended mostly on the type of
business, the surrounding area, and level of the premises. For primary data, performance of the model
is deemed good with an R2 value of 0.19 for the commercial structure, and a value of 0.24 for its content.
The result is consistent with the study by Poussin et al. [9], as mentioned earlier.
Table 9. Results of the socio-economic and property characteristics impact on commercial structural
damages (RM)
Variable Coefficient Std. Error t-Stat
RACE_malay 111.20 576.80 0.19
EDU_primary -165.58 680.28 -0.24
Ln_areac 1883.05 525.18 3.59
TYPE_F&B 776.01 657.91 1.18
LEVEL_1 -802.27 599.11 -1.34
Constant -4278.66 2602.08 -1.64
c
is significant at 5%. RACE_Malay is the dummy race for Malay; lnINC is ln house income; EDU_primary is the
dummy education level for the primary level: Ln_area is ln area of the premises; TYPE_F&B is the dummy type
of business for food and beverages; and LEVEL_1 is the dummy level for a one-storey premises.
By assuming that other variables did not change, a unit increase in the ln area of the premises would
result in an increase in the structural and content damages of commercial properties. Meanwhile, a
significant relationship was observed between the content damage and the commercial property’s type
of business. This finding can be justified by the fact that the average content damage of food and
beverages business was higher compared to that of goods and services business. The supplies and
equipment in food and beverages premises would have been more exposed to flooding and difficult to
be relocated during flood events compared to those in goods and services premises. In addition, the
content damage was negatively related with the premises’ number of floors.
8ISCEE 2020 IOP Publishing
IOP Conf. Series: Materials Science and Engineering 1144 (2021) 012066 doi:10.1088/1757-899X/1144/1/012066
Table 10. Results of the socio-economic and property characteristics impact on commercial content
damages (RM)
Variable Coefficient Std. Error t-Stat
Type_G&Sd -14451.26 6093.45 -2.37
Ln_price 1463.26 2953.36 0.50
Ln_aread 9418.32 4654.76 2.02
LEVEL_1d -11589.52 5772.73 -2.01
Constant -21054.61 45415.78 -0.46
d
is significant at 5%. TYPE_G&S is the dummy type of business for goods and services premises; Ln_price is ln
price of the premises; Ln_area is ln area of premises; and LEVEL_1 is the dummy level for a one-storey premises.
The structural and content damages model for commercial properties are shown in equation (4) and
equation (5), respectively:
= −4278.66 + 111.2 − 165.58 + 1883.05 + 776.01 −
802.27 + (4)
where ε is the error term and FloodCS is the commercial structural damages caused by flood (RM); the
affecting determinants are shown in Table 8.
= −21054.61 − 14451.26 + 1463.26 + 9418.32 −
11589.52 + (5)
where ε is the error term and FloodCC is the commercial content damages caused by flood (RM; the
affecting determinants are shown in Table 8.
5. Conclusions
The main findings from this study are as follows:
i) The residential property’s structural damages caused by flood were influenced by the household
income, the type of construction materials, and the house level. On the contrary, the household
income, the type of house, and occupation are the most substantial variables that determined the
residential property’s content damages.
ii) For the commercial category, only the built-up area had a significant effect on the various
structural damages caused by flood, whereas the content damages significantly correlated with
the type of business, the built-up area, and the premises’ number of floors.
In conclusion, the less significant effects of the socio-economic factors to the flood damages are
attributed to the experience of the local residents in dealing with recurring flood events. Only household
income and occupation have significant effects on residential property damages. On the other hand, the
type of business plays an important role to the various commercial property damages. The correlation
between flooding and its destructive determinants can be utilised to assess damages caused by flood;
whereas flood risks can be minimised by implementing more efficient countermeasures.
6. References
[1] Suriya S, Mudgal B V and Nelliyat P 2012 Flood damage assessment of an urban area in Chennai,
India, part I: methodology, Natural Hazards 62(2), pages 149-167
[2] Okazawa Y, Yeh P J, Kanae S and Oki T 2011 Development of a global flood risk index based
on natural and socio-economic factors, Hydrological Sciences Journal 56(5) 789-804
9ISCEE 2020 IOP Publishing
IOP Conf. Series: Materials Science and Engineering 1144 (2021) 012066 doi:10.1088/1757-899X/1144/1/012066
[3] Flanagan B E, Gregory E W, Hallisey E J, Heitgerd J L and Lewis B 2011 A Social Vulnerability
Index for Disaster Management, Journal of Homeland Security and Emergency Management
8(1) Article 3
[4] Safiah Yusmah M Y, Bracken L J, Sahdan Z, Norhaslina H, Melasutra M D, Ghaffarianhoseini
A, Sumiliana S and Shereen Farisha A S 2020 Understanding urban flood vulnerability and
resilience: a case study of Kuantan, Pahang, Malaysia, Natural Hazards 101 (2020) 551-571
[5] Romali N S, Yusop Z, Mohd Zaki N I H, Sulaiman M, Abdul Ghani N A A and Sulaiman S 2019
Flood Damage Function Model for Residential area in Kuantan: A Preliminary Study,
International Journal of Integrated Engineering 11(1) 203-213
[6] Mcbean B E A, Gorrie J, Fortin M, Ding, J and Mouiton, R 1989 Flood Depth-Damage Curves
by Interview Survey, Journal of Water Resources Planning and Management 114(6) 613–634
[7] Penning-Rowsell E and Chatterton J 1979 The Benefits of Flood Alleviation: A Manual of
Assessment Techniques (United Kingdom: Gower Technical Press)
[8] KTA Tenaga Sdn. Bhd. 2003 Flood Damage Assessment of 26 April 2001 Flooding Affecting the
Klang Valley and the Preparation of Generalised Procedures and Guidelines for Assessment
of Flood Damages (Final Report). Drainage and Irrigation Department, Malaysia.
[9] Poussin J K, Botzen W J W and Aerts J C J H 2014 Factors of influence on flood damage mitigation
behaviour by households - Literature review and results from a French survey, Environmental
Science and Policy 40 69–77
[10] Win S, Zin W W, Kawasaki A and San Z M L T 2018 Establishment of flood damage function
models: A case study in the Bago River Basin, Myanmar, International Journal of Disaster
Risk Reduction 28 688-700
Acknowledgments
The authors appreciate the financial supports by the Ministry of Education of Malaysia (MOE) and
Universiti Malaysia Pahang (UMP) for the Fundamental Research Grant Scheme (FRGS):
FRGS/1/2019/TK01/UMP/02/2 (RDU1901155). In addition, the technical support and encouragement
from Universiti Teknologi Malaysia are appreciated.
10You can also read