Ascott Residence Trust - A Leading Global Serviced Residence REIT Macquarie ASEAN Conference 2016 - Ascott ...
←
→
Page content transcription
If your browser does not render page correctly, please read the page content below

Ascott Residence Trust
    A Leading Global Serviced Residence REIT

      Macquarie ASEAN Conference 2016

1                  24 August 2016
Important Notice
    The value of units in Ascott Residence Trust (“Ascott REIT”) (the “Units”) and the income derived from them
    may fall as well as rise. The Units are not obligations of, deposits in, or guaranteed by Ascott Residence Trust
    Management Limited, the Manager of Ascott REIT (the “Manager”) or any of its affiliates. An investment in the
    Units is subject to investment risks, including the possible loss of the principal amount invested. The past
    performance of Ascott REIT is not necessarily indicative of its future performance.

    This presentation may contain forward-looking statements that involve risks and uncertainties. Actual future
    performance, outcomes and results may differ materially from those expressed in forward-looking statements
    as a result of a number of risks, uncertainties and assumptions. Representative examples of these factors
    include (without limitation) general industry and economic conditions, interest rate trends, cost of capital and
    capital availability, competition from similar developments, shifts in expected levels of property rental
    income, changes in operating expenses, including employee wages, benefits and training, property
    expenses and governmental and public policy changes and the continued availability of financing in the
    amounts and the terms necessary to support future business. Prospective investors and Unitholders are
    cautioned not to place undue reliance on these forward-looking statements, which are based on the current
    view of the Manager on future events.

    Unitholders of Ascott REIT (the “Unitholders”) have no right to request the Manager to redeem their units in
    Ascott REIT while the units in Ascott REIT are listed. It is intended that Unitholders may only deal in their Units
    through trading on Singapore Exchange Securities Trading Limited (the “SGX-ST”). Listing of the Units on the
    SGX-ST does not guarantee a liquid market for the Units.

2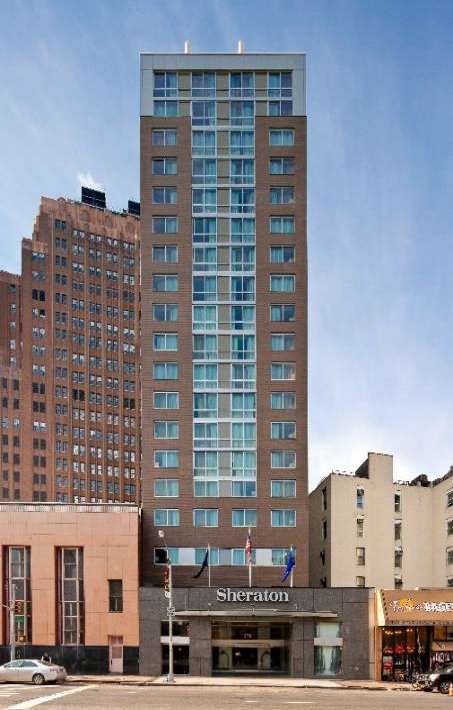
Content
Overview of Ascott REIT
Portfolio Highlights
Strategies
Conclusion
Appendix
3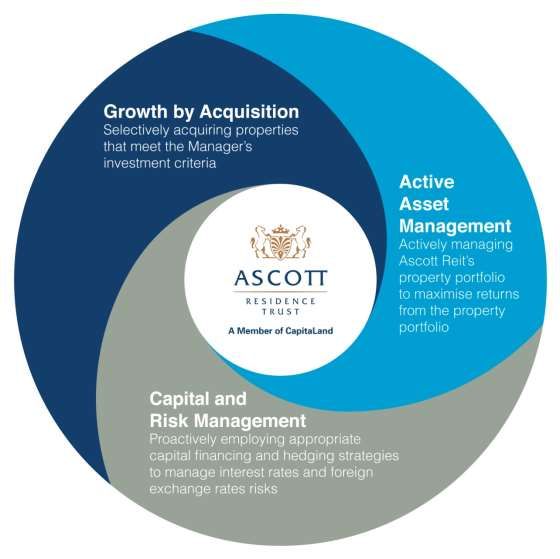
Overview of
                                      Ascott REIT

                                            Ascott Raffles Place Singapore
4   Ascott Limited Presentation July 2013
Overview of Ascott REIT
     A Leading Global Serviced Residence REIT

     S$1.9b1                      S$4.9b2                         11,649                         90                       38
     Market Capitalisation        Total Assets                    Apartment Units                Properties               Cities in 14 Countries

                                                                       United Kingdom
                                                                               4 Properties

                                                                                                 Belgium
                                                                                              2 Properties
                                                  Germany
    The United States of America                   3 Properties                                                                            China
                                                                                     France                                            10 Properties
    2 Properties                                                                 17 Properties
                                                                          Spain                                                            Japan
                                                                       1 Property                Vietnam                               33 Properties
                                                                                                 5 Properties
                                                                                    Malaysia                                      The Philippines
                                                                                    1 Property                                          2 Properties
                                                                                         Singapore
                                                                                          3 Properties
                                                                                                                                       Indonesia
                                                                                                                                        2 Properties

                                                                                                                                        Australia
                                                                                                                                        5 Properties

     Notes:
     Figures above as at 30 June 2016
     1.   Market capitalisation as at 11 August 2016
     2.   Excludes Ascott Orchard Singapore, which acquisition is targeted to be completed in 2017. If Ascott Orchard Singapore were
5         included, the portfolio of Ascott REIT would be approximately S$5.3 billion.
Overview of Ascott REIT
    Largest hospitality REIT listed on the SGX-ST by total asset value
    Total Assets1 (S$ b)

                4.9

                                       2.5                 2.5
                                                                                2.1                2.1
                                                                                                                     1.6

           Ascott REIT          CDL Hospitality    Far East Hospitality   OUE Hospitality   Frasers Hospitality   Ascendas
                                                                                                                  Hospitality

    Note:
    1. Based on latest available company filings

6
Overview of Ascott REIT
    Strong Sponsor, The Ascott Limited (a wholly-owned subsidiary of CapitaLand)

                         World’s largest international serviced residence owner-
                         operator with over 43,000 units in more than 270 properties

                              Over 30 year track record having pioneered Pan-
                              Asia’s first international-class serviced residence
                              property in 1984

                              Award-winning brands with
                              worldwide recognition

                         Sponsor – c.44% CapitaLand ownership in Ascott REIT

7
Portfolio Highlights

                                            Ascott Raffles Place Singapore
8   Ascott Limited Presentation July 2013
Geographical Diversification
    Key Markets1 contributed 87.8% of the Group’s Gross Profit in 2Q 2016
    Breakdown of Total Assets by Geography
    As at 30 June 2016

    Key Markets                    87.9%

         Japan                     16.5%                                                               Rest of the World   12.1%

         China                     16.0%                                                                  Philippines      3.5%
         Singapore                 12.3%                                                                  Indonesia        2.5%
                                                                     Ascott REIT’s
         France                    10.8%                             Total Assets                         Germany          2.4%
         UK                        10.4%                                 S$4.9b                           Spain            1.4%
         USA                       10.0%                                                                  Belgium          1.2%
         Vietnam                    6.2%                                                                  Malaysia         1.1%
         Australia                  5.7%

                                       Portfolio diversified across property and economic cycles

    Note:
    1. Key markets relate to countries that contribute to more than 5% of Ascott REIT’s total assets

9
Portfolio Highlights
                 Revenue and Gross Profit (by category)
               Revenue                                    Gross Profit
               2Q 2016                                     2Q 2016

                    14%
                                                                          25%

                Group     15%                                Group
               Revenue                                     Gross Profit
               S$119.4m                                     S$57.9m
                                                   61%                     14%
         71%
                                                                                 39%
                                                                                 Stable
                                                                                 Income

                            Master Leases
                            Management Contracts with Minimum
                            Guaranteed Income
                            Management Contracts

10
Income Stability
39% of the Group’s gross profit for 2Q 2016 is contributed by
master leases and management contracts with minimum guaranteed income
United Kingdom
4 Properties2
Germany
3 Properties1
16 Cities
Belgium in 8 countries
2 Properties2
France
32 Properties
17 Properties1
Spain Japan
1 Property2
1 Property1
out of 90 properties
Singapore
1 Property1 3.9 Years
weighted average remaining tenure
Australia
3 Properties1
Notes:
1. Properties under master leases
2. Properties under management contracts with minimum guaranteed income
11Income Stability
Focus on Long Stay Segments
Breakdown of Apartment Rental Income1 by Length of Stay
21%
5% 50%
13%
11%
1 week or less
Less than 1 month
1 to 6 months
6 to 12 months
More than 12 months
Average length of stay is about 4 months
Note:
1. Apartment rental income for YTD June 2016. Information for properties on master leases are not included.
12Strategies
Ascott Raffles Place Singapore
13 Ascott Limited Presentation July 2013Ascott REIT’s Strategies
− Maintain strong balance sheet and target
gearing range
− Adopt a proactive interest rate management
strategy
− Manage exposure to foreign exchange
fluctuations
− Access to diversified funding sources
14Growth By Acquisition
Ascott REIT has more than quadrupled its total assets since its listing in 2006…
Ascott REIT Total Assets (S$ b)
4.7
4.1
3.6
2.8 3.0 3.0
1.7 1.7 1.7
1.1
FY 2006 FY 2007 FY 2008 FY 2009 FY 2010 FY 2011 FY 2012 FY 2013 FY 2014 FY 2015
... and achieved strong growth in Unitholders’ distribution
Ascott REIT Unitholders’ distribution (S$ m)
1 125.6 123.3
114.8
96.2 99.7
53.7 57.7
45.1 45.2
24.6
FY 2006 FY 2007 FY 2008 FY 2009 FY 2010 FY 2011 FY 2012 FY 2013 FY 2014 FY 2015
15Growth By Acquisition
Ascott REIT remains on track to achieve target portfolio size of S$6.0b by 2017
2006 (S$217.5m) 2008 (S$65.5m) 2011 (S$98.1m) 2013 (S$287.4m) 2015 (S$609.1m)
• Somerset Olympic Tower • Citadines St Georges • 60% stake in Citadines • Somerset Heping Shenyang • Citadines on Bourke
Tianjin S$76.8m Terrace Perth2 S$36.1m Shinjuku Tokyo S$86.2m Melbourne S$167.6m
• 40% stake in Roppongi • 70% stake in Somerset West S$98.1m • Citadines Biyun Shanghai • 40% stake in Citadines
Residences1 S$20.7m Lake Hanoi S$29.4m S$63.2m Shinjuku Tokyo S$84.3m
• Ascott Makati S$87.5m • Citadines Xinghai Suzhou • 40% stake in Citadines
• Somerset Gordon Heights S$23.2m Karasuma-Gojo Kyoto
Melbourne S$13.9m • 11 rental housing properties S$39.9m
• 26.8% stake in Somerset in Japan S$114.8m • 4 rental housing properties in
Chancellor Court Ho Chi Osaka S$81.0m
Minh City S$18.6m • Element New York Times
Square West S$236.3m
2007 (S$304.1m) 2010 (S$1.2b) 2012 (S$414.7m) 2014 (S$559.1m) YTD 2016 (S$218.0m)
• Somerset Azabu East Tokyo • 2 Asian properties in • 60% stake in Citadines • Somerset Grand Central • Sheraton Tribeca New York
S$79.8m Karasuma-Gojo Kyoto Dalian S$118.6m Hotel
Singapore and Vietnam, and
S$48.2m • Infini Garden S$78.4m S$218.0m
• 60% stake in Roppongi 26 European properties in
Residences1 S$36.4m France, UK, Germany, • Ascott Raffles Place • Somerset Ampang Kuala
• 40.2% stake in Somerset Singapore S$220.0m Lumpur S$67.4m
Belgium and Spain S$1.2b
Chancellor Court Ho Chi • Ascott Guangzhou S$85.7m • Citadines Zhuankou Wuhan
Minh City S$27.9m • Madison Hamburg S$60.8m S$51.4m
• 18 rental housing properties • Citadines Gaoxin Xi’an
in Tokyo S$160.0m S$55.1m
• Citadines Central Shinjuku
Tokyo3
S$95.2m
• Quest Sydney Olympic Park,
Quest Mascot, and Quest
Campbelltown
Notes: Figures above are based on agreed property value S$93.0m
1. Formerly known as Somerset Roppongi Tokyo
2. Formerly known as Somerset St Georges Terrace Perth
16 3. Formerly known as Best Western Shinjuku Astina HotelGrowth By Acquisition
Ascott REIT acquires a second property in New York, USA
Property Sheraton Tribeca New York Hotel
350 and 370-372 Canal Street,
Location
New York, NY 10013
No. of Units 369 units
Title 99-yr leasehold (expiring Oct 2112)
Franchised under the ‘Sheraton’
Brand
brand by Starwood
FC-Canal Management LLC, an
Property Manager
unrelated third party
Year of Opening October 2010
US$158.0m (S$218.0m1)
Acquisition Price
US$428,000/key (S$591,0001/key)
US$166.0m (S$229.1m1)
Valuation2
US$450,000/key (S$621,0001/key)
FY 2015 Pro Forma EBITDA Yield3 6.8%
Sheraton Tribeca FY 2015 Pro Forma DPU Impact4 1.5% accretion
Notes:
1. Based on exchange rate of US$1.00 to S$$1.38
2. Valuation, appointed by DBS Trustee Limited, in its capacity as trustee of Ascott REIT, derived by Jones Lang LaSalle Americas, Inc
with effective date as of 22 February 2016
3. Based on the acquisition price of US$158.0m
4. Assuming acquisition is funded by a combination of debt financing and part of the proceeds from the private placement as
17 announced on 15 March 2016Active Asset Management
Approximately 85% of Ascott Reit’s serviced residence properties have
undergone, or are undergoing, AEI
— AEI at Somerset Grand Central Dalian, Somerset Ho Chi Minh City, Somerset Xu Hui
Shanghai and Somerset Olympic Tower Property Tianjin have uplifted ADR of renovated
apartment units by 27-35%.
— The first phase of renovation at Ascott Makati is on track for completion this year. We
expect to complete the refurbishment at Citadines Barbican London and Somerset Ho Chi
Minh City in 2017.
Somerset Grand Central Dalian Somerset Ho Chi Minh City Somerset Xu Hui Shanghai
18Active Asset Management
Proactive Portfolio Reconstitution Over The Years
2010 (S$335.7m) The proceeds from the 2012 2014 2015 (S$60.3m)
• Ascott Beijing S$301.8m • Fortune Garden • 6 Rental Housing Properties
• Country Woods Jakarta S$33.9m
divestments were deployed to Apartments1 (Ongoing) in Japan S$53.1m
fund the yield accretive • Salcedo Residence S$7.2m
acquisitions of
• Ascott Raffles Place
Singapore
• Ascott Guangzhou
Country Woods Fortune Garden
Ascott Beijing Salcedo Residences
Jakarta Apartments1
The proceeds from the 2010 2012 (S$374.6m) Ascott REIT has Ascott REIT
divestments were used to partly
• Somerset Gordon Heights Melbourne S$15.6m
commenced Divested
• Somerset Grand Cairnhill Singapore S$359.0m
fund the yield accretive strata sale of 81 • Six Rental
acquisitions of apartment units as Housing
announced in Properties In
• Citadines Mount Sophia
October 2013. Japan
Property Singapore,
• Somerset Hoa Binh Hanoi To date, all the • Salcedo
units have been Residences in
• 26 European properties in Somerset Gordon Somerset Grand Philippines
France, UK, Germany, sold or have letter
Heights Cairnhill
Belgium and Spain Melbourne Singapore of intent signed.
Note: Figures above are based on agreed sale price.
1. Formerly known as Somerset Grand Fortune Garden Property Beijing
19Capital and Risk Management
Healthy Balance Sheet and Credit Metrics
As at As at
30 June 2016 31 March 2016
Gearing 41.0% 38.9%
Interest Cover 4.1X 3.7X
Effective Borrowing Rate 2.5% 2.5%
Total Debts on Fixed Rates 80% 78%
Weighted Avg Debt to Maturity (Years) 4.9 5.1
NAV/Unit S$1.32 S$1.34
Ascott REIT’s Issuer Rating by Moody’s Baa3 Baa3
20Capital and Risk Management
Debt Profile as at 30 June 2016
Debt Maturity Profile By Debt Type
S$’m 22.6% Weighted Average Debt
to Maturity: 4.9 Years
448.9
400 17.2%
343.0 61%
350 13.3% 14.7%
291.7 12.3%
300
263.8 11.1%
200.0 244.6 Total Debt
250 221.8
S$1,990.6m
200 7.2% 120.0
143.9
150 62.8
39%
100 1.3% 123.1
100.0 0.2%
91.6 0.1%
50 26.8 87.9
1.4 4.7
0
2016 2017 2018 2019 2020 2021 2022 2023 2024 >2025
Bank loans 4.21% p.a. fixed rate S$200m MTN1
Bank Loans
2.01% p.a. fixed rate JPY5b MTN 1.17% p.a. fixed rate JPY7.3b MTN
Medium Term Notes (“MTN”)
4.30% p.a. fixed rate S$100m MTN 2.75% p.a. fixed rate EUR80m MTN
1.65% p.a. fixed rate JPY7b MTN 4.00% p.a. fixed rate S$120m MTN2
Ascott REIT seeks to diversify funding sources and secure long-term financing at an optimal cost.
Notes:
1. S$ proceeds from the notes have been swapped into Euros at a fixed interest rate of 1.81% p.a. over the same tenure
21 2. S$ proceeds from the notes have been swapped into Euros at a fixed interest rate of 2.15% p.a. over the same tenureCapital and Risk Management
Foreign Currency Risk Management
Debt By Currency (%) Balance Sheet Hedging (%)
As at 30 June 2016 As at 30 June 2016
EUR JPY 92.9
JPY
37% 31%
EUR 87.1
USD 47.9
Total Debt RMB 27.7
S$1,990.6m
MYR 21.0
GBP 20.2
VND 18.5
MYR USD
1% GBP 18%
PHP 10.3
3% RMB SGD
5% 5% AUD 1.9
Ascott REIT adopts a natural hedging strategy to the extent possible.
22Capital and Risk Management
Foreign Currency Risk Management
Gross Profit Exchange Rate Movement
Currency
YTD Jun 2016 (%) From 31 Dec 2015 to 30 Jun 2016 (%)
EUR 21.5 3.7
JPY 17.7 2.0
USD 10.8 -1.8
GBP 10.2 -5.7
VND 10.0 -1.6
RMB 8.8 -3.8
AUD 8.6 -
SGD 8.3 -
PHP 3.1 -1.5
MYR 1.0 1.7
Total 100.0 -0.2
We have entered into foreign currency forward contracts to hedge distribution income derived in EUR and JPY.
On a portfolio basis, 30% of FY 2016 foreign currency distribution income had been hedged.
23Capital and Risk Management
Ascott REIT continues to diversify funding sources by tapping debt
and equity capital markets
Issuance of seven-year fixed rate notes under its S$1b MTN Programme
― Successfully raised S$120m fixed rate notes due 2024 which was subsequently swapped into
Euros at an overall effective fixed rate of 2.15% p.a
Successfully raised gross proceeds of S$100m through a private equity placement
― Proceeds were deployed to finance yield-accretive acquisition in United States of America
The issuances are in line with Ascott REIT’s prudent capital management strategy to tap
diversified funding sources at optimal costs and enhance its financial flexibility to pursue
growth opportunities
24Conclusion
Ascott Raffles Place Singapore
25 Ascott Limited Presentation July 2013Conclusion
1
The acquisition of the 369-unit Sheraton Tribeca New York Hotel, Ascott REIT’s
Actively seek second property in New York, USA, was completed on 29 April 2016.
accretive Remains on track to achieve target portfolio size of S$6.0 billion by 2017 as it
acquisition continues to seek accretive acquisitions in Australia, Japan, Europe and the
United States of America
2
Focus on To date, all the units in Fortune Garden Apartments have been sold or have letter
rejuvenating of intent signed.
and creating Continues to create new value through AEI for certain properties in China,
value for Vietnam, Philippines and the United Kingdom following successful AEI at properties
portfolio in China and Vietnam which uplifted ADR by 27-35%
3
Maintain Maintained effective borrowing rate at 2.5% p.a. with 80% of the Group’s
borrowings on fixed interest rates.
disciplined and
prudent capital Continues to remain vigilant to changes in macro and credit environment that
management may impact Ascott REIT’s financing plans
26Conclusion
A Leading Global Serviced Residence REIT
S$1.9b1 S$4.9b2 11,649 90 38
Market Capitalisation Total Assets Apartment Units Properties Cities in 14 Countries
United Kingdom
4 Properties
Belgium
2 Properties
Germany
The United States of America 3 Properties China
France 10 Properties
2 Properties 17 Properties
Spain Japan
1 Property Vietnam 33 Properties
5 Properties
Malaysia The Philippines
1 Property 2 Properties
Singapore
3 Properties
Indonesia
2 Properties
Australia
5 Properties
Notes:
Figures above as at 30 June 2016
1. Market capitalisation as at 11 August 2016
2. Excludes Ascott Orchard Singapore, which acquisition is targeted to be completed in 2017. If Ascott Orchard Singapore were
27 included, the portfolio of Ascott REIT would be approximately S$5.3 billion.Appendix
Ascott Raffles Place Singapore
28 Ascott Limited Presentation July 2013Financial Highlights for 2Q 2016
2Q 2016 vs 2Q 2015 Financial Performance
Revenue (S$m) Gross Profit (S$m)
119.4
98.7 57.9
↑21% 49.4 ↑17%
2Q 2015 2Q 2016 2Q 2015 2Q 2016
Revenue Per Available Unit (S$) Unitholders’ Distribution (S$m)
129 142 32.3 35.0
↑10% ↑8%
2Q 2015 2Q 2016 2Q 2015 2Q 2016
Distribution Per Unit (S cents) Adjusted Distribution Per Unit (S cents)
1
2.09 2.13 2.09 1.95
2
↑2% ↓7%
2Q 2015 2Q 2016 2Q 2015 2Q 2016
Notes:
1. DPU adjusted for effect of equity placement would be 2.16 cents for 2Q 2016.
2. Unitholders’ distribution in 2Q 2016 included a realised exchange gain of S$3.5 million arising from repayment of foreign currency bank loans with
29 the divestment proceeds from Fortune Garden Apartments.Financial Highlights for 1H 2016
1H 2016 vs 1H 2015 Financial Performance
Revenue (S$m) Gross Profit (S$m)
224.9
188.7 92.5 106.4
↑19% ↑15%
1H 2015 1H 2016 1H 2015 1H 2016
Revenue Per Available Unit (S$) Unitholders’ Distribution (S$m)
134 59.3 62.4
122 ↑5%
↑10%
1H 2015 1H 2016 1H 2015 1H 2016
Distribution Per Unit (S cents) Adjusted Distribution Per Unit (S cents)
1
3.85 3.88 3.85 3.71
2
↑1% ↓4%
1H 2015 1H 2016 1H 2015 1H 2016
Notes:
1. DPU adjusted for effect of equity placement would be 3.92 cents for 1H 2016.
2. Unitholders’ distribution in 1H 2016 included a realised exchange gain of S$3.5 million arising from repayment of foreign currency bank loans with
30 the divestment proceeds from Fortune Garden Apartments.Portfolio Value Up by 4%1
Higher valuation from properties in Japan, Spain, UK and USA
— Portfolio valuation as at 30 June 2016 of S$4,562.6m
— Portfolio value increased mainly due to acquisition of Sheraton Tribeca New York Hotel as
well as higher valuation from properties in Japan, Spain, UK and USA, partially offset by
lower valuation from properties in Malaysia, Indonesia and Singapore.
Citadines Central Shinjuku Citadines Karasuma-Gojo Sheraton Tribeca New York
Citadines Ramblas Barcelona
Tokyo Kyoto Hotel
Note:
1. As compared to valuation as at 31 December 2015
31China
Somerset Citadines Citadines Somerset Ascott Somerset Olympic Citadines Citadines Somerset Xu
Grand Central Zhuankou Gaoxin Xi’an Heping Guangzhou Tower Property Xinghai Biyun Hui Shanghai
Dalian Wuhan Shenyang Tianjin Suzhou Shanghai
-8% -3%
-5% -8% Key Market Performance Highlights
RMB
90.0 500
83.1
441 Revenue and RevPAU decreased mainly
80.0 76.4 450 due to weaker demand from project
408
400 groups.
70.0
350
60.0
Gross profit decreased due to lower
300
50.0 revenue, partially offset by lower business
250 tax and depreciation expense.
40.0
200
30.0 24.4 23.7 ADR of refurbished apartment units at
150
Somerset Xu Hui Shanghai was uplifted by
20.0 100 approximately 27% in Phase 2C. Phase 2D,
the final phase of AEI, was completed in
10.0 50
June 2016.
0.0 0
Revenue ('mil) Gross Profit ('mil) RevPAU
2Q 2015 2Q 2016
32Japan
Somerset Citadines Citadines Citadines Central 29 rental housing
Azabu East Shinjuku Karasuma-Gojo Shinjuku Tokyo properties
Tokyo Tokyo Kyoto in Japan
JPY
8% 8% 9% Key Market Performance Highlights
1600.0 13,113 1400000%
Revenue and gross profit increased mainly
12,070 due to contribution from the portfolio of four
1400.0 1,357.6
rental housing properties acquired in July
1200000%
1,257.5
1,237.81 2015.
1,183.8
1200.0 1
1000000%
1000.0 On a same store basis, revenue and gross
profit and RevPAU increased mainly due to
800000%
800.0 731.9 794.1 stronger demand from the leisure sector.
706.91
674.51 600000%
600.0
Occupancy for rental housing properties
remained stable at 98% in 2Q 2016.
400000%
400.0
200.0 200000%
2 2 3
0.0 0%
Revenue ('mil) Gross Profit ('mil) RevPAU
2Q 2015 2Q 2016 Same store1
Notes:
1. Excluding six rental housing properties which were divested on 30 September 2015 and four rental housing properties which were
acquired on 31 July 2015
2. Revenue and gross profit figures above relate to properties under master leases and management contracts
33 3. RevPAU relates to serviced residences and excludes rental housing propertiesSingapore
Somerset Liang Citadines Mount Ascott
Court Property Sophia Property Raffles Place
Singapore Singapore Singapore
-8% -4% -8%
1%
3% Key Market Performance Highlights
SGD
10.0 250
226 Revenue and RevPAU decreased mainly
8.9 due to weaker corporate demand.
9.0
8.2 209
8.0 200
Gross profit decreased due to lower
7.0 revenue, partially offset by lower
6.0 150 depreciation expense and property tax.
5.0 4.7 4.5
4.0 100
3.0
2.0 50
1.0
0.0 1 1
2
0
Revenue ('mil) Gross Profit ('mil) RevPAU
2Q 2015 2Q 2016
Notes:
1. Revenue and gross profit figures above relate to properties under master leases and management contracts
34 2. Includes RevPAU of Ascott Raffles Place SingaporeUnited Kingdom
Citadines Citadines Holborn- Citadines Citadines South
Barbican Covent Garden Trafalgar Square Kensington
London London London London
-6% -6% -5% Key Market Performance Highlights
GBP
8.0 140
7.2 124 Revenue, gross profit and RevPAU
7.0 6.8 118 decreased mainly due to ongoing
120
refurbishment at Citadines Barbican
6.0 London.
100
5.0
80 Phased refurbishment of 129 apartment
units at Citadines Barbican London has
4.0 3.5 3.3 commenced in 1Q 2016 and it is expected
60
3.0 to be completed in 1Q 2017.
40
2.0
1.0 20
0.0 0
Revenue ('mil) Gross Profit ('mil) RevPAU
2Q 2015 2Q 2016
35France
La Clef Citadines Citadines Citadines Citadines Citadines
Louvre Paris1 Les Halles Croisette Place d’Italie Tour Eiffel Austerlitz
Paris Cannes Paris Paris Paris
Key Market Performance Highlights
EUR
6.0 5.7 5.7
5.3 5.3 All the properties in France are underpinned
by master leases hence operational risks are
5.0 mitigated.
4.0 Master lease rental income has remained
stable in 2Q 2016.
3.0
2.0
1.0
0.0
Revenue ('mil) Gross Profit ('mil)
2Q 2015 2Q 2016
Note:
1. Formerly known as Citadines Suites Louvre Paris
36Vietnam
Somerset
Somerset Somerset Somerset West Somerset Ho
Chancellor Court
Grand Hanoi Hoa Binh Hanoi Lake Hanoi Chi Minh City
Ho Chi Minh City
-4%
4% 5% -8% Key Market Performance Highlights
VND
180.0 1,501 1600
Revenue and RevPAU decreased mainly
156.3 1,388 due to ongoing refurbishment at Somerset
160.0 150.3 1400
Ho Chi Minh City and weaker corporate
140.0 demand in Hanoi.
1200
120.0
1000 Gross profit decreased due to lower
100.0 revenue, partially offset by lower
84.0 83.6 800 depreciation expense.
80.0
600
60.0 ADR of refurbished apartment units at
400 Somerset Ho Chi Minh City was uplifted by
40.0
approximately 27% in the latest completed
20.0 200 phase of AEI in 1Q 2015. The final phase of
AEI is on track for completion in 1Q 2017.
0.0 0
Revenue ('bil) Gross Profit ('bil) RevPAU ('000)
2Q 2015 2Q 2016
37Australia
Citadines on Citadines Quest Sydney Quest Quest Mascot
Bourke Melbourne St Georges Olympic Park Campbelltown
Terrace Perth
>100% -13% Key Market Performance Highlights
AUD >100% 10%
9.0 180
8.3 Revenue and gross profit increased mainly
160
8.0 160 due to the acquisition of Citadines on
140 147 Bourke Melbourne in July 2015.
7.0 140
6.0 120 Excluding the contribution from Citadines on
Bourke Melbourne, revenue and gross profit
5.0 100
4.3 remained at the same level as last year.
4.0 80
3.0
3.0 3.0 60 RevPAU decreased mainly due to lower
2.1 ADR from the newly acquired property and
2.0 2.1 40 weaker market demand in Perth.
1.0 20
0.0 0
1 1 2
Revenue ('mil) Gross Profit ('mil) RevPAU
2Q 2015 2Q 2016 Same store3
Notes:
1. Revenue and gross profit figures above relate to properties under master leases and management contracts
2. RevPAU relates to Citadines on Bourke Melbourne and Citadines St Georges Terrace Perth only.
3. Citadines on Bourke Melbourne was acquired in July 2015.
38The United States of America
Sheraton Tribeca Element New York
New York Hotel Times Square West
Key Market Performance Highlights
USD
18.0 300
Ascott REIT made its first foray into USA with
15.3 the acquisition of the 411-unit Element New
16.0 247
250 York Times Square West on 19 August 2015
14.0
12.0 200 Ascott REIT acquired its second property,
Sheraton Tribeca New York Hotel, on 29 April
10.0 2016.
150
8.0
6.0 5.4 100
4.0
50
2.0
0.0 0
Revenue ('mil) Gross Profit ('mil) RevPAU
2Q 2016
39Master Leases
(2Q 2016 vs 2Q 2015) La Clef Citadines Citadines Citadines Ascott Quest Sydney
Louvre Paris1 Les Halles Paris Croisette Arnulfpark Raffles Place Olympic Park
Cannes Munich Singapore
Revenue (‘mil) Gross Profit (‘mil)
2Q 2016 2Q 2015 2Q 2016 2Q 2015
Australia (AUD)
1.8 1.7 -
- 1.7 1.6
3 Properties
France (EUR)
5.7 5.7 - 5.3 5.3 -
17 Properties
Germany (EUR)
1.5 1.5 - 1.3 1.4
3 Properties
Japan (JPY)
133.3 187.6 - 104.3 149.4 -
1 Property2
Singapore (SGD)
Ascott Raffles Place Singapore 1.8 2.4 - 1.6 2.0 -
Notes:
1. Formerly known as Citadines Suites Louvre Paris
40 2. Five rental housing properties in Japan were divested on 30 September 2015Management Contracts with Minimum Guaranteed
Income (2Q 2016 vs 2Q 2015)
Revenue (‘mil) Gross Profit (‘mil) RevPAU
2Q 2016 2Q 2015 2Q 2016 2Q 2015 2Q 2016 2Q 2015
Belgium (EUR)
1.5 2.4 0.3 0.8 48 74
2 Properties
Spain (EUR)
1.4 1.4 - 0.7 0.7 - 112 108
1 Property
United Kingdom (GBP)
4 Properties 6.8 7.2 3.3 3.5 118 124
41Management Contracts (2Q 2016 vs 2Q 2015)
Revenue (‘mil) Gross Profit (‘mil) RevPAU
2Q 2016 2Q 2015 2Q 2016 2Q 2015 2Q 2016 2Q 2015
Australia (AUD) 6.5 1.3 2.6 0.5 140 160
China (RMB) 76.4 83.1 23.7 24.4 408 441
Indonesia (USD) 3.1 3.2 1.1 1.1 - 81 86
Japan (JPY)1 1,224.3 1,069.9 689.8 582.5 13,113 12,070
Malaysia (MYR) 4.6 4.7 1.5 1.2 246 249
Philippines (PHP) 168.3 247.7 52.1 85.6 3,459 4,096
Singapore (SGD) 6.4 6.5 2.9 2.7 200 203
United States of America
15.3 - - 5.4 - - 247 - -
(USD)
Vietnam (VND)2 150.3 156.3 83.6 84.0 - 1,388 1,501
Notes:
1. RevPAU for Japan refers to serviced residences and excludes rental housing.
2. Revenue and gross profit figures for VND are stated in billions. RevPAU figures are stated in thousands.
42Belgium
Citadines Citadines
Sainte-Catherine Toison d’Or
Brussels Brussels
20%
-38% -63% -35%
EUR
2.6
2.5
2.4 74 80
2.4
2.3 70
2.2
2.1
2.0 60
1.9
1.8
1.7 1.5 48
1.6
1.5 50
1.4
1.3 40
1.2
1.1 0.8
1.0
0.9 30
0.8
0.7
0.6
0.5
0.4
0.3 20
0.3
0.2 10
0.1
0.0 0
Revenue ('mil) Gross Profit ('mil) RevPAU
2Q 2015 2Q 2016
Revenue, gross profit and RevPAU decreased mainly due to weaker demand following terror attacks in March
2016.
43Spain
Citadines Ramblas
Barcelona
4%
2.0EUR 108 112 120
1.4 1.4 100
80
1.0 60
0.7 0.7
40
20
0.0 0
Revenue ('mil) Gross Profit ('mil) RevPAU
2Q 2015 2Q 2016
Revenue, gross profit and RevPAU remained fairly stable.
44Malaysia
Somerset Ampang
Kuala Lumpur
-2% -1%
25%
MYR
5.0 4.7 4.6 300
4.5 249 246
4.0 250
3.5 200
3.0
2.5 150
2.0
1.2 1.5 100
1.5
1.0 50
0.5
0.0 0
Revenue ('mil) Gross Profit ('mil) RevPAU
2Q 2015 2Q 2016
Revenue and RevPAU decreased due to lower corporate accommodation budgets. Gross profit increased
due to lower depreciation expense.
45Indonesia
Ascott Jakarta Somerset Grand
Citra Jakarta
-3% -6%
USD
3.5 3.2 3.1 86 100
3.0
81 90
80
2.5 70
2.0 60
50
1.5 1.1 1.1 40
1.0 30
20
0.5 10
0.0 0
Revenue ('mil) Gross Profit ('mil) RevPAU
2Q 2015 2Q 2016
Revenue and RevPAU decreased mainly due to weaker corporate demand.
46The Philippines
Ascott Makati Somerset
Millennium Makati
-32% -16%
PHP
300.0 4,096 4500
247.7
250.0 -39% 3,459 4000
3500
200.0 168.3 3000
2500
150.0
2000
100.0 85.6 1500
52.1 1000
50.0
500
0.0 0
Revenue ('mil) Gross Profit ('mil) RevPAU
2Q 2015 2Q 2016
Revenue, gross profit and RevPAU decreased mainly due to ongoing refurbishment at Ascott Makati, reduced
room inventory at Somerset Millennium and weaker demand from corporate accounts.
47Outlook and Prospects
On 23 June 2016, UK voted to leave European Union and this outcome has led to uncertainties
and weak business sentiments, which is expected to impact business travel as corporates
evaluate their options. The silver lining to the impact from Brexit will be the potential boost to
leisure travel due to the weaker GBP, providing support for accommodation demand. As at
2Q 2016, Ascott REIT’s properties in UK which are located in London made up 10.4% of total
assets. These properties are underpinned by management contracts with minimum
guaranteed income which provides a downside protection to the operating
income. Notwithstanding that about 10.2% of Ascott REIT's YTD June 2016 gross profit is
contributed by GBP, the impact due to the depreciation of GBP is mitigated by Ascott REIT’s
well-diversified portfolio over 14 countries in Asia Pacific, Europe and the United States of
America.
In April 2016, we completed the acquisition of our second US property, Sheraton Tribeca New
York Hotel. Including Ascott Orchard Singapore which Ascott REIT has entered into a forward
contract to acquire the property, Ascott REIT's total assets would have reached S$5.3 billion.
The Group remains on the look out for accretive opportunities in the key gateway cities of
Australia, Japan, Europe and United States of America.
The final phase of refurbishment at Somerset Xu Hui Shanghai was completed in June 2016
and the first phase of renovation at Ascott Makati is on track for completion this year. We
expect to complete the refurbishment at Citadines Barbican London and Somerset Ho Chi
Minh City in 2017. The Group will continue to refurbish Ascott REIT’s properties to enhance
guest experience and maximise returns to Unitholders.
48Outlook and Prospects
On the capital management front, the Group continues to maintain a disciplined and
prudent capital management approach. As at 30 June 2016, the loans that are coming due
in FY 2016 have been substantially refinanced. Ascott REIT continues to maintain a strong
balance sheet, with 80% of its total borrowings on fixed interest rates to hedge against the
rising interest rate.
To date, all of the units in Fortune Garden Apartments have been sold or have letter of intent
signed. Part of the proceeds from the divestment that has been remitted back to Singapore
was deployed to repay bank loans. The remaining proceeds from the sale is expected to be
remitted back to Singapore in due course.
Going forward, the slow-paced global economic recovery, coupled with the uncertainties
associated with the formalisation of Brexit and security concerns, is likely to weigh on the
global growth outlook. Notwithstanding, the performance of the properties in Europe is
expected to remain stable as the properties in France are primarily underpinned by master
leases and properties in Belgium and Spain are underpinned by management contracts with
minimum guaranteed income. We are confident that Ascott REIT with its diversified portfolio
and extended-stay business model will continue to deliver stable income and returns to its
Unitholders. The Group’s operating performance for FY 2016 should remain profitable.
49Ongoing Asset Enhancement Initiatives
Properties Costs Time Period
1 Ascott Makati US$26.1m1 Phase 1:
- Phased renovation of selected apartment units, café, business (S$37.8m) 4Q 2015 to 3Q 2016
centres and public area
- Upgrade mechanical and electrical infrastructure
2 Citadines Barbican London £3.9m 1Q 2016 to 1Q 2017
- Phased renovation of 129 apartment units (S$8.3m)
3 Somerset Millennium Makati US$1.0m 2Q 2016 to 1Q 2017
- Renovation of 113 apartment units (S$1.5m)
4 Somerset Ho Chi Minh City (Phase 2) US$7.8m 1Q 2016 to 1Q 2017
- Renovation of 103 apartment units, of which 2 units will be (S$11.3m)
converted into common areas and 35 units (comprising 3 BR
premier and 4BR apartment units) will be converted into dual key
units.
Total S$58.9m
Note:
1. For the entire refurbishment project
50Completed Asset Enhancement Initiative
Somerset Xu Hui Shanghai (Phase 2C and 2D)
Phase 2C Phase 2D (Final)
Capex incurred RMB18.2m (S$3.9m) RMB20.1m (S$4.4m)
Renovation of 42 Renovation of 42
Capex work
apartment units from apartment units from
being done
level 15 to 21 level 2 to 12
Period of
2Q 2015 to 4Q 2015 4Q 2015 to 2Q 2016
renovation
ADR uplift for
Approximately 27% -
renovated units
Before After
51Distribution Details
Distribution Period1 23 March 2016 to 30 June 2016
Distribution Rate 2.290 cents per Unit
Last Day of Trading on “cum” Basis 25 July 2016, 5pm
Ex-Date 26 July 2016, 9am
Books Closure Date 28 July 2016
Distribution Payment Date 24 August 2016
Note:
1. Advanced distribution of 1.585 cents per Unit for the period from 1 January 2016 to 22 March 2016 (prior to the date on which the
52 placement units were issued) was paid on 27 April 2016.Trust Structure
Unitholders
Holding of Units Distributions
Management Acts on behalf
Services of Unitholders
Manager Trustee
Ascott Residence Trust DBS Trustee Limited
Management Limited – for Unitholders
Management Trustee’s Fees
Fees
Net Profit Dividends
Ownership Ownership
of Assets of Shares
Singapore
Properties
Master Lease Master Lease Property Holding
Ascott Raffles Master Companies /
Place Singapore Lessees Property
Master Lease Income Master Lease Income Companies
Citadines Mount Serviced Residence Serviced Residence
Sophia Property Management Fees Management Fees
Serviced Residence
Singapore &
Management
Somerset Liang
Companies
Court Property Serviced Residence Serviced Residence
Singapore Management Services Management Services
53Types of Contracts1
Properties under
Properties under Management Contracts Properties on
Master Lease with Minimum Income Management Contracts
Guarantee
Master Lessees (which Properties on management No fixed or guaranteed
include third parties and contracts that enjoy rental but Ascott as
Description subsidiaries of Ascott) pay minimum guaranteed operator manages Ascott
fixed rental per annum2 to income (from subsidiaries of REIT’s properties for a fee
Ascott REIT Ascott)
Average weighted remaining tenure of about 3.9 years Generally on a 10-year
basis
Tenure
25 properties 7 properties 58 properties
- 3 in Australia - 4 in UK - 32 in Japan
- 17 in France - 2 in Belgium - 22 in Asia (ex-Japan)
Location
- 3 in Germany - 1 in Spain - 2 in Australia
- 1 in Japan - 2 in USA
- 1 in Singapore
Notes:
1. Figures as at 30 June 2016
2. The rental payments under the master leases are generally fixed for a period of time. However, the master leases provide for
annual rental revisions and/or pegged to indices representing construction costs, inflation or commercial rental prices according
to market practice. Accordingly, the rental revisions may be adjusted upwards or downwards depending on the above factors.
54You can also read