ASCENDAS REIT
1Q FY2020 Business Updates
28 April 2020
←
→
Page content transcription
If your browser does not render page correctly, please read the page content below
ASCENDAS REIT 1Q FY2020 Business Updates 28 April 2020
Disclaimers
•   This presentation may contain forward-looking statements. Actual future performance, outcomes and results may differ materially from
    those expressed in forward-looking statements as a result of a number of risks, uncertainties and assumptions. Representative examples
    of these factors include (without limitation) general industry and economic conditions, interest rate trends, cost of capital and capital
    availability, availability of real estate properties, competition from other developments or companies, shifts in customer demands, shifts in
    expected levels of occupancy rate, property rental income, charge out collections, changes in operating expenses (including
    employee wages, benefits and training, property operating expenses), governmental and public policy changes and the continued
    availability of financing in the amounts and the terms necessary to support future business.

•   You are cautioned not to place undue reliance on these forward-looking statements, which are based on the current view of
    management regarding future events. No representation or warranty expressed or implied is made as to, and no reliance should be
    placed on, the fairness, accuracy, completeness or correctness of the information or opinions contained in this presentation. Neither
    Ascendas Funds Management (S) Ltd (“Manager”) nor any of its affiliates, advisers or representatives shall have any liability whatsoever
    (in negligence or otherwise) for any loss howsoever arising, whether directly or indirectly, from any use, reliance or distribution of this
    presentation or its contents or otherwise arising in connection with this presentation.

•   The past performance of Ascendas Real Estate Investment Trust (“Ascendas Reit”) is not indicative of future performance. The listing of
    the units in the Ascendas Reit (“Units”) on the Singapore Exchange Securities Trading Limited (the “SGX-ST”) does not guarantee a liquid
    market for the Units. The value of the Units and the income derived from them may fall as well as rise. Units are not obligations of,
    deposits in, or guaranteed by, the Manager. An investment in the Units is subject to investment risks, including the possible loss of the
    principal amount invested. Investors have no right to request that the Manager redeem or purchase their Units while the Units are listed
    on the SGX-ST. It is intended that holders of Units may only deal in their Units through trading on the SGX-ST.

•   This presentation is for information only and does not constitute an invitation or offer to acquire, purchase or subscribe for the Units.

                                                                                                                                                    2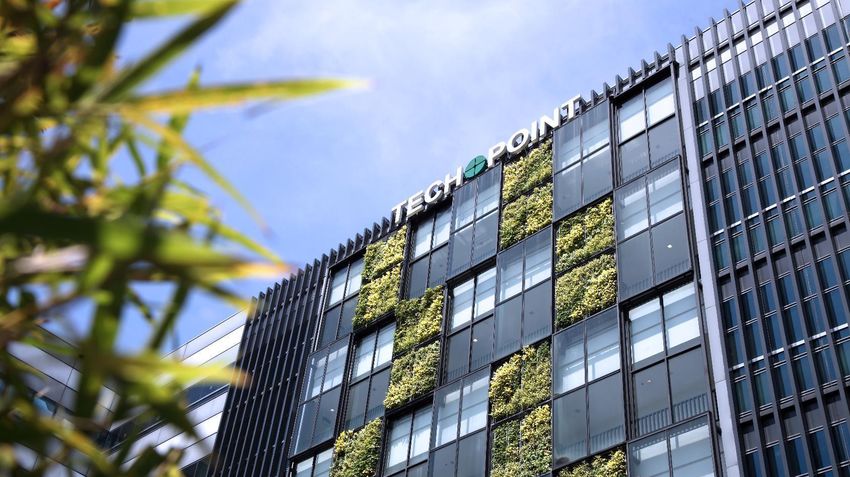
Agenda

Key Highlights          4

Investment Management   6

Capital Management      9

Asset Management        14

COVID-19 Updates        23

                             3
Key Highlights

                 ONE@Changi City, Singapore
Key Highlights - 1Q FY2020
Asset Management                                                                               Capital Management

    Healthy Portfolio                            Positive Portfolio                               Healthy Aggregate                                      High Level of
      Occupancy                                  Rental Reversion#                                   Leverage to                                        Natural Hedge
         91.7 %                                           +8.0%                                               36.2%                                           >76.0%
                                                                                                   From 35.1% as at 31 Dec 2019

  Investment Management

  • Acquired a 25% stake in Galaxis for purchase consideration of S$102.9 m
  • Divested three Singapore properties for total sales proceeds of S$125.3 m
  • Completed two asset enhancement initiatives worth S$14.5 m

# Percentage change of the average gross rent over the lease period of the renewed leases against the preceding average gross rent from lease start date. Takes into account renewed
leases in multi-tenant buildings that were signed in 1Q FY2020 and average gross rents are weighted by area renewed.                                                                   5
Investment
Management
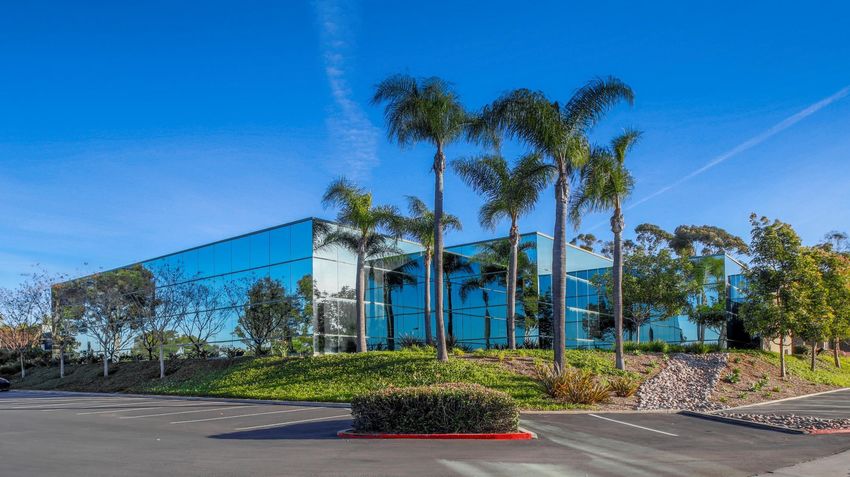
15378 Avenue of Science
San Diego, United States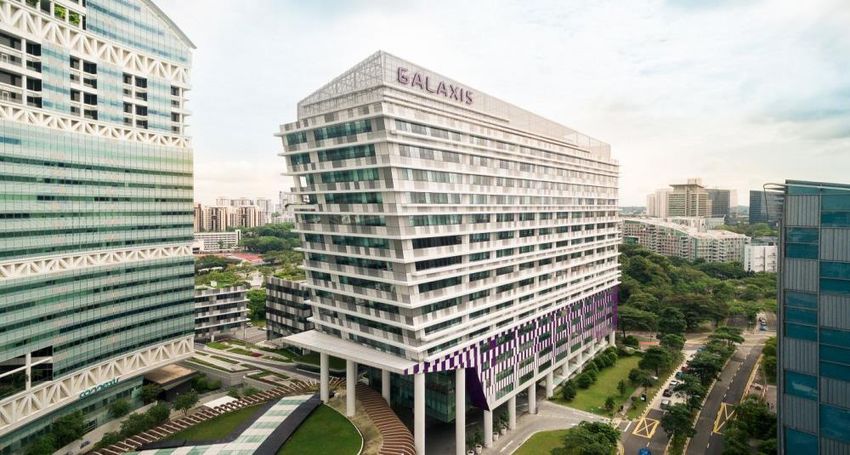
Investment Highlights
▪ Acquired a 25% stake in Galaxis for a purchase consideration of S$102.9 m
▪ Divested three Singapore properties for total sales proceeds of S$125.3 m
▪ Completed two asset enhancement initiatives in 1Q FY2020 worth S$14.5 m
Purchase Consideration Completion
1Q FY2020 Country Sub-segment
(S$m) Date
Acquisition 102.9
25% stake in Galaxis Singapore Business & Science Park 102.9 31 Mar 2020
Total Cost/Sale Price Completion
1Q FY2020 Country Sub-segment
(S$m) Date
Divestments 125.3
Wisma Gulab Singapore High-Specs Industrial 88.0 23 Jan 2020
202 Kallang Bahru Singapore Light Industrial 17.0 4 Feb 2020
25 Changi South Street 1 Singapore Light Industrial 20.3 6 Mar 2020
Asset Enhancement Initiatives 14.5
The Capricorn Singapore Business & Science Park 6.0 20 Feb 2020
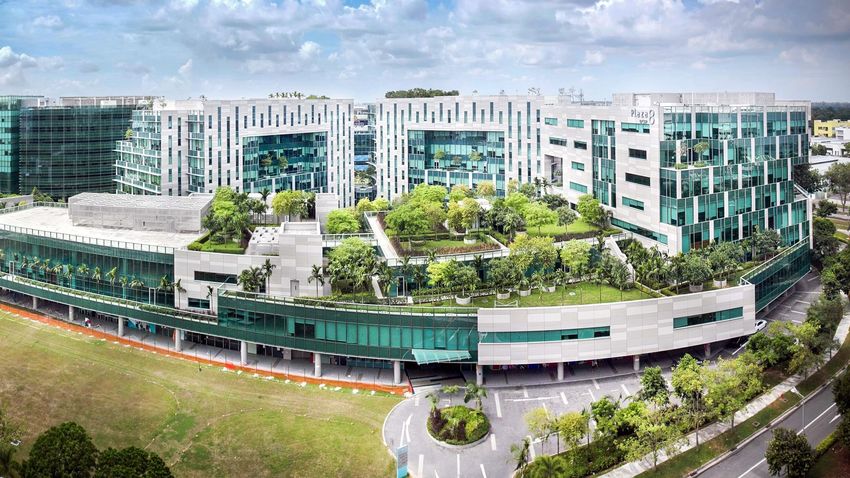
Plaza 8 Singapore Business & Science Park 8.5 5 Mar 2020
7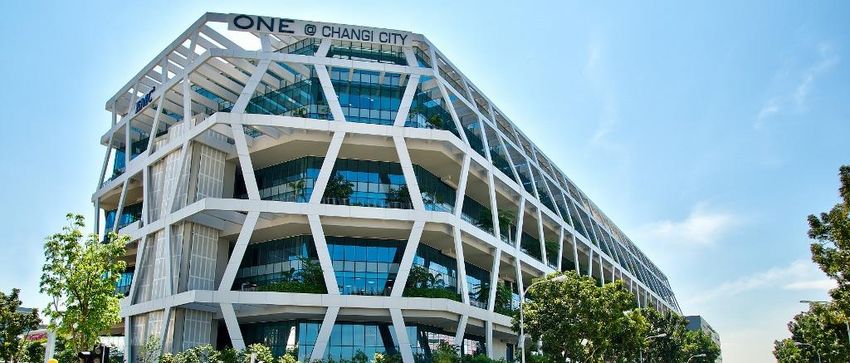
Acquisition: 25% stake in Galaxis, Singapore
Purchase Consideration           (1)                           S$102.91 m
Acquisition Fee, Stamp Duty and Other
                                                               S$2.99 m
Transaction Costs (2)
Total Acquisition Cost                                         S$105.90 m
                                                               MBK Real Estate Asia Pte Ltd, a wholly-
Vendor
                                                               owned subsidiary of Mitsui & Co, Ltd
Agreed Property Value (based on 100%)                          S$630.0 m
Valuation as at 26 Mar 20 (based on 100%)                      S$650.0 m
Land Area                                                      19,283 sqm
                                                                                                                                        Galaxis, Singapore
Land Tenure                                                    Approx. 52 years
Net lettable area                                              60,752 sqm                                               The Property:
                                                                                                                        ▪ Galaxis comprises a 17-storey building with
Occupancy (as at acquisition)                                  99.6%
                                                                                                                          business park and office space, a two-storey
Weighted Average Lease Expiry                                                                                             retail and F&B podium, a five-storey building
                                                               2.5 years
(as at acquisition)                                                                                                       with work lofts and a two-storey basement
                                                                                                                          carpark. It is zoned for Business Park use with
Key Tenants                                                    Canon, Oracle, Sea (formerly Garena)
                                                                                                                          a 30% White Component.
Initial Net Property Income Yield                              6.2% (6.1% post-transaction cost)
                                                                                                                        Well-Located:
Completion Date                                                31 Mar 2020
                                                                                                                        ▪ Situated at the heart of Fusionopolis, one-
(1) Purchase consideration is subject to post-completion adjustments and based on 25% of the Adjusted Net Asset           north with direct access to the one-north
    Value of Ascendas Fusion 5 Pte Ltd, the holding entity for Galaxis, as at the date of completion. This takes into     MRT station
    consideration the Agreed Property value of S$630.00 m, which is about 3.1% lower than the independent
    market valuation of the Property of S$650.00 m as at 26 March 2020. The valuation was commissioned by HSBC
                                                                                                                        ▪ About 5-minute drive to Ayer Rajah
    Institutional Trust Services (Singapore) Limited (as trustee of Ascendas Reit) and was carried out by CBRE Pte        Expressway and a 15-minute drive to the
    Ltd using the Income Capitalisation and Discounted Cash Flow approaches.                                              Central Business District.
(2) Includes acquisition fees payable to the Manager in cash (being 1.0% of the 25% of Agreed Property Value,
    which amounts to approximately S$1.575 m)                                                                                                                        8
Capital Management

                     1,3 & 5 Changi Business Park Crescent, Singapore
                                             9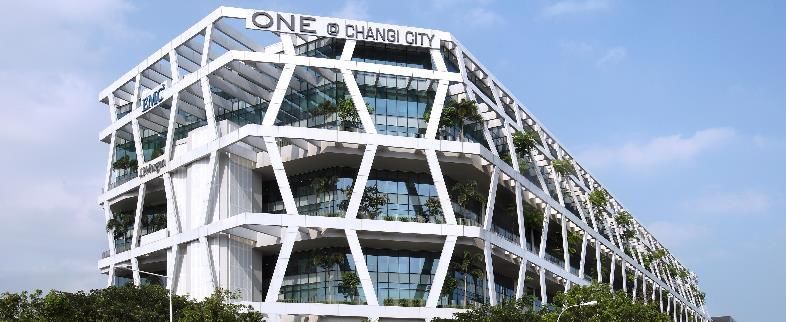
Healthy Balance Sheet
  ▪ Aggregate leverage is healthy at 36.2% (1)(2)
  ▪ Available debt headroom of ~S$3.8 b (1)(2) to reach 50.0% aggregate leverage
  ▪ Total assets include cash and equivalent of ~ S$290 m to meet current financial and operational
    obligations

                                                                                               As at                                     As at                                      As at
                                                                                            31 Mar 2020                               31 Dec 2019                                31 Mar 2019

 Total Debt (S$m) (1)(3)                                                                        4,981 (2)                                    4,653                                      4,141
 Total Assets (S$m) (1)                                                                        13,746 (2)                                   13,246                                     11,414
 Aggregate Leverage (1)                                                                         36.2% (2)                                    35.1%                                      36.3%
 Unitholders' Funds (S$m)                                                                         7,907                                      7,810                                      6,642
 Net Asset Value (NAV) per Unit                                                               218 cents                                  216 cents                                  213 cents
 Adjusted NAV per Unit (4)                                                                    215 cents                                  213 cents                                  205 cents
 Units in Issue (m)                                                                              3,618 (5)                                 3,613 (5)                                    3,111
(1) Excludes the effects of FRS 116.
(2) Includes interests in JV
(3) Excludes fair value changes and amortised costs. Borrowings denominated in foreign currencies are translated at the prevailing exchange rates except for JPY/HKD-denominated debt issues, which are
    translated at the cross-currency swap rates that Ascendas Reit has committed to.
(4) Adjusted for the amount to be distributed for the relevant period after the reporting date.                                                                                                           10
(5) 498 million new Units were issued on 6 December 2019 in relation to the Rights Issue.
Well-spread Debt Maturity Profile
▪ Well-spread debt maturity with the longest debt maturing in FY2029
▪ Average debt maturity is stable at 3.8 years (Dec 2019: 4.0 years; Mar 2019: 4.0 years)
▪ Entered into a 5-year US$198 m (S$275 m) Term Loan in 1Q FY2020 to ensure a high level of natural hedge in
the United States
▪ S$200 m of committed and ~S$1.1 b of uncommitted facilities are unutilised
4% 7%
39%
50%
11Key Funding Indicators
▪ Robust financial metrics that exceed bank loan covenants by a healthy margin
▪ Enable access to wider funding options at competitive rates
As at As at
31 Mar 2020 31 Dec 2019
Aggregate Leverage (1) 36.2% (2)(3) 35.1% (2)
Unencumbered Properties as % of Total Investment
92.5% 91.8%
Properties (4)
Interest Cover Ratio (2)(5) 5.0 x 4.9 x
Net Debt (6) / EBITDA 8.0 x 8.1 x
Weighted Average Tenure of Debt (years) 3.8 4.0
Weighted Average all-in Debt Cost 2.9% 2.9%
Issuer Rating by Moody’s A3 A3
(1) Based on total gross borrowings divided by total assets. Correspondingly, the ratio of total gross borrowings (including perpetual securities) to unitholders’ funds is 66.1%.
(2) Exclude the effects of FRS 116.
(3) Computation includes interests in JV.
(4) Total investment properties exclude properties reported as finance lease receivable.
(5) Based on the trailing 12 months EBITDA (excluding effects of any fair value changes of derivatives and investment properties, and foreign exchange translation), divided by the trailing 12 months interest
expense and borrowing-related fees.
(6) Net debt includes lease liabilities arising from FRS 116, 50% of perpetual securities, offset by cash and fixed deposits. 12High Natural Hedge
▪ Maintained high level of natural hedge for Australia (76%), the United Kingdom (100%) and United States
(increase from 76% to 100%) to minimise the effects of adverse exchange rate fluctuations
AUD GBP USD
Natural Hedge Natural Hedge Natural Hedge
76% 100% 100% (1)
1.8 A$1.7 b
(S$ 1.6 b)
1.6 US$1.0 b US$1.0 b
1.4 A$1.3 b (S$ 1.3 b) (S$ 1.3 b)
(S$ 1.2 b)
1.2
1.0 £0.5 b £0.5 b
(S$ 0.8 b) (S$ 0.8 b)
S$ (billion)
0.8
0.6
0.4
0.2
0.0
Total Australia Total Australia Total United Total United Total United States Total United States
Assets Borrowings Kingdom Assets Kingdom Assets Borrowings
Borrowings
(1) Natural hedge for United States has since increased from 76% as of 3Q FY2019 to 100% as of 1Q FY2020. 13Asset
Management
Infineon Building , Singapore
14Overview of Portfolio Occupancy
N.A.
Gross Floor
3,000,799 792,039(2) 509,907 (3) 313,059 4,615,804
Area (sqm) (1)
(1) Gross Floor Area as at 31 Mar 2020.
(2) Gross Floor Area for Australia portfolio refers to the Gross Lettable Area/Net Lettable Area.
(3) Gross Floor Area for United Kingdom portfolio refers to the Gross Internal Area. 15Singapore: Occupancy
▪ Occupancy improved to 88.6% mainly due to higher occupancies at 40 Penjuru Lane (31 Mar 2020: 84.2%,
31 Dec 2019: 80.6%) and LogisHub@Clementi (31 Mar 2020: 91.0%, 31 Dec 2019: 71.0%)
As at 31 Mar 2020 31 Dec 2019 31 Mar 2019
Total Singapore Portfolio GFA (sqm) 3,000,799(1)(2)(3)(4) 3,061,210(1)(2) 3,034,122
Singapore Portfolio Occupancy
88.5% 88.6% 89.6%
(same store) (5)
Singapore MTB Occupancy (same store) (6) 85.1% 85.0% 86.5%
Occupancy of Singapore Investments
93.7% 93.7% N.A.
Completed in the last 12 months
Overall Singapore Portfolio Occupancy 88.6% 87.2% 88.3%
Singapore MTB Occupancy 85.2% 83.4% 85.5%
(1) Excludes 25 Ubi Road 4 and 27 Ubi Road 4 which were decommissioned for redevelopment since Jun 2019.
(2) Excludes 8 Loyang Way 1, which was divested on 18 Sep 2019.
(3) Excludes 190 Macpherson Road, which was divested on 23 Jan 2020, 202 Kallang Bahru divested on 4 Feb 2020 and 25 Changi South Street 1 divested on 6 Mar 2020.
(4) Excludes iQuest@IBP, which was decommissioned for redevelopment since Jan 2020.
(5) Same store portfolio occupancy rates for previous quarters are computed with the same list of properties as at 31 Mar 2020, excluding new investments completed in the last 12 months and
divestments.
(6) Same store MTB occupancy rates for previous quarters are computed with the same list of properties as at 31 Mar 2020, excluding new investments completed in the last 12 months,
divestments and changes in classification of certain buildings from single-tenant to multi-tenant buildings or vice-versa. 16Australia: Occupancy
▪ Occupancy remained high at 97.3%
As at 31 Mar 2020 31 Dec 2019 31 Mar 2019
Total Australian Portfolio GFA (sqm) 792,039(1) 792,039(1) 810,772
Australian Portfolio Occupancy
97.2% 97.3% 97.9%
(same store) (2)
Occupancy of Australian Investments
N.A. N.A. 100%
Completed in the last 12 months
Overall Australian Portfolio Occupancy 97.3% 97.4% 98.0%
(1) The decrease in GFA was due to decommissioning of partial space at 484-490 and 494-500 Great Western Highway to facilitate AEI works to improve leasing outcomes.
(2) Same store portfolio occupancy rates for previous quarters are computed with the same list of properties as at 31 Mar 2020, excluding new investments completed in the last 12 months.
17United Kingdom: Occupancy
▪ Occupancy remained high at 97.5%
As at 31 Mar 2020 31 Dec 2019 31 Mar 2019
Total United Kingdom Portfolio GFA (sqm) 509,907 509,907 509,032
Occupancy of United Kingdom Investments
N.A. N.A. 100%
Completed in the last 12 months
Overall United Kingdom Portfolio
97.5% 97.7% 100%
Occupancy
18United States: Occupancy
▪ Occupancy remained relatively stable at 92.9%.
As at 31 Mar 2020 31 Dec 2019
Total United States Portfolio GFA (sqm) 313,059 313,059
Occupancy of United States Investments Completed
92.9% 93.9%
in the last 12 months
Overall United States Portfolio Occupancy 92.9% 93.9%
19Portfolio Rental Reversions
▪ Average portfolio rent reversion of 8.0% was recorded for leases renewed in 1Q FY2020
▪ Rental reversion for FY2020 is expected to be flat in view of the current uncertainties.
% Change in Renewal Rates for Multi-tenant Buildings (1) 1Q FY2020 3Q FY2019 4Q FY18/19
Singapore 7.7% 8.8% 6.6%
Business & Science Parks 7.0% 11.8% 4.8%
High-Specifications Industrial and Data Centres 12.2% 4.4% 3.9%
Light Industrial and Flatted Factories 4.2% 0.9% 2.9%
Logistics & Distribution Centres 0.3% 3.1% 9.7%
Integrated Development, Amenities & Retail 15.6% 1.4% 8.5%
Australia 13.7% - (2) - (2)
Suburban Offices 15.7% - (2) - (2)
Logistics & Distribution Centres 13.2% - (2) - (2)
United Kingdom - (2) - (2) - (2)
Logistics & Distribution Centres - (2) - (2) - (2)
United States 7.4% - (2) N.A.
Business Parks 7.4% - (2) N.A.
Total Portfolio : 8.0% 8.8% 6.6%
(1) Percentage change of the average gross rent over the lease period of the renewed leases against the preceding average gross rent from lease start date. Takes into account renewed leases
that were signed in their respective periods and average gross rents are weighted by area renewed. 20
(2) There were no renewals signed in the period for the respective segments.Ongoing Projects:
Improving Portfolio Quality
▪ Expected delay in built-to-suit business park development for Grab to 1Q 2021 (from 4Q 2020) due to
COVID-19 “circuit breaker” measures in Singapore
Estimated Estimated
Country
Value (S$m) Completion Date(1)
Development 181.2
Built-to-suit business park
Singapore 181.2 1Q 2021
development for Grab
Redevelopment 119.3
25 & 27 Ubi Road 4 Singapore 35.0 2Q 2021
iQuest@IBP Singapore 84.3 3Q 2022
Asset Enhancement Initiatives 18.1
Aperia (New) Singapore 1.2 3Q 2020
6 Apr 2020
The Galen Singapore 7.0
(in 2Q 2020)
52 & 53 Serangoon North Avenue 4 Singapore 8.5 2Q 2020
484-490 & 494-500 Great Western Highway Sydney, Australia 1.4 2Q 2020
21
(1) Based on 31 December financial year end. The financial year for 2019 is a nine-month period from 1 April 2019 to 31 December 2019 (FY2019).Asset Enhancement Initiative (New):
Aperia, Singapore
Enhancement works to the tower lift lobby
and common corridors to create a premium
look and feel
Description
Enhancement works to the common area
with the introduction of a new playground
Integrated Development Amenities and
Property Segment
Retail (IDAR)
Main Lift Lobby and Common Corridor
Net Lettable Area 70,832 sqm
Estimated Cost S$1.2 m
Completion Date 3Q 2020
Children’s playground
* Artist Impressions 22COVID-19 Updates
Nordic European Centre, Singapore
23COVID-19 Country Update
Singapore Australia
Government • “Circuit breaker” from 7 Apr to 1 Jun 2020: Workplace • Baseline restrictions expected to continue for next 4
Measures closures except for essential services, only some retail weeks (announced 16 Apr 20): travel restrictions, stay-
Implemented outlets e.g. supermarkets, can open, F&B outlets open for home measures, only essential services e.g.
takeaway/delivery only supermarkets, pharmacies opened, F&B limited to
• Property tax rebates provided for 2020: 100% for retail takeaway / home delivery
space and 30% for industrial space • Mandatory code of conduct (SMEs): landlords unable to
• For up to 6 months, landlords are not able to terminate terminate leases and to offer reductions in rent (as
leases due to COVID-19 related non-payment of rent waivers or deferrals) based on the tenant’s reduction in
trade during COVID-19, tenants to honour leases
Impact • Benefits from any reduction in property tax will be fully • Suspended rent collection from retail/F&B tenants (COVID-19 Country Update
United Kingdom United States
Government • UK Government has restricted all but essential travel as • Travel restrictions on certain countries e.g. China, Iran,
Measures part of a UK wide lockdown and only essential retailers Europe, UK etc.
Implemented are allowed to stay open (till early May 2020) • Stay-at-home guidelines to 30 Apr 2020
• Deferment of VAT payments for Mar – Jun 2020 to the • Most US states imposed certain degrees of lockdown:
end of the financial year stay-at home-orders, suspending schools & non-
• Up until 30 Jun 2020, landlords are not allowed to essential businesses and prohibiting mass gatherings
terminate leases for any missed payments. The UK • Landlords are not allowed to evict tenants due to non-
government has the option to extend this if needed. payment of rents in Portland (until 30 Jun 2020) and
Tenants will still be liable to pay rent i.e. no rent holiday San Diego (until 25 Sep 2020)
Impact • No rent rebates given to-date • No rent rebates given to-date
• Allowed some tenants to change their rental payment
from quarterly to monthly in advance, to help them with
their cashflow management
• Defer the VAT payment by one year to Mar-21.
• Extending available space for short-term leases to
targeted industries – Food, Pharmaceuticals, Medical
Outlook • 2020 GDP forecast: -6.5% (source: IMF) • 2020 GDP forecast: -5.9% (source: IMF)
• To-date, none of the tenants indicated that they intend • To-date, none of the tenants indicated that they
to pre-terminate in the near term intend to pre-terminate in the near term
• More leasing challenges expected as many interests • Majority of our tenants are operating with skeleton
have been aborted or put on hold crews serving essential functions on site, with rest of
staff working remotely
• Slowdown in leasing activity as tenants are holding
back expansion plans; trend towards shorter-term
extensions for near-term expiries 25Key Policy
New Measures Monetary Authority of Singapore (MAS) announced on 16 Apr:
• Higher aggregate leverage (gearing) limit to 50% (from 45%)
• Extension to distribute at least 90% of S-REIT’s taxable income from 3 months to 12 months
from end of FY2020 to qualify for tax transparency
Ascendas Reit
Aggregate Leverage • Healthy aggregate leverage at ~36% with available debt headroom of ~S$3.8 b (1)(2) before
reaching 50.0% aggregate leverage
Distribution Policy • Whilst Ascendas Reit has been distributing 100% of taxable Income available for distribution, its
policy is to distribute at least 90% of the taxable income
(1) Excludes the effects of FRS 116.
(2) Includes interests in JV
26Commitment to Unitholders:
Prudent Capital Management & Safeguarding Provision
Robust Financial • Healthy aggregate leverage at ~36%
Metrics • Financial metrics exceed key bank covenant thresholds
• Sufficient cashflow to meet financial and operational obligations currently
• Has reserves of S$490 m, comprising of S$290 m in cash and S$200 m in committed facilities
• Do not have any refinancing requirements in 1H2020
Strategy For prudent capital management, we will continue to be selective in:
• Acquisitions
• Asset Enhancement & Asset Transformation Initiatives/Convert-to-suit projects
27Appendix:
Portfolio Resilience
Techpoint, Singapore
28Well Diversified Portfolio
By Value of Investment Properties
Australia, 13%
United Kingdom, 6%
▪ As at 31 Mar 2020, total investment properties
United States,
stood at S$12.76 b Logistics and
Distribution Suburban 10%
Logistics and Centres
▪ Singapore portfolio: S$9.03 b Distribution Australia
Offices
Australia
Centres United 10%
▪ Australia portfolio: S$1.58 b Logistics & Kingdom
3%
Distribution 6% Business Park
▪ United Kingdom portfolio: S$0.82 b Centres US
Singapore 10%
▪ United States portfolio: S$1.33 b 9%
Integrated
Development,
Amenities &
▪ Diversified across Retail Total Investment
6%
▪ Business & Science Park/ Suburban office: 45% Properties
Light industrial
and Flatted S$12.76 b
▪ Industrial: 30% Factories Business &
7% Science Parks
▪ Logistics & Distribution Centre: 25% 32%
High-
Specifications
Industrial and
Data Centres
17%
Notes:
Multi-tenant buildings account for 71.2% of Ascendas Reit’s portfolio by asset value as at 31 Mar 2020. Singapore, 71%
Within Hi-Specs Industrial, there are 3 data centres (4.3% portfolio), of which 2 are single-tenant buildings.
Within Light Industrial, there are 2 multi-tenant flatted factories (2.6% of portfolio).
29Customers’ Industry Diversification
(By Monthly Gross Revenue)
▪ Well-diversified customer base across more than 20 industries
More than
20 industries
Note: Customers’ Industry classifications have been updated to better reflect the organisation’s primary industry sector. Previous industry classifications were based on the
30
Singapore Standard Industrial Classification (SSIC) which may be outdated due to changes in business activities.Quality and Diversified Customer Base
▪ Total customer base of around 1,490 tenants
▪ Top 10 customers (as at 31 Mar 20) account for about 17.3% of monthly portfolio gross revenue.
▪ On a portfolio basis, weighted average security deposit is about 5.0 months of rental income.
geographical location(s) of property
31Thank you
You can also read