2018 Interim Results | Analyst Briefing - 9th August 2018 - Swire ...
←
→
Page content transcription
If your browser does not render page correctly, please read the page content below
One Taikoo Place, Artist Impression

2018 Interim Results | Analyst Briefing
9th August 2018

© Swire Properties Limited
Agenda
Speakers : Guy Bradley, Chief Executive and Fanny Lung, Finance Director

1. Results Highlights
2. Financial Highlights
3. Investment Portfolio
4. Trading Portfolio
5. Financing
6. Prospects
7. Q&A
2018 Interim Results Highlights
Strong underlying earnings growth driven by better performance of our investment
properties and profits from sales of non-core properties.
Active capital recycling puts the company in a stronger financial position to pursue
growth opportunities.
Three key projects, including One Taikoo Place, scheduled for completion in 2018.
Highlights
8% y-y 34% y-y 7% h-h
Dividend per Share Underlying Profit Equity Attributable
(2018 1st interim) to Shareholders
HK$ 0.27 HK$ 6,219 M HK$ 47.01 per share
3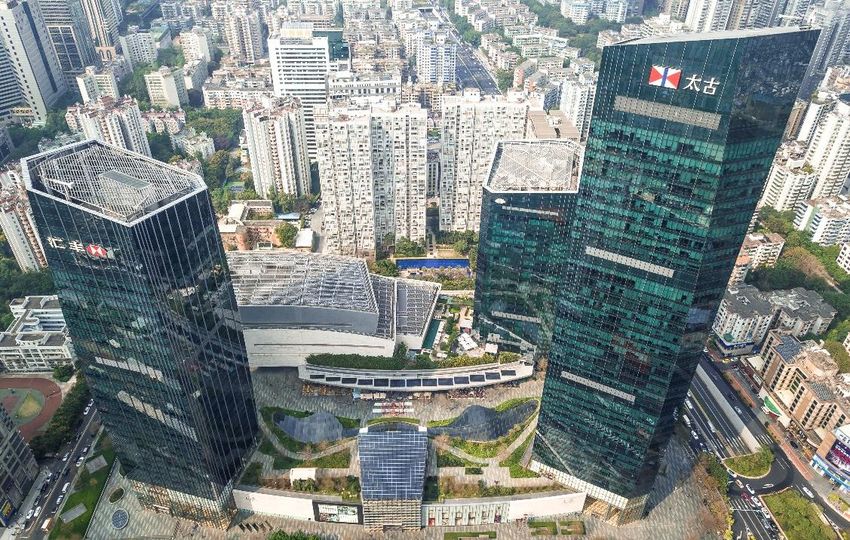
Active Capital Recycling
Conditional Sale of Our Interests in Cityplaza Three and Cityplaza Four Properties (1)
Completion expected in or before
April 2019.
Sale proceeds intended for
reinvestments.
HK $15 bn
Consideration
88%
Sales of Other Non-core(1)Properties and Property Interests in 1H 2018 (2)
occupancy
Kowloon Bay Office Building
Sale of project company
completed in June 2018.
Eredine
(38 Mount Kellett Road)
Three units sold.(3)
(1) Swire Properties Limited entered into a conditional sale and purchase agreement on 15th June 2018 for the sale of Swire
Properties Limited’s 100% interest inArtist
a subsidiary which owns the Cityplaza Three and Cityplaza Artist
Impression Four Properties.
Impression Artist Impression
(2) Profits of HK$ 2,487 M in the first half of 2018 arose from the sale of interests in an office building in Kowloon Bay and in other
4 investment properties in Hong Kong.
(3) The profit from the sale of two units was recognised in the first half of 2018 and the profit from the sale of one units is expected
to be recognised in the second half of 2018.
Building Project Pipeline
Continue to look for synergistic investment opportunities.
2018 2019 2020 2021 2022 & After
(1)
• One Taikoo Place • Beijing Sanlitun • Qiantan Project • Two Taikoo Place • Po Wah Building, 1-11 Landale
• South Island Place Yashow Building • 21-31 Wing Fung Street and 2-12 Anton Street
• Tung Chung Town Street • Wah Ha Factory Building and
(2)
Lot No. 11 Zung Fu Industrial Building
• Brickell City Centre
(Future Development)
One Taikoo Place One Taikoo Place
Artist Impression Artist Impression South Island Place Qiantan Project
Citygate Outlets Two Taikoo Place Two Taikoo Place
Artist Impression Beijing Sanlitun Yashow Building, Artist Impression Artist Impression Only Artist Impression Only
Key: Hong Kong Investment Properties PRC Investment Properties US Projects Trading Properties
(1) Two Taikoo Place is expected to be completed in 2021 or 2022.
(2) Two sites (Wah Ha Factory Building, No. 8 Shipyard Lane and Zung Fu Industrial Building, No. 1067 King’s Road) in Hong Kong
5 are intended for redevelopment for office and other commercial uses, subject to Swire Properties having successfully bid in the
compulsory sale of the sites.
Key Developments

                                                                                                                     Artist impression

Cityplaza Three/ Cityplaza Four              Kowloon Bay Office Building                      Citygate Outlets Extension
Conditionally agreed to sell for HK$15bn.    Sale of project company completed.               Topped out.        ~ 474,000 sq ft GFA

                                 June 2018                                    June 2018                                   May 2018

                                                                          Artist Impression
                                                                                                                    Artist Impression

                                                                                                                     Artist impression

The Middle House               ~ 213 rooms   Qiantan Project            ~ 1.3M sq ft GFA      One Taikoo Place       ~ 1M sq ft GFA
Officially opened.                           Acquisition of 50% interest completed.           Topped out.
                                 May 2018                                   March 2018                                January 2018

6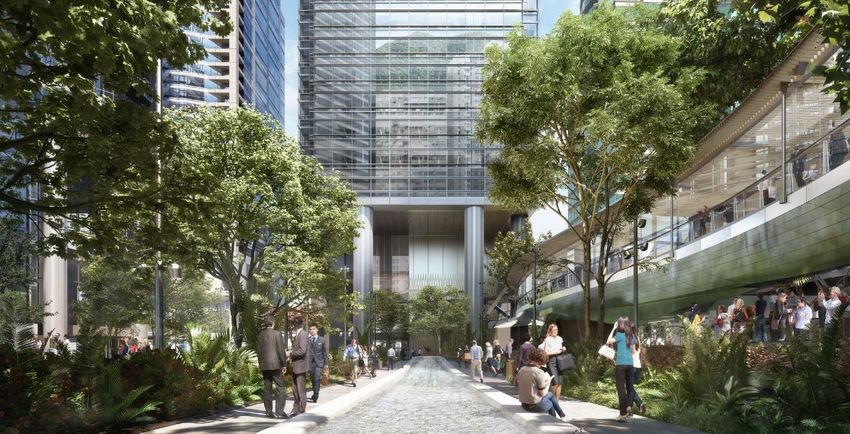
Sustainable
Financial    Development Strategies
          Highlights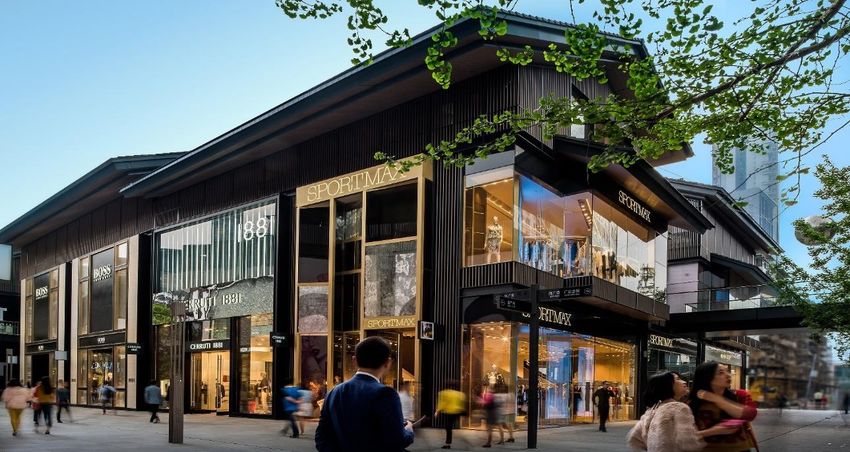
Financial Highlights
Underlying Profit Gross Rental Income Equity Attri. to Shareholders
HK$ 6,219 M 34% HK$ 5,996 M 8% HK$ 275.0 bn 7%
Adjusted
10,773 11,252
7,112 7,834
Underlying
Profit 416 512
7,112 6,219
6,219 4,304
4,616
2,487 4,616 275.0
4,628
4,628
5,996
4 5,555
276
4,624 6,053 6,124 239
257.4
3,732
2,274 2,579
225.4
3,042 3,141
2016 2017 1H 2017 1H 2018 2016 2017 1H 2017 1H 2018 Dec 2016 Dec 2017 Jun 2018
Profit on sale of investment properties –
Highlights
HK$2,487M in 1H 2018 and HK$4M in 1H 2017.
Underlying profit 34% principally reflected profits arising from the sale of our interests in an office
building in Kowloon Bay and in other investment properties in Hong Kong, partly offset by a substantial
decrease in profit from property trading.
Gross rental income 8% reflecting positive rental reversions in offices and higher retail sales.
1st interim dividend per share 8.0% to HK$0.27.
8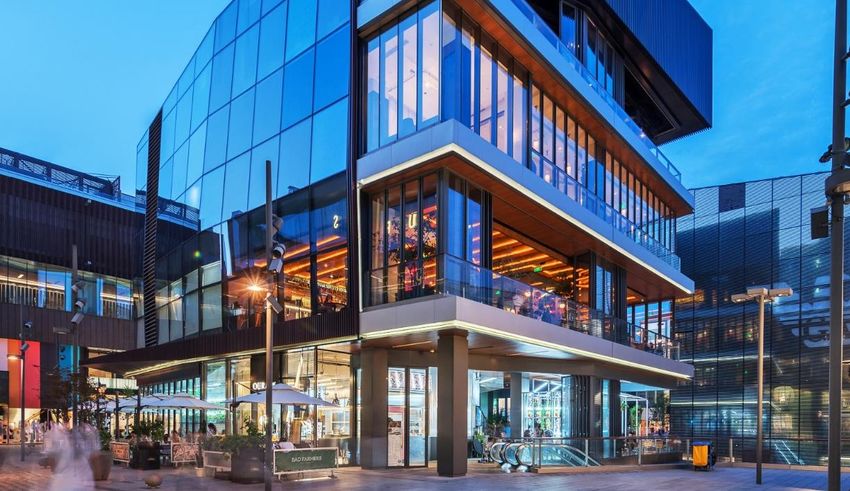
Financial Summary
    HK$M                                                                                                1H 2017          1H 2018    Change
Revenue                                                                                                   11,525            7,309      37%
Valuation gains on investment properties                                                                    9,946         15,535       56%
Operating profit                                                                                          15,537          21,309       37%
Underlying profit                                                                                           4,628           6,219      34%
Adjusted underlying profit                                                                                  4,624           3,732      19%
Reported profit                                                                                           14,763          21,205       44%
Underlying earnings per share (HK$ per share)                                                                     0.79       1.06      34%
Adjusted underlying earnings per share (HK$ per share)                                                            0.79       0.64      19%
Reported earnings per share (HK$ per share)                                                                       2.52       3.62      44%
First interim dividend per share (HK$ per share)                                                                  0.25       0.27       8%
    HK$M                                                                                              Dec 2017           Jun 2018   Change
NAV attributable to the Company’s shareholders (2)                                                      257,381          275,032        7%
Net debt                                                                                                  35,347          30,862       13%
Gearing ratio                                                                                              13.6%           11.1%    2.5%pt.
NAV per share (HK$ per share)                                                                               44.00          47.01        7%
    (1)   First interim dividend for 2018 was declared on 9th August 2018 and will be paid on 4th October 2018.
9   (2)   NAV refers to total equity attributable to the Company’s shareholders.
Movement in Underlying Profit
                  Earnings Reconciliation
 Movement in Underlying Profit
 HK$’M                                                                                       Underlying Profit by Segment
                                                                                                                     1H 2017      1H 2018   Change
                                                                                             Property investment      3,414        3,734       9%
                                  + 321         (1,200)
                                                                                             Property trading         1,221           22      98%
                  + 2,483
                                                                                             Hotels                       (11)       (24)     N/A
                                                                                             Sale of interests in           4      2,487      N/A
                                                                  (13)          6,219        investment
                                                                                             properties
                                                                                             Total                    4,628        6,219      34%

      4,628                                                                                                         HK$   6,219 M,          34%
                                                                                                                                 Underlying Profit
                                                                                                                                       (1H 2018)

     Underlying   Increase in    Increase in    Decrease in       Increase      Underlying
                  profit from    profit from    profit from    in losses from
       profit      the sale of      props      trading props       hotels         profit
      1H 2017     investment     investment                                      1H 2018
                   properties

10
Movement in Investment Properties
Movement in Investment Properties
(excl. hotels & investment properties held under JVCs)
HK$’M The increase in the valuation of
+ 2,910 (304) + 15,535 270,473 the investment property
(14,577)
267,292 (383) portfolio is mainly due to an
increase in the valuation of the
office properties in Hong Kong
arising from rental increases,
together with a reduction of 12.5
basis points in the capitalisation
rate for Hong Kong office
properties, partially offset by the
removal from the valuation of
our interests in the Cityplaza
Three and Cityplaza Four
properties.
Translation Net capital Disposals Net Net fair value
HK$ 270,473 M 1%
31st Dec 30th Jun
differences expenditure transfers gains Investment Props Valuation
2017 2018
(1H 2018)
11SustainablePortfolio Investment Development Strategies
Rental Income – Growth from All Segments
HK Office 10,320
2% Attributable Gross Rental Income (1)
Higher rental income driven by positive HK$’M
rental reversions and close to 100% HK$ 6,868 M , 11%
occupancy.
Strong demand for office space.
12,639
HK Retail 4% 11,729
Rental income grew 10% at Cityplaza and
was stable at The Mall at Pacific Place.
Effectively fully let.
6,868
6,182
PRC Props 30% + 29%
Positive rental reversions. + 30%
Higher retail sales.
+ 4%
In RMB terms, this also represents a rental
growth of 20%.
+ 2%
Others 29%
2016 2017 1H 2017 1H 2018
Rental contributions ramped up at Brickell
City Centre in Miami.
(1) Reported gross rental income (excluding rental contributions from JVCs and associates) was HK$ 2,887 M for Hong Kong
13 office portfolio, HK$ 1,367 M for Hong Kong retail portfolio and HK$ 1,302 M for investment properties in Mainland China.HK Office – Good Momentum across Portfolio
Pacific Place One Island East TKP office towers
GFA (M sq ft) 2.2 GFA (M sq ft) 1.5 3.1
Occupancy 100% Occupancy 100% 100%
Rental Reversion (1) +25% Rental Reversion (1) +7% +5%
Cityplaza (2)
Hong Kong Island
Latest Rentals (HK$ psf)
One/Two Pacific Place 130 – 155
Three Pacific Place 110 – 115
(2)
Cityplaza (2)
Taikoo Place
mid 40s to high 40s
low 40s to mid 50s
HK$ 147.8 bn, 1% GFA (M sq ft)
Occupancy
0.6
99%
(Vs. Dec 2017)
One Island East mid 50s to low 70s Attributable Valuation Rental Reversion (1) +6%
(1) Reversion is the percentage change in rent on lease renewals, entry into new leases and rent reviews.
14 (2) Excluding Cityplaza Three and Cityplaza Four. Swire Properties Limited entered into a conditional sale and purchase agreement
on 15th June 2018 for the sale of Swire Properties Limited’s 100% interest in a subsidiary which owns the Cityplaza Three and
Cityplaza Four Properties.HK Retail – Encouraging Retail Sales Growth
The Mall, Pacific Place Cityplaza Citygate Outlets
GFA (M sq ft) 0.7 1.1 0.5
Occupancy 100% 100% 100%
Retail Sales Growth + 21.7% + 6.3% +9.3% (1)
HK$ 47.8 bn, 2%
(Vs. Dec 2017)
Attributable Valuation
15 (1) Excluding area closed for renovation and upgrading works during the first two quarters.HK Portfolio – Tenant Mix and Lease Expiries
Lease Expiry Profile (1)(2)
HK Office
HK Retail Strong and diverse tenant base.
Well-spread lease expiry profile.
Top 10 office tenants occupied approx. 23% of office area in HK.
Top 10 retail tenants occupied approx. 25% of retail area in HK.
(1) At 30th June 2018.
16 (2) Based on the percentage of the total rental income attributable to the Group for the month ended 30th June 2018.One Taikoo Place – High Leasing Pre-commitment Achieved
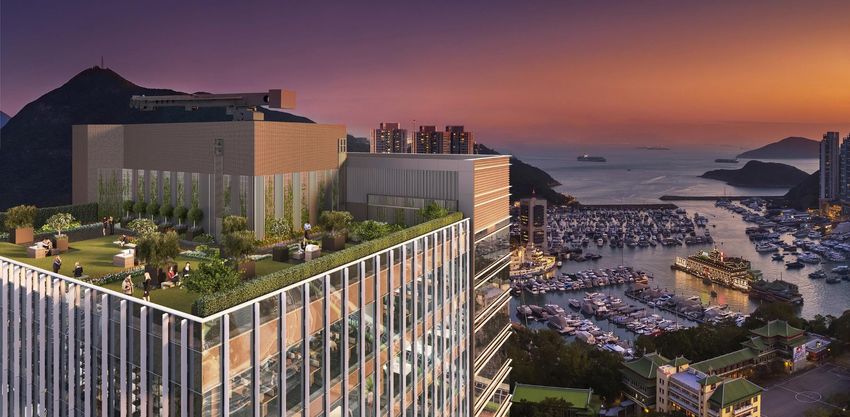
One Taikoo Place
88% occupancy (1)
100% occupancy
90% of space committed
(1) (1)
Over
~1,020,000 sq ft GFA.
Interior finishing works in progress.
Expected completion in late 2018.
Office tenants include:
Baker McKenzie MetLife Asia
EY Simmons & Simmons
Facebook The Great Room
Interpublic Group Veolia
Kering
Artist Impression Artist Impression Artist Impression
17 Artist Impression
(1) Taking into account letters of intent.Hong Kong Investment Properties To Be Completed in 2018
South Island Place
50% owned office
building.
Interior finishing works
in progress.
~ 382,500 sq ft GFA (1) Artist Impression
Tung Chung Town Lot No. 11
20% owned commercial
building with retail and
hotel GFA.
Fitting out works in
progress.
Retail portion expected
to open in 1Q 2019.
~ 474,000 sq ft GFA (1) Artist Impression
Artist Impression
Artist Impression
18
(1) GFA based on 100% basis.Continuing Transformation of Core Hubs in Hong Kong
Hong Kong investment properties pipeline beyond 2018.
Taikoo Place Two Taikoo Place
Location Quarry Bay
Interest 100%
GFA (100% basis) ~1,000,000 sq ft
Components Office
Status Foundation works in progress.
Expected
Completion 2021/2022
Pacific Place Po Wah Building, 1-11 Landale Street
and 2-12 Anton Street
Po Wah Building, Three One
1-11 Landale Street Pacific Pacific Location Wanchai
and 2-12 Anton Place Place
Street
28
Interest 100%
Hennessy
Road
GFA (100% basis) TBD
Two
Pacific
Place
Components TBD
Status Redevelopment under planning.
Expected
After 2022
Generali Completion
Tower
Artist Impression
(1) Only office components labeled above.
In February 2018, Swire Properties submitted compulsory sale applications in respect of two sites (Wah Ha Factory Building, No. 8
19 Shipyard Lane and Zung Fu Industrial Building, No. 1067 King’s Road) in Hong Kong, which are intended for redevelopment for office
and other commercial uses, subject to Swire Properties having successfully bid in the compulsory sale of the sites.
Site location for illustrative purpose only.Hong Kong Portfolio – Well-positioned for Growth
Expected Attributable GFA of Completed Property Portfolio in Hong Kong (1)(2) Under Planning
GFA (‘000 sq ft) Po Wah Building, 1-11
Landale Street and 2-12
Anton Street
12%
Site area: ~14,400 sq ft
Redevelopment under planning.
14,381
Other
Wah Ha Factory Building and
13,377 13,377 13,377 Zung Fu Industrial Building
12,847 Site area: ~27,000 /~25,000 sq ft
Compulsory sale applications in
respect of two sites submitted in
February 2018.
14.4 M sq ft
Exp. Attributable
Completed GFA (1)
(Investment Props)
2017 2018F 2019F 2020F 2021F &
onwards (3)
(1) Includes GFA of the hotels and excludes the site (Po Wah Building, 1-11 Landale Street and 2-12 Anton Street) redevelopment
of which is under planning. Also excludes two sites (Wah Ha Factory Building and Zung Fu Industrial Building) which are under
20 compulsory sale applications.
(2) At 30th June 2018.
(3) Two Taikoo Place is expected to be completed in 2021 or 2022.Mainland China Portfolio – Strong Rental Growth
Attributable Gross Rental Income (1) Retail Tenant Mix (2)
HK$’M
Almost tripled
HK$1,995 M, 30%
since 2012 (3) RMB 1,622 M, 20% Others
3,311 19.8%
Food &
2,614 Beverages
2,463 26.9%
Cinemas
2,153 4.9%
1,995 PRC Retail
1,751
1,457 Supermarkets Jewellery &
5.5% Watches
2.3%
Fashion &
Accessories
40.6%
2012 2013 2014 2015 2016 2017 2018
Rental income from Mainland China is underpinned by a retail portfolio with a diverse tenant mix.
(1) Reported gross rental income (excluding rental contributions from JVCs and associates) was HK$ 1,302 M.
(2) As at 30th June 2018.
21 (3) Comparing attributable gross rental income from the first half of 2018 to that from the first half of 2012.Mainland China – Fruitful Results from Earlier Investments
Mainland China Portfolio (1)
Taikoo Li Sanlitun
Retail Sales Occupancy
5 projects +9.7% 97%
Retail
Year of Opening : 2008/2010
completed INDIGO
Retail Sales Occupancy
+6.1% 100% 99%
Retail Office
Year of Opening : 2011/2012
HKRI Taikoo Hui
Beijing Retail Sales Occupancy (4)
N/A 96% 91%
Retail Office
Shanghai
Year of Opening : 2016/2017
Chengdu Sino-Ocean Taikoo Li
Retail Sales Occupancy
+28.7% 96%
Guangzhou Retail
Year of Opening : 2014
TaiKoo Hui Retail Sales Occupancy
+11.8% 98% 100%
Retail Office
Year of Opening : 2011
(1) Excluding Pinnacle One which was developed for trading purposes and Qiantan project.
22 (2) Retail sales growth quoted in RMB.
(3) Occupancy at 30th June 2018.
(4) Taking into account letters of intent.The Middle House, Shanghai – Opened Opened in May 2018 111 hotel rooms 102 serviced apartments 23
Mainland China Project Pipeline
Attributable GFA of PRC Completed Property Portfolio (1)(2) Qiantan Project, Shanghai
HK$ 49.3 bn 9.4 M sq ft
Attributable Valuation Exp. Attributable
(Investment Props) Completed GFA (1)
(Investment Props)
GFA Shanghai
(‘000 sq ft)
9,395
8,772
50% owned retail project.
Construction in progress.
Chengdu
Expected completion in 2020.
~ 1,250,000 sq ft GFA (3)
Beijing Sanlitun Yashow Building
Artist Impression
Jun 2018 2020F & Onwards
Refurbishment as an extension to Taikoo Li
Sanlitun.
Expected completion in 2019.
~ 296,000 sq ft GFA
24 (1) Includes GFA of the hotel but excludes GFA of car parks at these projects as at 30th June 2018.
(2) Excludes Pinnacle One, which was developed for trading purposes, and Beijing Sanlitun Yashow Building.
(3) GFA on 100% basis.Brickell City Centre, Miami
Brickell City Centre
89% occupancy (1)(2)
Shanghai
Shopping Centre 80% of shops opened (1)
Chengdu
100% occupancy (1)
Office
Retail Tenants Office Tenants
Saks Fifth Avenue WeWork
Apple Akerman
CMX The VIP Cinema McKinsey&Company
La Centrale Italian Food Hall Bloomberg
Zara KPMG
Interaudi Bank
(1) As at 30th June 2018.
25 (2) Taking into account letters of intent.Sustainable
Trading Development Strategies
PortfolioTrading Portfolio
Hong Kong
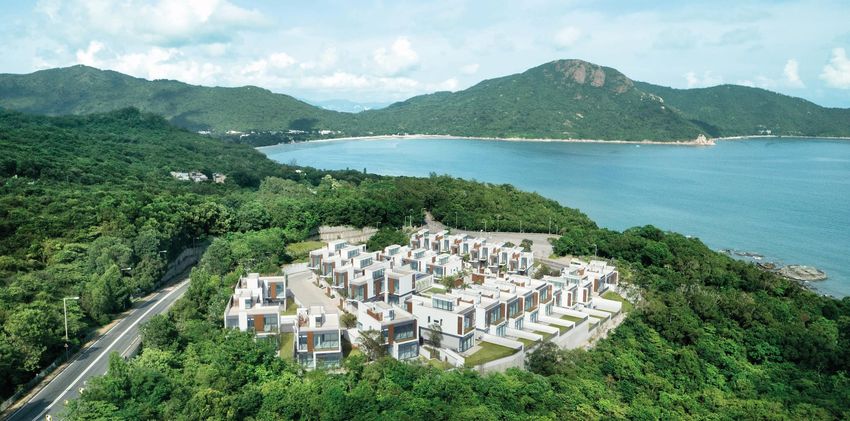
WHITESANDS HK$20,610 psf 21-31 Wing Fung Street ~ 29,928 sq ft GFA (3)
All Sold or 28 houses sold (avg price) (2) Redevelopment under planning.
Profit from the sale of 6 houses expected to be recognised in 2H 2018. Expected to be completed in 2021.
Artist Impression
Brickell City Centre, Miami
Artist Impression
Artist Impression
Artist Impression
REACH mid US$600s psf RISE high US$600s psf
~ 93% or 363 units sold (1) (avg price) (2) ~ 58% or 227 units sold (1) (avg price) (2)
Profit from the sale of 3 units expected to be recognised in 2H 2018. Profit from the sale of 14 units expected to be recognised in 2H 2018.
27 (1) At 7th August 2018.
(2) Average selling price is based on saleable area.
(3) Excluding a retail podium of ~ 4,200 sq ft which will be retained for investment purposes.Sustainable Development Strategies Financing
Net Debt and Gearing
 Net Debt Reconciliation (HK$M)                                                                                           Gearing
 Net debt at 31st Dec 2017                                                                        (35,347)
 Net rental and fee receipts                                                                        4,818
                                                                                                                   37,055             33,474
 Proceeds from property trading / development                                                         674
 Capex – PP&E and property investment                                                              (2,657)
 Development costs – property trading                                                                (113)
 Net proceeds after development cost for NKIL 6312(1) and others                                    8,124
 Net investments in JVCs and Associate                                                             (2,090)
 Dividends from JVCs and Associate                                                                     45
 Net interest paid                                                                                   (533)
 Tax paid                                                                                            (358)
 Dividends paid to the Company’s shareholders                                                      (3,042)          Dec 2017           Jun 2018
 Other operating items                                                                               (383)
 Net debt at 30th Jun 2018                                                                        (30,862)

 Financial Ratios (2)                          2014           2015           2016       2017      Jun 2018
 Total Equity (HK$ M)                         208,547        217,949        227,225     259,378   277,061                      Highlights
 Net Debt (HK$ M)                              34,071          33,348         35,377     35,347     30,862
 Gearing                                        16.3%           15.3%          15.6%     13.6%      11.1%    HK$   30,862 M            11.1%
 Underlying Interest Cover (X)                      7.6            7.8            8.9      10.7       14.1   Net Debt                  Gearing
 Underlying Cash Interest Cover (X)                 5.6            5.9            6.3       7.5       11.2

29
     (1) NKIL 6312 refers to New Kowloon Inland Lot 6312.
     (2) Financial ratios as at respective December year-ends except for June 2018.
Maturity Profile & Liquidity
Maturity Profile of Available Committed Facilities (at 30th June 2018) HK$M Dec 2017 Jun 2018
Total 45,547 3,457 3,391 5,623 7,550 11,848 700 1,100 1,940 4,624 1,390 3,924 Cash 1,708 2,612
Drawn 33,431 3,457 1,150 4,823 2,825 7,998 200 1,100 1,940 4,624 1,390 3,924 Undrawn - committed 10,561 12,116
12,269 14,728
Undrawn - uncommitted 804 875
13,073 15,603
HK$’M
Currency
Profile
Major financing activities in 1H 2018: Fixed : Floating Available Committed Facilities
➢ Repayment of inter-company loan of HK$ 4,232 M to Swire 45,547 M
Pacific.
72% : 28% HK$
➢ Prepayment of term loan facilities and repayment of revolving Cash & Undrawn
Credit Rating
loan facilities totaling HK$ 2,600 M and RMB 648 M. Committed Facilities
Fitch “A”
➢ Issue of first green bond in January 2018, raising US$ 500 M for
10 years at a coupon rate of 3.5%.
Moody’s “A2” HK$ 14,728 M
30Capital Commitments
Profile of Capital Commitments for Investment Properties and Hotels – at 30th June 2018
HK$’M Expenditure Forecast Year of Expenditure Commitments*
Six months Six months 2019 2020 2021 & later At 30th Jun 2018
ended ended
30th Jun 2018 31st Dec 2018
Hong Kong 3,209 1,778 1,542 4,421 8,452 16,193
Mainland China 2,034 774 1,066 415 68 2,323
U.S.A. and elsewhere 84 114 273 25 20 432
Total 5,327 2,666 2,881 4,861 8,540 18,948
* The capital commitments represent the Group’s capital commitments of HK$ 17,036 M plus the Group’s share of the capital commitments of
joint venture companies of HK$ 1,912 M. The Group is committed to funding HK$ 135 M of the capital commitments of joint venture
companies.
31Increased Capital Commitments
Movement in Capital Commitments Historical Profile of Capital Commitments (1)
HK$’M HK$’M
29,454
+ 8,651 (3,876)
24,140
(27) 18,948 19,798
18,328
18,948
432
15,914 2,323
14,200
14,200 477
1,553
16,193
12,170
New Commitments Other Dec-12 Dec-13 Dec-14 Dec-15 Dec-16 Dec-17 Jun-18
Capital commitments fulfilled movements
Capital
commitments commitments
Dec 2017 Jun 2018 HK Mainland China Other
New commitments principally arise from the Qiantan project in Shanghai and the redevelopment of
two sites (2) in Quarry Bay in Hong Kong.
(1) For investment properties and hotels as at period ends.
32 (2) Wah Ha Factory Building and Zung Fu Industrial Building which are under compulsory sale applications.Sustainable Development Strategies Prospects
Prospects
Hong Kong
High occupancy is expected to result in upward pressure on office rents at Pacific Place and resilience in office rents in our Taikoo
Place development.
Improved market sentiment and a better tenant mix should support stable sales growth at our retail malls.
Rental demand for our residential investment properties is expected to be stable in the second half of 2018.
Mainland China
Retail sales are expected to grow satisfactorily in Chengdu, steadily in Guangzhou and Beijing and modestly in Shanghai in the
second half of 2018.
Demand for retail space for lifestyle brands and food and beverage outlets is expected to be solid. Demand for luxury goods has
improved in Beijing and is strong in Guangzhou and Chengdu.
Demand for office space in Guangzhou, Beijing and the Jingan District of Shanghai is expected to underpin rentals in the second
half of 2018, despite new supply.
Miami, U.S.A.
There is too much retail space available for rent and weak retail sales have made some retailers cautious about expansion.
New supply of Grade-A office space is limited and demand is firm.
Weak South American economies and the relative strength of the US dollar are expected to continue to affect demand for
condominiums from South American buyers.
Across Regions - Hotels
Trading conditions for our existing hotels are expected to be stable in the second half of 2018.
The two new hotels in Shanghai are building up their occupancy.
34Sustainable Development (SD) 2030 Strategy: 1H2018 Highlights
Progress Progress
Safety, Health and Launched Employee Wellness Programme 2018 Suppliers No high risk suppliers identified from the
Wellbeing which comprises of sponsorship fund for annual supplier risk assessment1
interest clubs, photo campaign, luncheon talks
and workshops Enhanced the Tenants’ Fit-out and
Tenants
Renovation Guide to incorporate new
Diversity and Launched the Diversity elements such as Green Kitchen Technical
Inclusion and Inclusion Policy Guidelines for F&B tenants
Introduced the SPL-driven Green Kitchen
Award Scheme to tenants
• Topping out of One Taikoo Place
• Built to the highest sustainability
standard: LEED Platinum, BEAM
Plus Platinum and WELL Platinum
Progress Progress
HK Portfolio Mainland China Portfolio
Climate Change Launched the Climate Change Policy Green Financing Issued first green bond
US$500M coupon rate of 3.5%
Energy Energy consumption2 Disclosure and
↓ 52M kWh/year ↓17M kWh/year Reporting
↓ 22% ↓20%
Waste Commercial waste Waste recycling rate
diversion rate
21% 26%
Building/Asset 35 buildings with BEAM/BEAM Plus certification
Investment 30 buildings with LEED certification
Note
35 1 Assessment has been conducted for the 20 largest suppliers accounting for the majority of our procurement budget in 2017.
2 HK portfolio: compared to the business-as-usual (“BAU”) baseline level in 2008; Mainland China portfolio: compared to the BAU
baseline level in the first year for which a complete calendar year of data was available for projects in Mainland China portfolio.QSustainable &A Development Strategies
Appendix
Key Business Strategies

     1
                 Continue to create long-term value by conceiving, designing, developing, owning and managing
                 transformational mixed-use and other projects in urban areas.

         2
                    Maximise the earnings and value of our completed properties through active asset management
                    and by reinforcing our assets through enhancement, redevelopment and new additions.

             3
                      Continue with our luxury residential property activities.

             4
                    Remain focused principally on Hong Kong and Mainland China.

         5
                 Manage our capital base conservatively.

38
Property Portfolio
Investment Props / Hotels Office Retail Hotels(2) Resid./Serviced Under Total Attributable Investment Props by
Attributable GFA (M sq ft)(1) apartments Planning Region (GFA M sq ft)
Completed
10%
Hong Kong 8.3 (3) 2.5 0.7 0.6 - 12.1
U.S.A. and
Mainland China 2.9 4.5 1.2 0.2 - 8.8 Elsewhere
2.7
U.S.A. 0.3 0.3 0.5 0.1 - 1.2
Sub-Total (A) 11.5 7.3 2.4 0.9 - 22.1
Under Development or Held for Future Development
Mainland
China
9.4
26.5 Hong
Kong
14.4
Hong Kong 2.2 0.1 - - - 2.3 M sq ft
36% 54%
Mainland China - 0.6 - - - 0.6
U.S.A. and elsewhere - - - 0.1 1.4 1.5
Sub-Total (B) 2.2 0.7 - 0.1 1.4 4.4
TOTAL = (A) + (B) 13.7 8.0 2.4 1.0 1.4 26.5
Trading Props Completed Prop Held Under Development / Total Attri. Investment Attri. Trading
Attributable GFA for Sale Held for Development Portfolio Portfolio
(M sq ft)
26.5 M sq ft 2.5 M sq ft
Hong Kong (4) - - -
Mainland China 0.3 - 0.3 Total Attri. Property Portfolio
U.S.A. 0.3 1.9 2.2 29.0 M sq ft
Total 0.6 1.9 2.5
(1) Excludes GFA of car parks. Also excludes GFA of a site (Po Wah Building, 1-11 Landale Street and 2-12 Anton
Street) and two sites (Wah Ha Factory Building and Zung Fu Industrial Building).
(2) Hotels are accounted for under property, plant and equipment in the financial statements.
(3) The remainder of Cityplaza Three and the whole of Cityplaza Four (the immediate holding company of a wholly-
owned property holding subsidiary owning such remainder and such whole having been conditionally agreed to
39 be sold in June 2018) are excluded.
(4) The aggregate GFA in Hong Kong is less than 0.1M.
(5) As at 30th June 2018.Completed Investment Portfolio
Expected Attributable GFA of Completed Investment Portfolio (incl. Hotels) (1)(2)(3)
GFA
(‘000 sq ft)
22,486 23,313 23,390 24,013 25,017 25,017 25,017 26,461
Tung Chung
(TCTL 11) (20%)
South Island Place (50%) One Brickell City Centre (4)
One Taikoo Place Two Taikoo Place (3)
HKRI Taikoo Hui, Qiantan 21-31 Wing Fung
Shanghai (50%) Project (50%) Street - Retail
- Hotels & SA
(1) Hotels are accounted for under property, plant and equipment in the financial statements.
(2) Excludes GFA of property trading components, a site (Po Wah Building, 1-11 Landale Street and 2-12 Anton Street) , two
sites (Wah Ha Factory Building, No. 8 Shipyard Lane and Zung Fu Industrial Building, No. 1067 King’s Road), and car parks
but includes GFA of the hotel portion of these projects.
40 (3) Two Taikoo Place is expected to be completed in 2021 or 2022.
(4) Development under planning.Revenue Analysis
1H 2018 Revenue Breakdown by Segment 1H 2018 Revenue Breakdown by Region
HK$’M HK$’M
7,309 7,309
HK$’M HK$’M
Comparison Comparison
1H 2017 1H 2018 1H 2017 1H 2018
Rental 5,555 5,996 HK 9,759 5,339
Trading 5,258 530 Mainland China 1,244 1,473
Hotels 651 720 U.S.A. 522 497
Others 61 63 Total 11,525 7,309
Total 11,525 7,309
The turnover decreased by 37% principally due to lower revenue from the sale of residential
units in Hong Kong, offset by higher revenue from China. HK$ 7,309 M, 37%
Revenue
(1H 2018)
41HK Portfolio Map
Pacific Place Taikoo Place Cityplaza
(1) The simplified maps are not to scale and are for illustrative purpose only.
42 (2) GFA figures are for reference only.Taikoo Li Sanlitun, Beijing
Retail Sales Occupancy (1)
+9.7% 97% Gross rental income at Taikoo Li Sanlitun in Beijing increased Project Summary (100% Basis)
in the first half of 2018.
Retail GFA 1.47 M sq ft
Demand for retail space in Taikoo Li Sanlitun remains solid as
Components TKL Sanlitun South
it reinforces its position as a fashionable retail destination in TKL Sanlitun North
Beijing. Improvement works are being carried out and are The Opposite House
expected to have a positive impact on occupancy and rents.
Interest Retail : 100%
The refurbishment of the Beijing Sanlitun Yashow Building as TOH : 100%
an extension to Taikoo Li Sanlitun (with a GFA of 296,000
Yr of Opening 2008 (TKL South)
square feet) is expected to be completed in 2019.
2008 (TOH)
Retail sales are expected to grow steadily in Beijing in the 2010 (TKL North)
second half of 2018. Demand for luxury goods has improved
in Beijing.
43 (1) Occupancy as at 30th June 2018.TaiKoo Hui, Guangzhou
Retail Sales Occupancy (1)
Gross rental income at TaiKoo Hui in Guangzhou increased in Project Summary (100% Basis)
+11.8% 98% the first half of 2018, reflecting in part improvements to the
Retail
GFA 3.84 M sq ft
tenant mix and a customer loyalty programme.
Components Shopping Mall
100% Retail sales are expected to grow steadily in Guangzhou in 2 Office Towers
Office the second half of 2018. Demand for luxury goods is strong Mandarin Oriental GZ
Guangzhou. Retail rents are expected to grow satisfactorily
despite an increase in the availability of competing space. Interest 97%
There has been limited new supply of office space in the core Yr of Opening 2011 / 2012 / 2013
areas of Guangzhou and there is strong demand from
existing office tenants to expand or upgrade their
accommodation. Vacancy rates have declined. Despite the
availability of new office space in Guangzhou in the second
half of 2018, rentals are expected to be resilient.
44 (1) Occupancy as at 30th June 2018.INDIGO, Beijing
Retail Sales Occupancy (1)
+6.1% 100% Improvements to the tenant mix have been made. The mall Project Summary (100% Basis)
is becoming a significant quality family shopping centre in GFA 1.89 M sq ft
Retail
north-east Beijing.
Components Shopping Mall
99% Demand for office space in Beijing is expected to underpin
ONE INDIGO
Office rentals in the second half of 2018, despite new supply. EAST, Beijing
Interest 50%
Yr of Opening 2011 / 2012
(1) Occupancy as at 30th June 2018.
45Sino-Ocean Taikoo Li Chengdu
Artist’s Impression
Artist’s Impression
Artist’s Impression
Artist’s
Artist’s
Impression
Impression
Artist’s Impression Artist’s Impression
Retail Sales Occupancy (1)
Artist’s Impression
Sino-Ocean Taikoo Li Chengdu is our second Taikoo Li Project Summary (100% Basis)
+28.7% 96%
project in Mainland China and it is gaining popularity as a GFA 2.21 M sq ft
Retail downtown shopping destination in Chengdu.
Components Retail
Gross rental income at Sino-Ocean Taikoo Li Chengdu
Office (for trading)
increased in the first half of 2018.
The Temple House
Retail sales are expected to grow satisfactorily in Chengdu Serviced Apartments
in the second half of 2018. Demand for luxury goods is
Interest 50%
strong in Chengdu. Retail rents are expected to grow
moderately despite an increase in the availability of Yr of Opening 2014 / 2015
competing space.
46 (1) Occupancy as at 30th June 2018.HKRI Taikoo Hui, Shanghai
Artist Impression Artist’s Impression
Occupancy (1)
HKRI Taikoo Hui is our second Taikoo Hui project in Mainland Project Summary (100% Basis)
96% 91%
China. The shopping mall officially opened in November 2017.
Retail Office GFA 3.47 M sq ft
Gross rental income at HKRI Taikoo Hui increased in the first
half of 2018 as more shops were open than in the first half of Components Retail Mall
2017. At 30th June 2018, 90% of the shops were open. 2 Office Towers
2 Hotels
Retail sales and the number of visitors have grown steadily
Serv Apmt Tower
since the opening in May 2017.
Retail rents are expected to grow moderately in Shanghai in Interest 50%
the second half of 2018 despite an increase in the availability Yr of Opening 2016 / 2017 / 2018
of competing space. Demand for office space in the Jingan
District of Shanghai is expected to underpin rentals in the
second half of 2018, despite new supply.
47 (1) Occupancy (including by way of letters of intent) as at 30th June 2018.Brickell City Centre, Miami
RISE REACH
Artist Impression
Artist Impression
Artist Impression
Artist Impression
Occupancy (1)
The first phase of the Brickell City Centre development was Project Summary (100% Basis)
89% 100%
completed in 2016, and its components opened between
Retail Office GFA 1.39 M sq ft (BCC)
March 2016 and February 2017. 1.97 M sq ft (OBCC & Others)
Joint venture with Bal Harbour Shops (15.75%) and Simon
Components Retail
Property Group (25%) for the shopping centre of BCC.
2 Office Buildings
Swire Properties holds 59.25% interest. EAST Miami (w Serv Apmt)
In Miami, there is too much retail space available for rent 2 Condo Towers (REACH / RISE)
and weak retail sales have made some retailers cautious One BCC and a Condo Tower
about expansion. New supply of Grade-A office space is Interest Retail: 59.25%
limited and demand is firm. Others: 100%
Yr of Opening 2016 (BCC)
TBC (OBCC & others)
48 (1) Occupancy (including by way of letters of intent) as at 30th June 2018.Trading Portfolio
Trading Properties Sold or Being Total Units/ Actual Actual Units/Houses for which Profit Interest
Sold Units/ Houses Completion Handover Recognised or
(At 7th August 2018) Houses Sold (from) Expected to be Recognised (Year)
Hong Kong
- 1(2015), 1(2016), 14(2017), 6(1H2018)
WHITESANDS, Lantau 28 28 2015 2015 100%
and 6(2H2018) (1)
Miami, Florida, U.S.A.
- 347(2016), 12(2017), 1(1H2018) and
REACH, Brickell City Centre 390 363 2016 2016 100%
3(2H2018) (1)
- 171(2016), 28(2017) ,14(1H 2018) and
RISE, Brickell City Centre 390 227 2016 2016 100%
14(2H 2018) (1)
49 (1) The profit from the sale of these units/houses is expected to be recognised in 2H 2018.
(2) Excluding 21-31 Wing Fung Street in Hong Kong which is under planning and is expected to be completed in 2021.Hotel Portfolio
Managed Hotels No. of Rooms Interest Owned but Non-managed Hotels No. of Rooms Interest
Completed (100% basis) Completed (100% basis)
Hong Kong The Upper House 117 100% Hong Kong Island Shangri-La HK 565 20%
EAST, Hong Kong 345 100% JW Marriott Hotel HK 602 20%
(1)
Headland Hotel 501 0% Conrad HK 513 20%
Mainland China The Opposite House, Beijing 99 100% Novotel Citygate HK 440 20%
(3)
EAST, Beijing 369 50% Mainland China Mandarin Oriental, Guangzhou 287 97%
(2)
The Temple House, Chengdu 142 50% U.S.A. Mandarin Oriental, Miami 326 75%
(2) 213 50% Mainland China The Sukhothai, Shanghai 201 50%
The Middle House, Shanghai
U.S.A. (3) 352 100%
EAST, Miami
Sub-Total (A) 2,138 Sub-Total (B) 2,934
Under Development
Hong Kong Hotel at Tung Chung Town Lot No. 11 206 20%
Sub-Total (C) 206
Total (A) 2,138 Total = (B) + (C) 3,140
Total Managed Rooms
EAST Miami The Temple House The Middle House
2,138
EAST, Miami
(1) Headland Hotel is owned by Airline Property Limited, a wholly-owned subsidiary of Cathay Pacific Airways Limited.
50 (2) Comprising one hotel tower and one serviced apartment tower.
(3) Including serviced apartments in a hotel tower.Valuation of Completed Investment Properties
Consistent value creation through continuous property investment and asset reinforcement.
2007 – Jun 2018 Valuation of Completed Investment Properties (excl. Hotels) *
HK$ M
Valuation of investment
properties portfolio more
270,473
than doubled in 11 years 267,292
235,101
* Per June 2018 financial statements on accounting basis. Hotels are accounted for under property, plant and equipment in the financial statements.
Valuation after 2010 does not include Festival Walk, which was sold in August 2011 for HK$ 18.8 bn.
51 Valuation as of June 2018 excludes Cityplaza Three and Cityplaza Four. Swire Properties Limited entered into a conditional
sale and purchase agreement on 15th June 2018 for the sale of Swire Properties Limited’s 100% interest in a subsidiary which owns the
Cityplaza Three and Cityplaza Four Properties.You can also read