Emerging markets: the new consumer superpowers - Presentation Leon Svejgaard Pedersen 15th March 2011

Page created by Wayne Stevens
 
CONTINUE READING
Emerging markets: the new consumer superpowers - Presentation Leon Svejgaard Pedersen 15th March 2011
Emerging markets: the new consumer
superpowers

                      Presentation
                      Leon Svejgaard Pedersen
                      15th March 2011
Investment thesis

      The Nordea 1 – Emerging Consumer Fund captures one of the
      strongest and most sustainable trends in the coming decades,
      the migration from rural areas to cities in the world’s emerging
      economies, a trend that we believe is highly unaffected by short-to-
      medium term cycles

2
Urbanisation

    •       The urban population is expected to rise to 4.9 billion people, or to 60% of total global
            population by 2030 according to UN
    •       Urban growth will be particularly notable in Asia and Africa, where the UN estimates
            the urban population will double between 2000 and 2030
    •       70-80 million people are entering the middle class per year in the emerging economies

                                               Urban population by region

3       Source: UN Population Division, 2009
Spending Power

    •      The consumers come to the cities with no debts, and their first wages have an
           immediate impact on their spending patterns
    •      Urbanisation is leading to:
               • Higher disposable incomes
               • Different spending patterns
    •      Along with the increased power to spend comes willingness to do so
                      thousands of USD
                                                          BRIC’s income per capita expected to continue to rise

4       Source: Goldman Sachs Global ECS Research, 2007
Discretionary spending

    •      As income level increases spending becomes more discretionary
    •      Trend accelerates, as it is supported by consumer financing
                                                  Consumption will become more discretionary
                                                      Share of consumption directed to major categories,
                                                          averages of countries in each wealth band

5       Source: National Accounts, World Bank, 2009
Emerging Consumer framework

     Richemont
                        LVMH                                                         Luxury
      Swatch
                                        50 million

                                                      Jet Airways        Ctrip
                                                                                     Travel
     Suzuki Motor                                            BYD
                                                                   China Lilang
                                        300 million     Li Ning                     Aspiration

      Adidas                                          Yes Bank China Taiping
                                                      HDFC      Banco Std. Brasil   Consumer
                                                                                     Finance
    Reckitt B.      P&G
                 Nestle                                  Wal-Mart de Mexico
                                        500 million                                 New Urban
    Colgate                                            Tingyi
                                                                                    Consumer
                                                                   Want Want
    Coca-Cola
                                                         Ruinian International
                                        1.5 billion

              Local companies
              International companies
6
Multinational companies
    Substantial exposure to the Emerging Consumer
    Both local and multinational companies will benefit from the increase in consumption in
    emerging markets

        Current developed                                           Part ofofrevenue
                                                                      Part             andEBIT
                                                                              revenue and   EBIT   coming
                                                                                               coming from from
        markets holdings                                                        Emerging    Markets
                                                                                 Emerging M arkets
           Emerging market exposure 2009
              Company                 %                       60%

    Millicom                        100.0
    CFAO                             94.0                     50%                                         49%   50%
    SABMiller                        74.0
    Avon Products                    61.2                                            40%
    Colgate-Palmolive                53.1                     40%                            39%
    Unilever                         45.9
    Coca-Cola                        42.2                            29%
                                                              30%
    Nestle                           39.3                                  27%
    Adidas                           38.7
    Suzuki Motor                     36.4                     20%
    YUM! Brands                      33.9
    Swatch                           32.8
    Gea Group                        32.5                     10%
    Kimberly-Clark                   32.0
    Procter & Gamble                 32.0
                                                              0%
    LVMH                             31.6
    Richemont                        31.2                              2004             2009                2014
    Reckitt Benckiser                27.4                                          Revenue         EBIT

7    Source: Nordea Investment Management. Date: 31.07.2010
Strategy example: “New Urban Consumer”

    Urbanisation leads to higher income and different spending patterns. New Urban
    Consumer is targeting new urban citizens and their basic consumption.

    Drivers                                                  Income per-capita growth in China
    • Migration from rural areas to cities                           (rural and urban)
    • Consumers starting to buy processed
      food and personal care articles

    Focus
    • Local companies
          • Food
          • Dairy
    • International companies
          • Personal care
          • Food
          • Beverages

                                             Source: Swiss Re, 2009

8
Strategy example: “Consumer Finance”

    When the need for basic consumer goods is covered, the possibilities for
    discretionary spending is accelerated by using credit facilities.

    Drivers                                     Credit cards per person in China and India
    •   Credit card spending increases with                               3.0

        disposable income                                                                                        2.43
                                                                          2.5
                                                                                                                        2.17
        Demographics – young consumers

                                                Credit cards per person
    •                                                                                                   2.00
        more willing to use credit facilities                             2.0

    •   Demand for more complex financial                                 1.5
        services e.g. mortgage loans
                                                                          1.0

    Focus                                                                 0.5
                                                                                   0.02         0.09
    •   Credit card issuers                                               0.0
                                                                                   India       China    Korea   Japan    US
    •   Mortgage institutions
                                                                          Source: UBS estimates, 2009
    •   Insurance companies

9
Strategy example: “Aspiration”

     When basic needs have been covered the consumers starts to aspire for a more
     comfortable living with extraordinary items that they could not afford earlier.

     Drivers                                        Automobile penetration in select countries
     •   Growing wealth                                   (population above 14 years)
     •   Young Emerging Markets population
     •   Consumer preferences – young
         consumers has more brand-awareness
     •   Consumer credit

     Focus
     •   International brands
     •   Local companies producing discretionary
         spending products at a entry price level
         equivalent to the emerging consumer’s
         wealth
                                                    Source: Wards, CEIS, UBS estimates, 2009
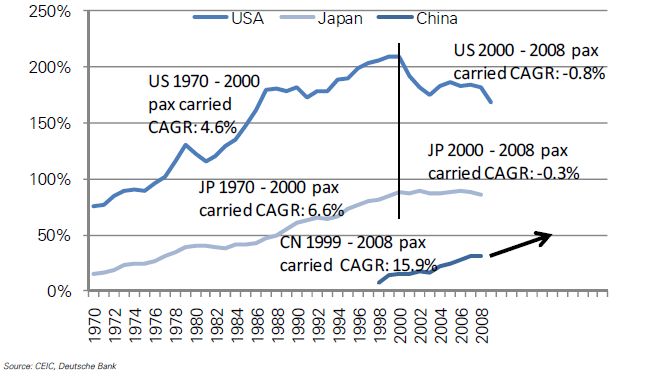
10
Strategy example: “Travel”

     As wealth is increasing, so will discretionary spending do. Besides wealth, a more
     organised workforce will lead to more holidays and hereby increased travelling.

     Drivers                                              Passenger air traffic penetration trend
     •   Increasing wealth                                   (No. of passengers/population)
     •   Modification of the legal holidays
     •   Easier access to visa

     Focus
     •   Local Emerging Markets travel agencies
     •   Providers of packaged holidays
     •   Online providers

                                                  Source: CEIS, Deutsche Bank, 2009

11
Strategy example: “Luxury”

     With increasing wealth in the middle class, consumption will for some develop into
     the luxury space.

     Drivers                                              Household income, 2004 versus 2009
     •   Increasing proportion of wealthy people                  (from poor to rich)
         in Emerging Markets countries
     •   Brand awareness in a globalised World

     Focus
     •   International high end brands

                                                   Source: Credit Suisse China Consumer Survey, 2009

12
Creating smart-beta

     •   Not only a directional bet on the market
     •   Only exposure to the most attractive growth area

                                                  Equity Universe
                   Th

                                                     Themes
                    Alp atic I
                     em
                       ha nve
                           ge stm
                               ne
                                 rat ent P

                                                    Strategies
                                    ion
                                        in oces
                                          the s
                                            r

                                                    Stock Selection

                                                      Portfolio
13
Investment process

     Research Process

                                    Investment
       Idea generation                               Conviction Building   Strategy Rating
                                 Philosophy Filter

     - Company interaction     Is it structural?     - Cross sectorial &   3       Highest
                                                       regional
     - Changing value-chains   - Demographics
     - Top-down trends         - Technology
                                                     - Data discovery      2
                                                     - Company visits
                               - Globalization
                                                     - Modelling
                                                                           1       Lowest

      Thematic strategies are utilised as a filter in our stock selection process

14
Investment process

     Stock Selection
     We use proprietary theme strategies to filter the investment universe and apply
     bottom-up stock selection

                               Management                          3 - Horizon
            Company's                                               valuation
                                  Strategy       Shareholder’s
             ability to                                               model
                                                    ability to
           capitalise on                                                          Portfolio
                                  Competitive     capitalise on
         theme strategies                                             Catalysts
                                  advantage     theme strategies
                            Industry dynamics                      Liquidity

               Invest in strongest stock ideas within the theme strategies

15
Investment process

     Company Valuation Model

     •   3 horizon framework for                     Value
         mapping thematic drivers
                                                     V3
     •   Dynamic model
                                                                                 Opportunities
     •   V2 is the target price
                                                     V2
                                            Target                                               Thematic
     •   Current stock price is evaluated   Price                       Growth                    Drivers
         relative to our theme strategy
                                                     V1
         valuation span V1+V2+V3
                                                              Core
                                                             Business
     •   Uncertainty increases as we
                                                                                                 Horizon
         move from horizon 1 to 2 to 3                         H1        H2           H3

16
Investment process

                                          Research Team

                                  Thematic                   Stock
                                  strategy                  selection
                                   ratings
                                    (1 – 3)

                                          Portfolio Team
                                           Optimal Portfolio

                                                Factor
                             Volatility       Sensitivity      Correlation

                                            Risk Team

       Portfolio is constructed to capitalise on our strongest convictions

17
Performance since inception

     •      Strong performance in a very challenging and volatile period
     •      Outperforming MSCI World since inception (Nov. 3rd 2008)

                     Nordea Emerging Consumer Fund

                     MSCI World
     170
     160                                                                                  EMC      MSCI
     150                                                                                  fund     World
     140
     130                                                                           2008   -6.4%    -12.9%
     120
     110                                                                           2009   44.7%    26.6%
     100
      90
      80                                                                           2010   19.5%    19.8%
      70
                                                                                   2011   -8.41%   2.8%
                     Ju 9

                     Se

                     Ju

                     Se
                     Ja

                     M

                     Ja

                     M

                     M

                     Ja
                     M

                     N

                     N
              N

                       ov
                       ov
                ov

                       ar

                       ar

                       ay
                       ay

                       l-0

                       l-1
                        n-

                        n-

                        n-
                        p-

                        p-
                         -1
                         -0

                          -1
                          -0
                  -0

                          -1
                          -0
                          09

                          10

                          11
                           10
                           09
                           9

                           0
                            0
                            9

                             9

                             0
                             8

                             0

18       Source: Nordea Investment Management AB and Bloomberg. Date: 28.02.2011
Volatility
     Performance achieved at an attractive volatility level compared to the market
                                                                   Volatility since inception (30D)
                            Nordea Emerging Consumer Fund

                            MSCI World

                            MSCI Emerging Markets

                      55

                      45

                      35

                      25

                      15

                        5

                                                                                                               Ju

                                                                                                                        Au

                                                                                                                                 O
                                         Fe

                                                 Ap

                                                            Ju

                                                                     Au

                                                                              O

                                                                                              Fe

                                                                                                      Ap

                                                                                                                                         D
                              D

                                                                                      D

                                                                                                                                  ct
                                                                               ct

                                                                                                                                         ec
                               ec

                                                                                      ec

                                                                                                                  n
                                                               n

                                                                                               b-
                                          b-

                                                                                                       r-1

                                                                                                                         g-
                                                    r-0

                                                                      g-

                                                                                                                                  -1
                                                                               -0

                                                                                                                 -1
                                                              -0

                                                                                                                                           -1
                                 -0

                                                                                        -0

                                                                                                 10
                                            09

                                                                                                                            1
                                                                         0

                                                                                                           0

                                                                                                                                     0
                                                        9

                                                                                  9

                                                                                                                    0
                                                                 9

                                                                                                                             0
                                                                          9

                                                                                                                                             0
                                   8

                                                                                          9

19   Source: Nordea Investment Management AB and Bloomberg. Date: 02.03.2011
Sharpe ratio comparison
                                                                  Sharpe ratio - one year rolling

                                                                                                                     Emerging Consumer fund
                                                                                                                     MSCI World
                 7
                                                                                                                     MSCI Emerging Markets

                 6

                 5

                 4

                 3

                 2

                 1

                 0
                     11

                                  12

                                               01

                                                            03

                                                                         04

                                                                                      06

                                                                                                   07

                                                                                                                09

                                                                                                                             10

                                                                                                                                          11

                                                                                                                                                       01

                                                                                                                                                                    02
                      /0

                                   /1

                                                /2

                                                             /1

                                                                          /2

                                                                                       /0

                                                                                                    /2

                                                                                                                 /0

                                                                                                                              /1

                                                                                                                                           /2

                                                                                                                                                        /1

                                                                                                                                                                     /2
                         3

                                      6

                                                   8

                                                                2

                                                                             6

                                                                                          8

                                                                                                       1

                                                                                                                    2

                                                                                                                                 5

                                                                                                                                              9

                                                                                                                                                           1

                                                                                                                                                                        3
                          /2

                                       /2

                                                    /2

                                                                 /2

                                                                              /2

                                                                                           /2

                                                                                                        /2

                                                                                                                     /2

                                                                                                                                  /2

                                                                                                                                               /2

                                                                                                                                                            /2

                                                                                                                                                                         /2
                             0

                                          0

                                                       0

                                                                    0

                                                                                 0

                                                                                              0

                                                                                                           0

                                                                                                                        0

                                                                                                                                     0

                                                                                                                                                  0

                                                                                                                                                               0

                                                                                                                                                                            0
                             09

                                          09

                                                       10

                                                                    10

                                                                                 10

                                                                                              10

                                                                                                           10

                                                                                                                        10

                                                                                                                                     10

                                                                                                                                                  10

                                                                                                                                                               11

                                                                                                                                                                            11
20   Source: Nordea Investment Management AB and Bloomberg. Date: 02.03.2011
Portfolio positioning
                                                      Nordea Emerging Consumer - Beta and P/E
                             35,0           Portfolio Beta 0.87
                                            Portfolio P/E '11 = 14.0
                                            MSCI World P/E '11 = 13.1
                             30,0

                             25,0

                                                                                 New Urban EM
          P/E (1Y forward)

                                                                        Consumer
                             20,0
                                                                         Finance
                                        New Urban Consumer                                         Luxury
                                                                                                                    Travel
                             15,0

                             10,0                                                    Aspiration
                                                              New Urban DM

                              5,0

                              0,0
                                 0,60          0,70           0,80      0,90         1,00         1,10      1,20   1,30      1,40
                                                                               Beta (Bloomberg)

21   Source: Nordea Investment Management AB and Bloomberg. Date: 02.03.2011
Composition of the fund
                        Regional Exposure                                                            Strategy Exposure

       Rest of World                                    North America                      Consumer Finance                        New Urban Consumer
           36%                                               19%                                10%                                       48%
                                                                                     Travel
                                                                                      6%

                                                                              Aspiration
                                                                    Europe      27%
            Japan                                                    38%
             7%                                                                                               Luxury
                                                                                                               9%
                        Currency Exposure                                                        Market Capitalisation Exposure
                         MXNZAR KRW
                  INR                                                                                              Small €10bn
22    Source: Nordea Investment Management AB. Date: 02.03.2011                                                             76%
Historical composition

      100%

        80%

        60%

        40%

        20%

         0%
              Nov-08

                         Jan-09

                                                        Jul-09

                                                                          Nov-09

                                                                                   Jan-10

                                                                                                               Jul-10

                                                                                                                                 Nov-10

                                                                                                                                          Jan-11
                                   Mar-09

                                             May-09

                                                                                             Mar-10

                                                                                                      May-10
                                                                 Sep-09

                                                                                                                        Sep-10
                                            Developed Markets Companies                     Emerging Markets Companies

23   Source: Nordea Investment Management AB. Date: 02.03.2011
Summary

     •   Exposure to high growth area with strong long term structural drivers
           – Rapid urbanisation
           – Increasing spending power
           – Changing spending patterns
     •   Dynamic framework
           – Five strategies
           – Developed vs. Emerging Markets
     •   Highly attractive risk/return profile
           – Performance
           – Volatility
           – Sharpe ratio
     •   Well documented investment process
     •   Uniqueness
           – Not just a directional bet on the market
           – No similar product on the market

24
Appendix

25
Nordea 1 – Emerging Consumer Fund
     Monthly update as of 28.02.2011

     •   Fund performance
     •   Top 10 holdings
     •   Sector, country and currency breakdown
     •   Market capitalisation
     •   Fund information

26
Nordea 1 – Emerging Consumer Fund
      Fund performance as of 28.02.2011
170
                                                                                                       Cumulative returns
160                                                                                                    Period                          Fund         Benchmark*
                                                                                                       Year to date                  -8.41%              2.80%
150                                                                                                    1 month                        0.20%              2.74%
                                                                                                       3 months                      -6.68%              7.08%
140
                                                                                                       6 months                      -0.40%             16.01%
130                                                                                                    1 year                         8.81%             20.22%
                                                                                                       Since launch**                48.20%             36.49%
120

110

100

90
                                            MSCI World - Net Return Index
80
                                            Nordea 1 - Emerging Consumer Fund BP-EUR
70
 Nov-08              May-09               Nov-09             May-10               Nov-10

    * MSCI World – Net Return Index. The sub-fund has no official reference index. This index is only used for performance comparison purpose. ** Launch date:
    03.11.2008. Source: Nordea Investment Funds S.A. and Datastream. Date 28.02.2011. Performance is calculated NAV to NAV gross income reinvested, in
    EUR, excluding initial and exit charges as per 28.02.2011. Past performance is not necessarily a guide to the future and investors may not recover the full
 27 amount invested.
Nordea 1 – Emerging Consumer Fund
     Top 10 holdings as of 28.02.2011
     Top Ten in %
     Toyota Motor                                             JP3633400001    5.09
     Coca-Cola                                                US1912161007    4.59
     SABMiller                                                GB0004835483    4.31
     GEA Group AG                                             DE0006602006    4.20
     Richemont                                                CH0045039655    3.95
     Colgate-Palmolive                                        US1941621039    3.87
     Yum Brands                                               US9884981013    3.85
     Banco Santander Brasil ADR                               US05967A1079    3.76
     Unilever                                                 GB00B10RZP78    3.66
     WPP                                                      JE00B3DMTY01    3.58
     Total                                                                   40.86
     Source: Nordea Investment Funds S.A., Date: 28.02.2011

28
Nordea 1 – Emerging Consumer Fund
     Sector, country and currency breakdown as of 28.02.2011
     Sector Breakdown in %                                             Country Breakdown in %
     Consumer Discretionary                                    35.26   (Top 10)
     Consumer Staples                                          35.19
                                                                       United States of America                                 21.25
     Financials                                                 9.66
                                                                       United Kingdom                                           11.55
     Industrials                                                9.46
     Information Technology                                     2.63   Switzerland                                               9.51
     Telecommunication Services                                 2.31   Japan                                                     7.19
     Net Liquid Assets                                          5.49   India                                                     6.92
     Total                                                    100.00   Hong Kong                                                 6.56
     Source: Nordea Investment Funds S.A., Date: 28.02.2011
                                                                       Germany                                                   5.91
     Currency breakdown in %                                           China                                                     4.27
     USD                                                       27.32   Brazil                                                    3.76
     EUR                                                       13.17   France                                                    3.69
     HKD                                                       12.98   Net Liquid Assets                                         5.49
     GBP                                                       11.55   Total                                                    80.62
     CHF                                                        9.51   Source: Nordea Investment Funds S.A., Date: 28.02.2011
     JPY                                                        7.19
     INR                                                        6.92
     KRW                                                        3.48
     MXN                                                        2.37
     Net Liquid Assets                                          5.49
     Total                                                    100.00
     Source: Nordea Investment Funds S.A., Date: 28.02.2011

29
Nordea 1 – Emerging Consumer Fund
     Market capitalisation as of 28.02.2011

     Market Capitalisation in % (in mln.                                      Without
                                                              Cash included
     EUR)                                                                        cash
     [500] –     [1000]                                                2.15       2.27
     [1000] –      [2000]                                              5.57       5.90
     [3000] –      [4000]                                              1.15       1.22
     [4000] –      [5000]                                              7.20       7.62
     [5000] –      [10000]                                            10.18     10.77
     [10000] –       [20000]                                          17.31     18.32
     > [20000]                                                        50.94     53.90
     Net Liquid Assets                                                 5.49
     Total                                                           100.00    100.00
     Source: Nordea Investment Funds S.A., Date: 28.02.2011

30
Nordea 1 – Emerging Consumer Fund
     Fund information as of 28.02.2011

     Subfunds name                                            Emerging Consumer Fund
     Fund Manager                                             Leon Svejgaard Pedersen
     Fund Domicile                                            562, rue de Neudorf, L-2220 Luxembourg
     Share class                                              BP
     Annual Man. Fee                                          1.500 %
     Security number (ISIN)                                   LU0390857471
     Security number (WKN)                                    A0RASQ
     Fund Size in millions                                    335.08
     Currency                                                 EUR
     Reference index                                          N/A
     No. of holdings                                          33
     Launch date                                              03/11/2008
     Minimum investment (EUR)                                 50
     Source: Nordea Investment Funds S.A., Date: 28.02.2011

31
Research Responsibilities

                                                                                                                                                                          Technology
                                                                                                                                               Health Care
                                                                                             Materials &

                                                                                                                                                                                       Telecom &
                                                                                                           Industrials

                                                                                                                         Consumer

                                                                                                                                    Consumer

                                                                                                                                                             Financials

                                                                                                                                                                                                   Utilities
                                                                                                                                     Staples
                                                                                              Energy

                                                                                                                                                                                         Media
                                                                                               Basic

                                                                                                                           Disc.
                                           Years with
                              Years Exp.                            Thematic Reseach
                                            Nordea

     Charlotte Winther, COO      23           19        Industrial Renaissance                             9

                                                        Emerging Consumer, Fulfil your
     Leon S. Pedersen, CIO       24           24                                                                           9                                              9
                                                        Dreams, Strong Getting Stronger
                                                        Convergence of Communication &
     Jesper Krüger               13            1                                                                                                                                         9
                                                        Media

     Thomas M. Ladefoged         13            5        Underdeveloped Financial Markets                                                                     9

     Robert Madsen               20           19        Education                                                                     9

                                                        Environment & Resource Efficiency,
     Thomas Sørensen             15           15                                                 9                                                                                                 9
                                                        Fighting the Decline Curve

     Kristina Ganea               6            6        Universal Healthcare                                                                   9

     Lotte Eriksen                7            7        Emerging Consumer                                                  9

     Henning Padberg              4            4        Cloud Computing, Mobile Computing                                                                                 9

     Hans-Martin Thorsen         26           12        Market Repair                                      9               9          9                                   9

     Jorry Nøddekær              11            1        Cross Straits                            9                                                           9                           9         9

     Morten Eddy                 14           14        Head of Risk Management

     Bjørn Burmeister            15           12        Product Manager

32
Biographies

     Mr. Leon S. Pedersen, CFA

     Mr. Pedersen began his career as a financial analyst in 1988 with Privatbanken, a direct predecessor of Nordea’s. He
     began working as a portfolio manager for our organisation in 1991, and during his tenure, has been pivotal to the
     development of the strategy and investment philosophy of the Thematic Investment Process. Leon also led regional
     equity portfolio management teams and contributed to the development of the Matrix Organisation of team member
     responsibility. He was promoted to senior portfolio manager in 1994, to chief portfolio manager in 1998, and finally to
     Head of Equity in 2001. Leon is now the Chief Investment Officer within Equities, and is primary upon Global portfolios.

     Leon holds a M.Sc. in Finance & Investment from Copenhagen Business School, Denmark and is a CFA Charter
     holder.

     Ms. Lotte Eriksen, CFA

     Ms. Eriksen is currently responsible for Telecommunications and Commercial Services globally. Further, she is the
     deputy on the Emerging Consumer Fund. Prior to covering Telecommunications and Commercial Services, she was
     responsible for Consumer Staples globally. Lotte joined the Thematic Investment team in June 2007 as a research
     associate specializing within global consumer goods. Before joining the team, Lotte was management assistant and
     strategic advisor in Nordea Investment Management, and from 2005-2006 she worked within Risk Management and
     Controlling in Nordea Treasury.

     Lotte holds a M.Sc. in Economics from University of Copenhagen and is a CFA Charter holder.

33
Contact France
    Nordea Investment Funds S.A.                                                                                           Marc Olivier
    90, Avenue des Champs Elysées                                                                                          Directeur Général
    F-75008 Paris                                                                                                          +33.(0)1.56.43.50.23
    www.nordea.fr                                                                                                          marc.olivier@nordea.com
    nordeafunds@nordea.lu

    The sub-funds mentioned are part of the Nordea 1, SICAV, an open-ended Luxembourg-based investment company (Société d'Investissement à Capital Variable), validly
    formed and existing in accordance with the laws of Luxembourg and with European Community Directive 85/611/CEE of 20 December 1985.
    The custodian of the SICAV’s assets is Nordea Bank S.A., Luxembourg. Investments in the Nordea funds should be made on the basis of the current prospectus, which is
    available, along with the simplified prospectus, current annual and semi-annual reports, free of charge upon request from Nordea Investment Funds S.A., 562, rue de Neudorf,
    P.O. Box 782, L-2017 Luxembourg, from the local representatives or information agents, or from our distributors.
    A transaction involving a foreign exchange transaction may be subject to fluctuations of currency values which may affect the value of an investment. Investments in Emerging
    Markets involve a higher element of risk.
    Nordea Investment Funds S.A. only publishes product-related information and does not make any investment recommendations.
    Further information can be obtained from your financial advisor. He/she can advise you independently of Nordea Investment Funds S.A.
    Published by Nordea Investment Funds S.A., 562, rue de Neudorf, P.O. Box 782, L-2017 Luxembourg.
    Additional information for investors in France: With the authorisation of the Autorité des Marchés Financiers (AMF) as per 11 March 2003, 13 December 2005, 03 April
    2007, 28 September 2007, 29 February 2008, 29 April 2008, 25 November 2008 and 09 June 2009, Nordea 1, SICAV may be distributed to investors in France, as published in
    the Bulletin des Annonces Légales Obligatoire dated 19 March 2003, 19 December 2005, 18 April 2007, 10 October 2007, 19 March 2008, 28 May 2008, 15 December 2008
    and 26 June 2009. Centralising Correspondent in France is CACEIS Bank, located at 1-3, place Valhubert, 75013 Paris. Investors are advised to conduct thorough research
    before making any investment decision.
    Performance calculated NAV to NAV (net of fees and Luxembourg taxes) gross income reinvested, in EUR, excluding initial and exit charges as per 28.02.2011.
   The performance represented is historical; past performance is not necessarily a guide to the future and investors may not recover the full amount invested. The
   value of shares can fluctuate and is not guaranteed. Unless otherwise stated, all views expressed are those of Nordea Investment Funds S.A. This document may not be
   reproduced or circulated without prior permission. Reference to companies or other investments mentioned within this document should not be construed as a recommendation
34 to the investor to buy or sell the same, but is included for the purpose of illustration.
You can also read