Small Caps - The New Thematics? - Isabelle de Gavoty Head of Framlington Equities Small Cap Team FRAMLINGTON EQUITIES 25 June 2019
←
→
Page content transcription
If your browser does not render page correctly, please read the page content below
This promotional document is intended for Professional Clients under MiFID (2014/65/CE) only
                       and should not be relied upon by retail investors. Circulation must be restricted accordingly. Any
                       reproduction of this information, in whole or in part, is prohibited.

Small Caps – The New Thematics?
Isabelle de Gavoty
Head of Framlington Equities Small Cap Team
FRAMLINGTON EQUITIES
25 June 2019
European Small Cap
Investment Case

Why Small cap can be structurally attractive…

                                                                                                                      European Small vs Large cap 10 year Performance

                                                                                        325
                                                                                                   STOXX Europe 600 TR EUR
                                                                                        300        STOXX Europe Small 200 TR EUR                                                                    +226%
                         Their size is an advantage
                                                                                        275

                                                                                        250
                                                                                                                                                                                                    +160%
                                                                                        225

                                                                                        200

                         They have historically moved                                   175
                                                                                        %
                         up the value chain                                             150

                                                                                        125

                                                                                        100

                                                                                         75

                                                                                         50
                         They have historically diversified
                         their revenue base                                              25

                                                                                          0
                                                                                          May-09     May-10     May-11       May-12   May-13    May-14     May-15    May-16   May-17   May-18   May-19

Source: Factset as at 31/05/2019. Basis: Total return in EUR. Past performance is a not a reliable indicator of future performance. For illustrative purpose only.

2        FRAMLINGTON EQUITIES
Small caps can offer superior earnings growth over the long-term
Long-term earnings growth

            180                                                                    Relative 12-month forward EPS
                                                                                     Index: Jan. 1st 2004 = 100

            170

            160
                                 S/E          M/E            L/E

            150

            140

            130

            120

            110

            100

             90

             80
                  04        05          06          07          08          09          10          11          12          13          14      15   16   17   18   19

                                             Small caps have generated much stronger EPS growth than large caps

Source: AXA IM, FactSet as at 31/05/2019. Past performance is a not a reliable indicator of future performance. For illustrative purpose only

3        FRAMLINGTON EQUITIES
… Over the longer-term small caps are no more volatile than large caps
European Small cap vs Large Cap Volatility
45
STOXX Europe Large 200 STOXX Europe Mid 200 STOXX Europe Small 200
40
35
30
25
%
20
15
10
5
0
Jan-03
Apr-04
Jan-08
Apr-09
Jan-13
Apr-14
Jan-18
Apr-19
Dec-00
Aug-02
Nov-03
Sep-04
Feb-05
Dec-05
Aug-07
Nov-08
Sep-09
Feb-10
Dec-10
Aug-12
Nov-13
Sep-14
Feb-15
Dec-15
Aug-17
Nov-18
Oct-01
Jun-03
Oct-06
Jun-08
Oct-11
Jun-13
Oct-16
Jun-18
May-01
Mar-02
May-06
Mar-07
May-11
Mar-12
May-16
Mar-17
Jul-05
Jul-10
Jul-15
Since 2000, small cap annualised volatility has been largely in line with large caps...
Source: Factset as at 31/05/2019. Past performance is a not a reliable indicator of future performance. For illustrative purpose only
4 FRAMLINGTON EQUITIES
Small caps often define their own growth trajectories
A highly stock-specific universe

                      Large caps                                                                                                                              … versus small caps

                                                                              80%

                                                                                                                          60%

                       80%                                                                                      40%
                                                                                                                                                                       40%
                                                                                        20%
          of large caps’ share price
                                                                                                                                                         of small caps’ share price
          move is correlated with
                                                                                                                                                          move is correlated with
                macro factors                                                   Large caps                        Small caps
                                                                                                                                                              macro factors
                                                                               Macro factors              Stock-specific factors

Source: Citi Investment Research & Analysis (Based on S&P and BMI Indices Top 100-Large Caps & Bottom 100=Small Caps) as at June 2014. Past performance is not a reliable indicator of future performance.
For illustrative purpose only

5        FRAMLINGTON EQUITIES
Shrinking sell-side & buy-side coverage of small caps
Typically under-researched and under-owned

                                                                      No. of analysts providing recommendations
100%

    90%                                                             MSCI Europe Small Cap                                      MSCI Europe
                                                                                                                                                                           82%
    80%

    70%
                             64%

    60%

    50%

    40%

    30%
                                                                                             25%

    20%
                                                                                                               12%                                           11%
    10%                                         7%

    0%
                        < 10 Analyst recommendations                             Between 10 & 15 Analyst recommendations                                >15 Analyst recommendations

                                                           Small caps are generally more inefficiently priced

Source: AXA IM, Bloomberg as at 13/06/2019. Large cap >$10bn market cap, mid cap between $2bn -$10bn, and small cap
Investment universe
Geographical exposure by sales
Europe ex UK 46,1
North America 14,7
United Kingdom 11,4
Asia Pac ex JP 8,4
EEMEA 10,8
Latin America 4,3
Japan 1,6
0 5 10 15 20 25 30 35 40 45 50
Source: AXA IM, FactSet at 31/05/2019.
7 FRAMLINGTON EQUITIESInvestment universe
Good sector diversification
2,6
3,9 2,8
4,7
24,7
5,1
10,5
12,5 20,4
12,9
Financials Industrials Health Care Consumer Services
Consumer Goods Technology Basic Materials Oil & Gas
Telecommunications Utilities
Source: AXA IM, FactSet at 31/05/2019.
8 FRAMLINGTON EQUITIESSmaller companies are more likely to benefit from M&A
Deal Numbers 2010-2019 in Europe
M&A Volume in Europe By size of market capitalisation
1,800,000 10000
Volume (LHS) Deal Count (RHS)
1,600,000 9000
1-5 Bn USD 1505
8000
1,400,000
Size of Market Capitalisation
7000
1,200,000
Volume in millions USD
6000
1,000,000
Deal Count
5-10 Bn USD 179
5000
800,000
4000
600,000
3000
> 10 Bn USD 132
400,000
2000
200,000 1000
0 500 1000 1500 2000
- 0
2007 2008 2009 2010 2011 2012 2013 2014 2015 2016 2017 2018 2019
Strong recovery in M&A volume globally with a good pick up in Europe
Source: Bloomberg as at 31/05/2019.
Past performance is a not a reliable indicator of future performance. For illustrative purpose only.
9 FRAMLINGTON EQUITIESInvesting in the asset class
Europe Small Caps
Value Creation Chain
Growth Pure Sustainable
Play Future Leaders
Returns
Focus on
IPO’s Specific
mispriced
Innovation business
Niche growth
Models
ESG Factors
For illustrative purposes only. No assurance can be given that the strategy will be successful or that investors will not lose some or all of their capital
11 FRAMLINGTON EQUITIESCorporate Lifecycle Analysis
Focusing on sustainable margins
Start up – IPO Proven Success Maturity Decline – Resurgence
Market share gain Saving programmes
Sales & margin expansion Operating losses
Diversification Sale of assets
Investment phase External growth Management changes
Building the franchise Dividend growth Return to profitability
Growth acceleration Lower revenue growth
Breakeven Lower profit growth
Market share loss
Earnings growth
Margins Margins
Multiples expansion
Free cash flow
Aiming to invest in the most attractive stages of a company corporate lifecycle
Source : AXA IM. The length of each life cycle may depend on the nature of the company.
12 FRAMLINGTON EQUITIESIdea generation
Exposure to specific business models
Disruptive
Business
Winner Model
Takes All
Resurgent
Growth
Leader &
Consolidator
Source: AXA IM as at 31/05/2019. Cash is excluded in the analysis. For illustrative purposes only. No assurance can be given that the strategy will be successful or achieve its objectives. Information may be
provided for reference only and does not represent the experience of the strategy/fund nor is it intended as a representation or warranty by AXA IM or any other persons or entity as to the actual composition
of or performance of any future investment. The stock examples specifically identified herein does not represent all of the securities purchased, sold or recommended for client accounts.
13 FRAMLINGTON EQUITIESHow do we measure value creation ?
Value
chain
Sustainable Future
Threats
growth Leader
drivers
ESG
Factors
Source: AXA IM. For illustrative purposes only. No assurance can be given that the strategy will be successful or achieve its objectives. Information may be provided for reference only and does not represent the
experience of the strategy/fund nor is it intended as a representation or warranty by AXA IM or any other persons or entity as to the actual composition of or performance of any future investment.
14 FRAMLINGTON EQUITIESAnalysing value chains within specific industries
Example of the education industry
Education
Student Mobility Child Care & Early
Agencies Education
Facilities
Educational
Financial Platforms
Management for
Institutions
Content Providers
Source: AXA IM as at 31/05/2019. The examples provided above are for illustrative purposes only and are intended to reflect the typical securities, sectors, and/or geographies that could be deployed by the
strategy to generate the target returns, and should not be considered a recommendation or solicitation to buy or sell any particular security.
15 FRAMLINGTON EQUITIESAnalysing value chains within specific industries
Example of the wellbeing industry
Wellbeing
Ingredients Food & Beverage
Apparel
Leisure
Retailing
Source: AXA IM as at 31/05/2019. The examples provided above are for illustrative purposes only and are intended to reflect the typical securities, sectors, and/or geographies that could be deployed by the
strategy to generate the target returns, and should not be considered a recommendation or solicitation to buy or sell any particular security.
16 FRAMLINGTON EQUITIESAnalysing value chains within specific industries
Example of the e-commerce industry
E-commerce
Goods Flow Last Mile
Delivery
Warehouse
Design Warehouse
Management
Software Warehouse
Management Automation
Source: AXA IM as at 31/05/2019. The examples provided above are for illustrative purposes only and are intended to reflect the typical securities, sectors, and/or geographies that could be deployed by the
strategy to generate the target returns, and should not be considered a recommendation or solicitation to buy or sell any particular security.
17 FRAMLINGTON EQUITIESAnalysing value chains within specific industries
Example of disruption of the internet industry
Disruption of Internet
Online Banking Virtual Medicine
Professional Network
Classified ads
Social Network
Source: AXA IM as at 31/05/2019. The examples provided above are for illustrative purposes only and are intended to reflect the typical securities, sectors, and/or geographies that could be deployed by the
strategy to generate the target returns, and should not be considered a recommendation or solicitation to buy or sell any particular security.
18 FRAMLINGTON EQUITIESXing: digitizing the recruitment process in German-speaking countries
Fundamental Stock Selection
Idea Generation (Think) Portfolio Construction (Invest) Continuous monitoring
(Understand)
Where did the stock idea come from? Value chain analysis
Uncontested leader in its home
Deep knowledge of the European market (DACH region) with a member
universe: Disrupter in the traditional base of 15m+ business professionals, CAD 30
recruitment process thanks to a thus providing a strong barrier to
CAD 28
combination of software tools and a entry
proprietary database Strong network effect: growing
CAD 26
number of members (and particularly
Market cap: €2.1bn the granularity of personal data) and CAD 24
Liquidity filter (>€1m/day): €1.2m enterprise customers significantly
ROE: 40% increases the value of the network CAD 22
EPS Growth (Fwd): 14.4% and allows to create new products
Net Det/Equity: net cash position CAD 20
ESG Scoring CAD 18
Environmental: 6.0 Business Model & Investment Theme
Social: 4.9 Disruptive Business Model CAD 16
Governance: 5.6
Overall: 5.1 CAD 14
CAD 12
Business Model & Investment Theme ESG/Corporate Governance Scoring
Disruptive Business Model: Partly owned by a Private Equity
CAD 10
Gradually pivoted its B2C business investor (owns 50%)
Jul-13
Jul-14
Jul-15
Jul-16
Jul-17
Jul-18
Apr-13
Apr-14
Apr-15
Apr-16
Apr-17
Apr-18
Jan-14
Jan-15
Jan-16
Jan-17
Jan-18
Oct-13
Oct-14
Oct-15
Oct-16
Oct-17
Oct-18
model (professional social network) We are currently engaging with the
to also address the B2B market. Board to further strengthen
Thanks to its key proprietary governance mechanisms
database and to the development of Social: the company lags its peers in
a software suite, Xing is disrupting comprehensive training and
the traditional recruiting market development programs Mgmt. meeting
Source: AXA IM, XIng Website and annual report as at 31/05/2019. The examples provided above are for illustrative purposes only and are intended to reflect the typical securities, sectors, and/or geographies
that could be deployed by the strategy to generate the target returns, and should not be considered a recommendation or solicitation to buy or sell any particular security.
19 FRAMLINGTON EQUITIESSixt: the future of mobility is digital
Fundamental Stock Selection
Idea Generation (Think) Portfolio Construction (Invest) Continuous monitoring
(Understand)
Where did the stock idea come from? Value chain analysis
Leader in its home market in high end
Deep knowledge of European car rental
Universe: the positioning of Sixt Omni channel distribution through
80
compared to the rest of car rental online and branches
companies makes a differentiated Strong brand
business model Asset light model 70
60
Market cap range $500 - $5 billion: ✓ Business Model & Investment Theme
Liquidity filter (>$1m/day): ✓ Winner takes all & transitioning 50
ROE: 17% societies
EPS Growth (Fwd): 3% 40
Net Det/Equity: 164.5
30
ESG Scoring
Environmental: 5.4 ESG/Corporate Governance Scoring 20
Social: 6.2 Managed by the founding family, but
Governance: 2.8 new CEO (not from family) named in 10
Overall: 4.7 January 2019
Lack of diversity and independence of 0
Business Model & Investment Theme the Board 02.01.2014 02.01.2015 02.01.2016 02.01.2017 02.01.2018 02.01.2019
Winner takes all: Market leadership
in the high end segment of car rental,
thanks to solid agreements with
German car manufacturers. While
deploying its offer across Europe and
the US, Sixt is building a full service
platform around mobility Mgmt. meeting
Transitioning societies: decreasing
ownership of vehicles for more
renting / sharing practices
Source: AXA IM, Sixt Website and annual report as at 31/05/2019. The examples provided above are for illustrative purposes only and are intended to reflect the typical securities, sectors, and/or geographies
that could be deployed by the strategy to generate the target returns, and should not be considered a recommendation or solicitation to buy or sell any particular security.
20 FRAMLINGTON EQUITIESSmall caps valuations by region
Continental Europe UK US/Canada Japan
Small Caps Large Caps Small Caps Large Caps Small Caps Large Caps Small Caps Large Caps
EV/sales
4.4x 3.3x 4.2x 2.7x 5.3x 5.1x 3.1x 2.2x
(ex-Fin)
EV/EBITDA
14.4x 12.4x 14.2x 10x 17.5x 16.5x 12.1x 10.6x
(ex-Fin)
Trailing P/E
20.3x 19.7x 22.3x 17.2x 23x 23.6x 18.8x 17.2x
(IBES)
Fwd P/E
16.8x 15.8x 16.1x 13.1x 19.8x 18.8x 17.4x 16.2x
(IBES)
Source: AXA IM, FactSet, as at 31/05/2019. Past performance is a not a reliable indicator of future performance. For illustrative purpose only.
21 FRAMLINGTON EQUITIESValuation premium vs large caps has reduced since Q4 2018
Price to Earnings (NTM) Small vs. Large valuation premium
7 Years 7 Years
40%
19
17 30%
15 MSCI Europe Small
13 20%
Average
11
+1STD 15%
9 10%
-1STD
7
MSCI Europe Large 0%
5
Sep 15
Feb 16
Jul 16
Dez 16
Okt 12
Okt 17
Apr 15
Jun 14
Mai 12
Mrz 13
Aug 13
Jan 14
Nov 14
Mai 17
Mrz 18
Aug 18
Jan 19
Mai 12
Nov 12
Mai 13
Nov 13
Mai 14
Nov 14
Mai 15
Nov 15
Mai 16
Nov 16
Mai 17
Nov 17
Mai 18
Nov 18
Mai 19
Source: AXA IM, Factset, as at 31/05/2019. Past performance is a not a reliable indicator of future performance. For illustrative purpose only.
22 FRAMLINGTON EQUITIESOver 1 and 3 years, small cap performance has been essentially penalised by deratings
MSCI Europe Small Cap Return Decomposition MSCI Europe Small Cap Return Decomposition
1 Year to May 2019 3 Years to May 2019
40% 100%
30% 80%
20% 60%
10%
40%
0%
20%
-10%
0%
-20%
-20%
-30%
-40%
-40%
-60%
-50%
Cons Disc
Real Estate
Materials
Consumer Staples
Industrials
IT
Energy
MSCI Europe Small
Financials
Utilities
Health Care
Cons Disc
Real Estate
Materials
Consumer Staples
Industrials
IT
Energy
MSCI Europe Small
Financials
Utilities
Health Care
Earnings Growth Multiple Expansion Price Return
Earnings Growth Multiple Expansion Price Return
Source: AXA IM, Factset, as at 31/05/2019. Past performance is a not a reliable indicator of future performance. For illustrative purpose only.
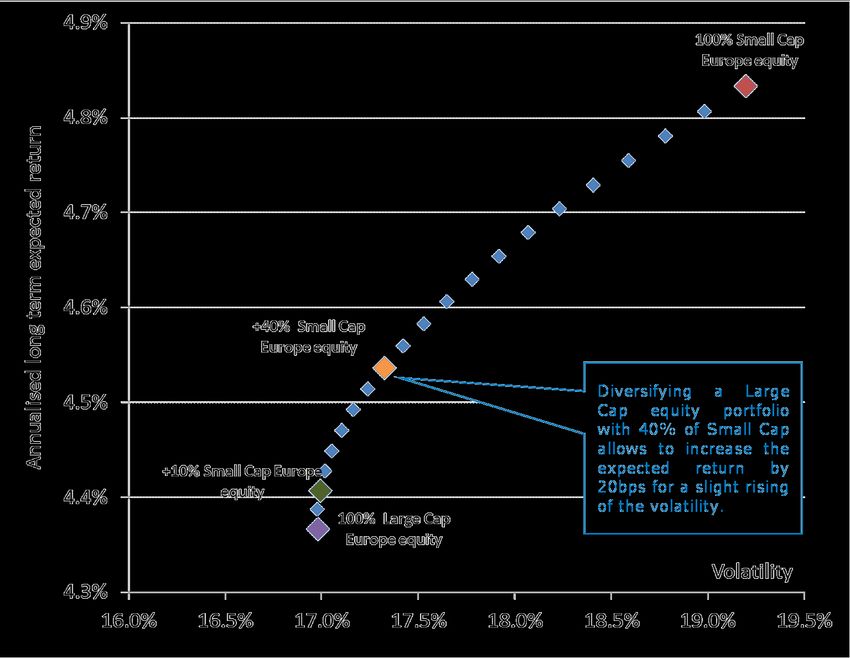
23 FRAMLINGTON EQUITIESWhy invest in Small cap ?
An under-researched and under-owned universe
Small cap distinctive risk/return profile can offer some
diversification benefits
• Under-researched: Many all cap global equity
managers are not covering efficiently the small
cap segment, as the universe is broad and needs
specialist resources
• Under-owned: Small cap represent c. 1% of
client portfolios when it is as large as the GEMs
equity universe
• Many high growth concepts can only be
accessed through Small cap
• Small Cap have exposure to both global and
domestic growth themes
A superior risk adjusted return profile, a core allocation within equity portfolios
GEMs: Global Emerging Markets. Source: AXA IM. Prospective analysis based on risk/return profiles computation over a 8 year horizon on a forward-looking basis with the generation of 10,000 markets
scenarios on AXA IM internal simulation tool. The reference interest rate curve is the EUR swap curve as of 31/12/2015. For illustrative purpose only. This forecast is for illustrative purposes only, established on
the basis of an internal model of AXA IM as of 31/12/2015, and does not constitute an offer to buy or sell. It does not constitute a reliable indicator of future performances. These forecast returns should not be
relied upon and no representation is being made that any fund or strategy will or is likely to achieve profits or losses similar to those shown herein
24 FRAMLINGTON EQUITIESDisclaimer This presentation is intended for professional advisers’ use only and should not be relied upon by retail clients. Circulation must be restricted accordingly. Any reproduction of this information, in whole or in part, is prohibited. We point out that this document does not comply with the requirements of respective applicable Directive 2004/39/EG or 2014/65/EU (MiFID/MiFID II) and the related directives and regulations. Therefore, this document is not suitable for any kind of sales services, consulting or financial services vis-à-vis retail clients. The information in this document is exclusively addressed to professional clients who receive this document directly from AXA Investment Managers Deutschland GmbH / its affiliated companies. It is to be treated strictly confidential. The recipients are not allowed to pass this document and the information contained herein on to a third party, in whole or in part, without the prior written consent of AXA Investment Managers Deutschland GmbH / its affiliated companies. Please note the following information and read the latest prospectus including the general and special terms and conditions of the fund respectively the articles of association, which are the only relevant basis for the purchase of fund units/shares. Any transaction on the basis of information or explanation which is not contained within the prospectus is carried out exclusively on risk of the buyer. You will receive the latest prospectus, Key Investor Information Document (“KIID”), and the most recent annual and semi-annual report upon request free of charge and in paper form at AXA Investment Managers Deutschland GmbH • Bleichstrasse 2-4 • 60313 Frankfurt/Main or from our distribution partners or under www.axa-im.de. The data, figures, declarations, analysis, predictions, concepts and any other information provided in this document is provided by AXA Investment Managers Deutschland GmbH / its affiliated companies and based on our state of knowledge at the time of its creation. The mentioned information may be amended at any time without notice. Due to the simplification the information in this document can be subjective. As far as we refer to information of third parties we point out that we do not overtake any liability for its content, for the correctness, completeness, topicality and adequacy of these data even if we use only such data which we consider to be reliable. Nevertheless, unintended erroneous statements or presentations may occur. A liability or guarantee for the up-to-dateness, correctness and completeness of the allocated information cannot be assumed neither by AXA Investment Managers Deutschland GmbH nor its affiliated companies. Performance results of the past are no indicator for any future returns or trends. The value and income derived from investments may go down as well as up. Furthermore commissions and costs have an adverse effect on the performance of a fund. Information about AXA Investment Managers’ staff is only informative as of the date of this document. We do not guarantee continues employment of the mentioned staff members. The information in this document is provided for information purposes only, and shall not be construed as legal or tax advice by AXA Investment Managers Deutschland GmbH / its affiliated companies, nor shall it be construed as a solicitation to buy or a recommendation to invest. An investment or other decision may not be made on the only basis of this document. Prior to any transaction potentially interested parties must carefully consider the appropriateness of their investments to their specific situation and ensure that they understand the risks involved in their investment decisions. As part of this individual consultation you will also be informed of costs and fees associated with the purchase of one of the mentioned products. While providing investment services, AXA Investment Managers Deutschland GmbH and/or its affiliates may receive or grant benefits (commissions, fees or other payments as well as all monetary benefits). 25 FRAMLINGTON EQUITIES
You can also read