ING Asian Debt Strategy - Roy Scheepe ING Investment Management Asia Pacific (Singapore) Limited

Page created by Brandon Hoffman
 
CONTINUE READING
ING Asian Debt Strategy - Roy Scheepe ING Investment Management Asia Pacific (Singapore) Limited
ING Asian Debt Strategy

       Roy Scheepe
       ING Investment Management Asia Pacific (Singapore) Limited
       Wiesbaden, June 2012

        For professional investors use only and not for use in public

For professional investors use only and not for use in public   0       ING Asian Debt Strategy
ING Asian Debt Strategy - Roy Scheepe ING Investment Management Asia Pacific (Singapore) Limited
Why Asian Debt?

   Solid fundamentals

   Long-term appreciation potential of Asian currencies

   Attractive valuations of Asian bonds vis-à-vis global counterparts

   Diversification benefits

   Steady growth of asset class

   Dedicated investor base

   Favorable risk-reward profile

For professional investors use only and not for use in public   1        ING Asian Debt Strategy
ING Asian Debt Strategy - Roy Scheepe ING Investment Management Asia Pacific (Singapore) Limited
“The Asian century”

                       Asia’s share of global GDP – 1700-2050                                                      Global population
                  70                                                                                                   1.4

                  60                                                                                                   1.2

                  50                                                                                                   1.0
% of global GDP

                  40                                                                                                   0.8

                                                                                                                 Bln
                  30                                                                                                   0.6

                  20                                                                                                   0.4

                  10                                                                                                   0.2

                   0                                                                                                   0.0
                       1700         1870         1950         1980         2010          2030         2050                   China      India      Other       US        Japan     Germany   UK
                                                                                                                                                   Asia

                  Source: Asian Development Bank (Asia 2050: Realizing the Asian Century, August 2011), Maddison (1700-1950) (2007), Centennial Group International (1951-2050) (2011).
                  Data for 1750-1790 are PPP and data for 1991-2050 are in market prices.

                      Asia accounts for 60% of the world’s population
                      Asian Development Bank: “Asia to account for over 50% of global GDP by 2050.”
                      Goldman Sachs estimates that, by 2050, the Chinese GDP will exceed US GDP by 50%
                       and that Indian GDP will exceed Euro Area GDP.

                  For professional investors use only and not for use in public                          2                                                             ING Asian Debt Strategy
Asia vs other EM: better fiscal dynamics, lower inflation

                                   Inflation                                                        Public debt as % GDP
 8%                                                                          60%

 6%                                                                          50%

                                                                             40%
 5%
                                                                             30%                                                             Source: Credit Suisse (EM
 3%                                                                                                                                          Quarterly, January 2012)
                                                                             20%                                                             Aggregates for regions are
                                                                                                                                             weighted by 2010 nominal GDP
 2%                                                                                                                                          ($bn) figures. Asia doesn't
                                                                             10%
                                                                                                                                             include Japan.
 0%                                                                           0%
                     Asia              EMEA             LatAm                                Asia                EMEA           LatAm
                   2009     2010      2011E    2012F     2013F                        2009          2010      2011E     2012F     2013F

                                                       Current account surplus/deficit
             20
                                                                                                                                    2011   2012E
             15

             10
  % of GDP

              5

              0

              -5

             -10
                                ico

                                    y

                           In a
                          M a
               N ai a

                          St pt

                                  m
                       H an

                                 lia

                                   e
                           st l
                       do d

                       Po ka
                         Ire ry

                       Z e ain
                       Vi ia*
                      Th any

                        G al
                                na

                      ilip rea
                                   n

                                nd
                        R ng
                         g s

                         iL d
                                es
                      M ore

                      Au zi
                         ro a
                                  s
                     G sia

                      ut It al
                               ric
                                 e
                                si

                              ec
                    In lan
                     on d
                             wa

                    Eu esi
                              ne

                     Sr lan
                   te Egy
                             ga

                               g
                             na
                               a
                             Ar

                             ra
                            ex
                              p

                            an
                             la
                            Ko

                             at

                              d
                            ay

                 H rlan

                             hi

                ew Sp

                           rtu
                            Af
                           Br
                 Ph Ko
                           us
                            p

                            m

                          Ja

                           re
                           pi
                          ai

                          et
                         un
                          C

                           n

                           a
             a
                         al

                        er

                         h
                        T
          ng

                      he

                       d
       Si

                 et

                So
                ni

              N
              U

                                                       Source: CEIC, Haver, CIRA, Citigroup, March 2012
                                                       * India current account based on March data (fiscal year end)

For professional investors use only and not for use in public                            3                                                  ING Asian Debt Strategy
Sovereigns debt levels and trend

            Asia-Pacific sov. debt/GDP                                                 US & Europe sov. debt/GDP

                                     % of GDP                                                      % of GDP
     Source: Moody’s Investor Service, Asia-Pacific Sovereigns in 2012 and Beyond, February 2012

       Asian (ex-Japan) sovereign debt ratios are in good shape relative to their
        developed-market peers

  ForAsian
ING   professional
           Debt investors use only and not for use in public                           4                           ING Asian Debt Strategy
Primary Asian Debt strategies

         Asian Debt Hard Currency                                     Asian Debt Local Currency

       Credit risk dominant                                         FX and interest rate risk dominant
       Asia risk remuneration in form of credit                     Direct link to domestic macro cycle
        spread                                                       Mainly government debt: corporate debt
       Increasingly a corporate asset class                          markets still developing

         Hard-currency sovereigns                                    LC Money
                                                                     Local-currency government
              and corporates                                           Market bonds

        Dedicated track record since 1996                             Dedicated track record since 2008
                                                                     Co-manage global LC EMD strategy
                                                                                 since 1998

For professional investors use only and not for use in public   5                                      ING Asian Debt Strategy
Growth of Asian bond market

           Asia ex-Japan has grown to become world’s 4th                                                                                                Daily
           largest bond market                                                                                          Country        Bid/Ask        Turnover
                                                                                                                                                      (US$bn)

           8.0                                                                                                      China                3               4.0
                       Foreign CCY                                                                                  Hong Kong            2-3            12.0*
           7.0
                       Local CCY                                                                                    India                1-2             3.1
           6.0                                                                                                      Indonesia           5-10             0.5
                                                                                                                    Korea                1-2             8.9
           5.0
                                                                                                                    Malaysia             2-4             0.7
USD, trn

           4.0                                                                                                      Philippines         5-15             0.3
                                                                                                                    Singapore            2-3             1.6
           3.0
                                                                                                                    Taiwan              0.5-2            1.5
           2.0                                                                                                      Thailand             3-6             0.1

           1.0                                                                                                      Australia            1               3.8
                                                                                                                    New Zealand          2               0.5
           0.0
                                                                                                                    Russia              10-13            0.3
                 1997 1998 1999 2000 2001 2002 2003 2004 2005 2006 2007 2008 2009 2010 2011
                                                                                       (Sep)                        Brazil               1-4             2.1
                                                                                                                    Mexico               2               1.4
            Sources: ING Investment Management; BIS, ADB, HSBC; and, Bloomberg L.P. Local-currency Daily Turnover   * Excludes bills
            translated to USD based on 31 March 2012 FX rates from Bloomberg.

           For professional investors use only and not for use in public                      6                                            ING Asian Debt Strategy
Asia: Ratings trend – Foreign currency ratings

 Investment grade
   10
  Aaa
                                                                                                         Singapore    While developed-
  9.5
  Aa1
    9
  Aa2                                                                                                    HK            market sovereign
  8.5
  Aa3
    8
   A1                                                                                                    China         issuers face
  7.5
   A2
    7
   A3                                                                                                    Taiwan        significant
  6.5
 Baa1
    6
 Baa2                                                                                                    Malaysia      challenges as
  5.5
 Baa3
    5
  Ba1                                                                                                    Korea         reflected by
  4.5
  Ba2                                                                                                    Thailand
    4
  Ba3                                                                                                                  downgrades, the
  3.5
   B1                                                                                                    India
    3
   B2                                                                                                                  rating trend for
  2.5
   B3                                                                                                    Indonesia
    2                                                                                                                  Asian sovereign
    2001      2002    2003     2004     2005     2006    2007   2008    2009    2010    2011 Apr-12                    issuers continues to
                                                                                                                       develop positively.
 High yield
 Baa3
  5.5
  Ba1
    5
                                                                                                      Philippines
  4.5
  Ba2
    4
  Ba3                                                                                                 Sri Lanka
  3.5
   B1
                                                                                                      Vietnam
    3
   B2
  2.5
   B3                                                                                                 Pakistan
    2
 Caa1
  1.5
    2001     2002     2003     2004    2005     2006    2007    2008   2009    2010    2011 Apr-12

 Source: Moody’s Foreign Currency Ratings as of 30 April 2012

For professional investors use only and not for use in public                     7                                        ING Asian Debt Strategy
Asia: Ratings trend – Local currency ratings

                    Investment grade
                     Aaa
                      10                                                                                                        Singapore
                     9.5
                     Aa1
                     Aa2
                       9                                                                                                        HK
                     8.5
                     Aa3
                       8
                      A1                                                                                                        China
                     7.5
                      A2
                       7
                      A3                                                                                                        Taiwan
                     6.5
                    Baa1
                       6
                    Baa2                                                                                                        Malaysia
                     5.5
                    Baa3
                       5
                     Ba1                                                                                                        Korea
                     4.5
                     Ba2
                       4
                     Ba3                                                                                                        Thailand
                     3.5
                      B1
                       3
                      B2                                                                                                        India
                     2.5
                      B3
                        2                                                                                                       Indonesia
                        2001     2002      2003     2004     2005     2006     2007     2008        2009   2010   2011 Apr-12

                    High yield
                    Baa3
                     5.5
                     Ba1
                       5
                                                                                                                                Philippines
                     4.5
                     Ba2
                       4
                     Ba3                                                                                                        Sri Lanka
                      3.5
                       B1
                                                                                                                                Vietnam
                        3
                       B2
                      2.5
                       B3                                                                                                       Pakistan
                       2
                    Caa1
                      1.5
                        2001      2002     2003     2004     2005     2006     2007     2008        2009   2010   2011 Apr-12

 Source: Data based on Moody’s, data as of 30 April 2012.
 Note: No local-currency debt rating from Moody’s for Sri Lanka, S&P rating used in lieu thereof.

For professional investors use only and not for use in public                              8                                                  ING Asian Debt Strategy
Asian Debt: complementary to global EMD

           JPM EMBI Global Diversified: Small Asian weight

                                            Middle East
                                               4.7%
                                                                                           Sri Lanka
           Latin                                     Africa                        China
                                                                                             4.8% Vietnam
          39.1%                                                                    12.9%
                                                     6.0%                                            3.6%
                                                                                                          Pakistan
                                                                                                           1.9%
                                                                        Malaysia
                                                                         13.1%

                                                           Asia
                                                          18.7%
                                                                                                               Philippines
                                                                                                                 32.7%
                                                                      Indonesia
                                                                        31.1%

                   Europe
                   31.6%

Source: JPMorgan, as of 30 April 2012.

Most of Asia solid investment grade: Hong Kong, Singapore, South Korea and Taiwan not ‘emerging’,
Malaysia soon to follow. No corporate debt in JPM Emerging Market Bond Index.

For professional investors use only and not for use in public     9                                                     ING Asian Debt Strategy
Asian HC Bonds: JPMorgan Asia Credit Index

              Duration:                             5.49 years                                        Outstanding issues:                         458
              Yield:                                4.96%                                             Outstanding issuers:                        214
              Market Cap:                           $313bn                                            Average Rating:                      Baa3/BBB-#

                 Country                                                            Sector                                                        Rating
                            Others                                                       Utilities                                                    NR    AAA
                    India                                                                                                                       B
                             2%                                              Oil & Gas     4%                                                         4%     2% AA
                     8%                                                                                                                        5%               6%
                                            Korea                      Media & 5%                        Sovereign
                                             22%                       Telecom                             22%
       China
                                                                         3%
       13%
                                                                                                                                    BB
                                                                                                                                   20%
                                                                                                                                                                          A
                                                                Industrials                                                                                              36%
Philippines                                                        26%
                                                    Hong Kong
   13%
                                                       16%

     Thailand
                                                                                                            Quasi-Sov
       2%
                                                                                                              21%                           BBB
              Malaysia                Singapore
                       Indonesia                                                 Financials                                                 27%
                4%                       7%
                          13%                                                       19%

     Source: JPMorgan as of 31 March 2011.
     # The average rating of the Fund is determined by calculating the portfolio’s weighted average security rating factors. Security rating factors are based on the
     security’s Moody’s rating or, if not available, the security’s S&P rating.

   For professional investors use only and not for use in public                                 10                                                         ING Asian Debt Strategy
Asian LC Bonds: HSBC Asia Local Bond Index

     HSBC Asia Local Bond Index

                        Duration:                                5.36 years                           Outstanding issues:                                    919
                        Yield:                                   3.77%                                Outstanding issuers:                                   230
                        Market Cap:                              US$1,256bn                           Average Rating#:                               Baa2 / BBB

                    Country                                                            Sector                                                      Rating
                        China                                                        Financial    Utilities                                           Not Rated
                                      India                                                                                                                              AAA
                        11%                                                             7%          2% Consumer                               BB         5%
                                       6%
      Philippines                                                                                           1%                                                           18%
                                                                                                                                              5%
          5%                                    Hong Kong                                                   Industrial
                                                   13%                                                         2%

Indonesia
   13%
                                                                                                                                   BBB                                             AA
                                                      Malaysia                                                                     27%                                             15%
                                                       10%

 Thailand
   8%

                                              Korea
            Singapore                          16%                                                                                                             A
                            Taiw an                                                   Government
               15%                                                                                                                                            30%
                              3%                                                         88%

  Source: HSBC Asian Local Bond Index as of 31 January 2012
  # The average rating of the Fund is determined by 1) average of the three or, if not available, 2) the lower rating of the available two rating agencies or 3) the ratings of the sole
  agency that is providing the rating for security. If they do not fall in the above options, they will be classified as not rated.

  For professional investors use only and not for use in public                                  11                                                                 ING Asian Debt Strategy
Asian Debt: 5 year historical returns and volatility

                                                    Asset Category                      Return          Risk                  Return per Risk
                                                    Asia USD Bonds                         7.46%           9.77%                   0.76
                                                    US Treasuries                          6.38%           5.26%                   1.21

                          sov. debt
                                                    European Govt Bonds                    4.74%           4.35%                   1.09
                                                    UK Gilts                               7.83%           6.45%                   1.21
                                                    Global EM Debt                         8.25%          10.85%                   0.76
                                                    Asian LC Bonds                         6.73%           8.10%                   0.83
                                                    Asian IG Corp                          6.60%           9.14%                   0.72
                          equities corporate debt

                                                    Asian HY Corp                          8.49%          21.00%                   0.40
                                                    US IG Corp                             6.94%           7.47%                   0.93
                                                    US HY Corp                             8.10%          14.28%                   0.57
                                                    European IG Corp (Unhedged)            4.44%           4.88%                   0.91
                                                    European HY Corp (Unhedged)            8.18%          16.90%                   0.48
                                                    World Equities                        -0.13%          20.71%                   -0.01
                                                    EM Equities                            2.37%          22.33%                   0.11
                                                    Asian Equities                         5.62%          28.50%                   0.20
                                                    European Equities                     -6.51%          18.22%                   -0.36
               Source: JPMorgan, HSBC, Barclays
               Based on annualized USD monthly returns for 5 years as of 31 March 2012, monthly returns are based on local currency returns of the various
               asset classes.

               Asian Debt has provided investors with relatively high returns
               In times of financial market stress, Asian Debt market volatility has been
                relatively high due to the relatively illiquid nature its corporate segment
               Relative inefficiency of Asian Debt market (under-researched) provides
                opportunity for alpha generation

For professional investors use only and not for use in public                        12                                                              ING Asian Debt Strategy
Correlation of Asian Debt with other asset classes

                                                                                         Asian USD       Asian LC       Asian USD Asian USD
                                       Asset Category                                      Bonds          Bonds          IG Corp   HY Corp
                                       US Treasuries                                        0.14            0.19             0.19           -0.13
                         sov. debt

                                       European Govt Bonds                                  0.11            0.15             0.14           -0.07
                                       UK Gilts                                             0.13            0.18             0.14           -0.10
                                       Global EM Debt                                       0.97            0.66             0.93           0.90
                                       Asian LC Bonds                                       0.59            1.00             0.50           0.54
                                       US IG Corp                                           0.80            0.59             0.82           0.70
                       corporate
                         debt

                                       US HY Corp                                           0.74            0.56             0.68           0.81
                                       European IG Corp (Unhedged)                          0.64            0.48             0.63           0.66
                                       European HY Corp (Unhedged)                          0.65            0.33             0.62           0.78
                                       World Equities                                       0.66            0.62             0.59           0.74
                         equities

                                       EM Equities                                          0.68            0.57             0.61           0.78
                                       Asian Equities                                       0.68            0.68             0.60           0.77
                                       European Equities                                    0.57            0.49             0.50           0.67
              Source: Barclays, HSBC, JP Morgan
              Based on annualized USD monthly returns for 5 years as of 31 March 2012. Monthly returns are based on local currency returns of the various
              asset classes.

               Inclusion of Asian Debt aids diversification

For professional investors use only and not for use in public                       13                                                              ING Asian Debt Strategy
Asian vs Global government bond yields

                        Attractive yield pick up
                                7

                                6

                                5

                                4
                    Yield (%)

                                3

                                2

                                1

                                0
                                 2002   2003     2004     2005      2006   2007        2008   2009   2010   2011   2012

                                                               HSBC Asian Local Bond Index
                                                               Citi World Government Bond Index

                          Source: Bloomberg. As of 31 March 2012.

For professional investors use only and not for use in public                     14                                      ING Asian Debt Strategy
Asia debt: attractive risk adjusted returns

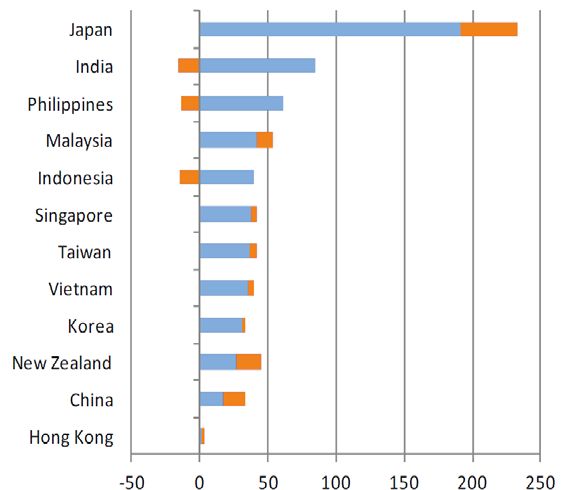
                 Asia HC debt vs. Asia equity                                                                                                       Asia LC debt vs. Asia equity
      250                                                                                                                                250

      200                                                                                                                                200

      150                                                                                                                                150

      100                                                                                                                                100

          50                                                                                                                              50

      -                                                                                                                                    0

                                                                                                                                                                                            May-05

                                                                                                                                                                                                                                                  May-10
                                                                                                                                               Mar-01

                                                                                                                                                                 Nov-02

                                                                                                                                                                                                     Mar-06

                                                                                                                                                                                                                       Nov-07

                                                                                                                                                                                                                                                           Mar-11
                                                                                                                                                        Jan-02

                                                                                                                                                                          Sep-03
                                                                                                                                                                                   Jul-04

                                                                                                                                                                                                              Jan-07

                                                                                                                                                                                                                                Sep-08
                                                                                                                                                                                                                                         Jul-09

                                                                                                                                                                                                                                                                    Jan-12
               Nov-99

                        Nov-00

                                 Nov-01

                                          Nov-02

                                                   Nov-03

                                                            Nov-04

                                                                     Nov-05

                                                                              Nov-06

                                                                                       Nov-07

                                                                                                Nov-08

                                                                                                         Nov-09

                                                                                                                  Nov-10

                                                                                                                           Nov-11

                                                   JP Morgan Asia Credit Index                                                                                                     HSBC Asia Local Bond Index

                                                   MSCI Asia ex-Japan Index                                                                                                        MSCI Asia ex-Japan Index

Note: JP Morgan Asia Credit Index and MSCI Asia ex-Japan Index reset at 100 as                                                           Note: HSBC Asia Local Bond Index and MSCI Asia ex-Japan reset at 100 as
per 30 Nov, 1999                                                                                                                         per 30 Mar, 2001
Source: Bloomberg, HSBC, JP Morgan, data expressed as of 31 March 2012.

For professional investors use only and not for use in public                                                                       15                                                                                                              ING Asian Debt Strategy
Expertise in Asian Debt among a broad range of strategies

            Hard Currency (HC) Debt                                                   Local Currency (LC) Debt

                                                                                                                              EMD L
   Asia HC                  EMD HC                  Global HY                   Asia LB             EMD LC
                                                                                                                               Bond

Asia Exposure             Asia Exposure            Asia Exposure              Asia Exposure       Asia Exposure           Asia Exposure
       100%                    +/-15%                    +/- 5%                   100%                +/- 25%                 +/- 30%

   Benchmark                Benchmark                Benchmark                 Benchmark           Benchmark                Benchmark
   JPM Asia Credit          JPM Emerging            BarCap Composite          HSBC Asian Local      JPM Emerging           JPM Global Bond
    Index (JACI)          Markets Bond Index        U.S. / Europe High        Bond Index (ALBI)   Local Markets Index      Index - Emerging
                             – Global Div              Yield Index                                   Plus (ELMI+)              Markets
                              (EMBI GD)                                                                                      (GBI EM GD)

  Total assets managed by the Asian Debt Team is USD 4.9 bln as of 31 March 2012

For professional investors use only and not for use in public            16                                             ING Asian Debt Strategy
ING Investment Management Asian Fixed Income Team

                                               Desmond Lim                           Wee Lee Cheng
                                              Portfolio Assistant                    Sr. Credit Analyst

                                                                 Rob Drijkoningen               Clement Chong
                                                                     Co-head,                   Sr. Credit Analyst
                                                                Emerging Market Debt

                                                      Joep Huntjens      Prashant Singh, CFA
                                                       Sr. Investment       Sr. Investment         Sean Jutahkiti, CFA
                                                          Manager              Manager
                                   Economist                                                        Sr. Credit Analyst
                                                      (Hard Currency)      (Local Currency)
                                  (in Progress)
                                                                Michael Reyes, CFA
                                                                Investment Manager
                                                              (HC Sov, Primary Trader )
                                                                                              Yuan Xing Pek, CFA
                                                                                               Credit Analyst

                                                                Peter Sengelmann, CFA
                                                                Client Portfolio Manager

                       As of 30 April 2012

For professional investors use only and not for use in public               17                                           ING Asian Debt Strategy
Integration with EMD teams and Credit teams in other regions

                                                         Asia (Singapore)           Europe (The Hague)     Americas (Atlanta)
                Em. Markets

                 Rates & FX                                 Asia Focus                 EMEA Focus             LatAm Focus
                 Sovereign,

                   Focus
                                                          Prashant Singh            Head of Global EMD     3 Portfolio Managers
                                                           Michael Reyes                1 Strategist         1 Credit Analyst
                                                        Economist (Vacancy)         3 Portfolio Managers
                                         Inv. Grade

                                                            Asia Focus                Europe Focus             US Focus
                Corporate Credit Focus

                                                                                    4 Portfolio Managers   6 Portfolio Managers
                                                                                      5 Credit Analysts      6 Credit Analysts
                                                          Joep Huntjens
                                                          Wee Lee Cheng
                                                          Sean Jutahkiti              Europe Focus             US Focus
                                         High Yield

                                                          Clement Chong
                                                          Yuan Xing Pek
                                                                                    Head of Global HY      2 Portfolio Managers
                                                                                    1 Portfolio Manager      5 Credit Analysts
                                                                                     3 Credit Analysts

                                                      ING IM Asian Debt Team

For professional investors use only and not for use in public                  18                                        ING Asian Debt Strategy
ING (L) Renta Fund Asian Debt (Hard Currency)
Characteristics

Objectives

Investment objective                      : Outperform the JP Morgan Asia Credit Composite Index over a 3 year period, with a target information ratio of 0.5

Benchmark                                 : JP Morgan Asia Credit Composite Index

Target tracking error                     : 1% to 3%

Other characteristics
                                              Debt instruments denominated mainly in USD, issued by issuers from Asian countries, such as China, Hong
Investment universe                       :
                                              Kong, India, Indonesia, Malaysia, South Korea, Philippines, Singapore, Taiwan and Thailand.
Investment style                          : Multi-alpha, fundamental, bottom-up driven

                                              Up to 1/3rd of the portfolio can be invested in debt issued in Asian currencies (off-benchmark), Yen or Euro.
Currency exposure                         :
                                              Currency risk is actively managed.

Single holding exposure                   : Maximum single holding 10%
                                              Total assets approx USD 541m (as of 31 March 2012)
Assets under management                   :
                                              Mutual fund assets USD 158.50m (as of 30 April 2012)
Effective yield                           : 4.93% (as of 30 April 2012)

Weighted average duration                 : 5.01 (as of 30 April 2012)

                                            •    Attractive risk - return characteristics for Asian debt market
                                            •    Diversification benefits
Benefits                                  :
                                            •    International investors underinvested, although this may not change soon
                                            •    Capitalise on Asian debt market inefficiencies via multi-alpha strategy

For illustration purposes only and the information is not an indicator of future performance.

For professional investors use only and not for use in public                                   19                                        ING Asian Debt Strategy
Strong track record in Asian Debt (Hard Currency)

Performance (%)
As of 30 April 2012
                                                                                                                                        Rolling Annualized
                                                                 3 Months            6 Months           1 Year               3 Years               5 Years            10 Years
 ING (L) Renta Fund Asian Debt (Hard Currency)                          3.27              5.12             7.15                16.64                  9.07                 9.16
 – P Cap
 JP Morgan Asia Credit Composite Index*                                 3.06              5.02             7.00                12.25                  7.55                 7.71

 Value Added                                                            0.21              0.10             0.15                  4.39                 1.52                 1.45

Source: ING Investment Management Europe. Gross performance in USD with dividend reinvested. All data are expressed as of 30 April 2012.
*Benchmark of this strategy changed from JP Morgan EMBI Global Diversified – Asia to JPMorgan Asia Credit Index (JACI) - Sovereign & Quasi-sovereign on March 1, 2004.
On June 1, 2005, benchmark changed from JACI - Sovereign & Quasi sovereign to JPMorgan Asia Credit Composite Index, representing a better diversified index with less
concentration to individual issuers such as the Philippines government. The benchmark is using gross series in USD.
Performance quoted above is historical and does not guarantee future results.

Star ratings & recent awards - ING (L) Renta Fund Asian Debt (Hard Currency)

       
   1Overall Morningstar Rating™

                                 2   Best Bond Asia Pacific Fund          3   Best Bond Asia Pacific Fund    4   Best-in-Class Fund for the
                                                                                                                                                   5 Winnerof AsianInvestor 2012
                                                                                                                                                     Investment Performance
   1   3-year Morningstar Rating™              over 3 & 5 years                        over 3 & 10 years                Asia Bond category           Awards - Hard currency
                                                                                                                                                             Category

1 © 2012 Morningstar, Inc. All right reserved Morningstar RatingTM as of 30 April 2012.
2 Lipper Fund Awards 2012 Hong Kong reflect fund’s performance as at 31 December 2011.
3 Lipper Fund Awards 2012 Singapore reflect fund’s performance as at 31 December 2011.
4 Benchmark 100 Funds of the Year 2011 is based on the performance as of 31 December 2011.
5 AsianInvestor 2012 Investment Performance Awards is based on the performance as of 31 December 2011.

For professional investors use only and not for use in public                              20                                                            ING Asian Debt Strategy
ING Asian Debt Local Bond Strategy
Typical characteristics

Objectives

Investment objective                     :   Outperform the HSBC’s Asian Local Bond Index over a 3 year period, with a target information ratio of 0.5

Benchmark                                :   HSBC’s Asian Local Bond Index (ALBI) ex China, India

Target tracking error                    :   1% to 3%

Other characteristics

                                             Debt instruments denominated in local currency, issued by issuers from Asian countries, such as China, Hong
Investment universe                      :
                                             Kong, India, Indonesia, Malaysia, South Korea, Philippines, Singapore, Taiwan and Thailand

Investment style                         :   Multi-alpha, fundamental, bottom-up driven

                                             Benchmark currencies + USD (max 10%);
Currency exposure                        :
                                             Max. 10% deviation per currency from benchmark weight

Single holding exposure                  :   Maximum single holding 10%

                                             Total assets approx. USD 1.2bn (as of 31 March 2012)
Assets under management*                 :
                                             Mutual fund assets USD 83m (as of 30 April 2012)
* Dedicated Asian Debt LC funds.
Source ING IM Asia Pacific
For illustration purposes only and the information is not an indicator of future performance.

For professional investors use only and not for use in public                               21                                       ING Asian Debt Strategy
Asian Debt Local Bond Mandate

Performance (%)
As of 31 March 2012
                                                                                                                                                      Rolling
                                                                                                                                                   Annualised
                                                              1 Month             3 Months                 6 Months                1 Year              3 Years

 ING Asian Debt Local Bond Strategy                              -1.80                  2.70                     5.58                 6.60               13.78

 HSBC ALBI (customized)*                                         -1.88                  2.49                     4.98                 6.56               12.06

 Value Added                                                      0.08                  0.21                     0.60                 0.04                 1.72

 Source: ING Investment Management Asia Pacific, Performance Measurement. Gross performance in USD with dividend reinvested. All data are expressed
 as of 31 March 2012.
 Inception date: 14 May 2008.
 *The benchmark is customized based on the HSBC Asian Local Bond Index, and is displayed using gross series in USD.

 Note: ING IM has extensive experience in managing Asian debt local currency as an integrated part of our Global Emerging Market Local Currency (EMD LC)
 strategies, and has been running institutional mandates dedicated to Asian local currency debt since mid-2008. The performance shown is for reference only
 and is the not the track record of a fund. Different fee structures and charges will apply to the ING (L) Renta Fund Asian Debt (Local Bond) fund (the “Fund”).
 The performance shown does not indicate how the Fund will perform. The Fund has a broader investment universe and a broader corresponding customized
 benchmark.

 Performance quoted above is historical and does not guarantee future results.

For professional investors use only and not for use in public                             22                                                                ING Asian Debt Strategy
Summary ING Asian Debt Strategy

   Clear and proven investment philosophy

   Large and experienced specialist team based in Asia (Singapore)

   Strong track record (both absolute and relative)

   Favourable balance of moderate risk and attractive returns

   Availability via Luxembourg based Funds (UCITS) with daily trading and various share
    classes (hedged/ unhedged)

For professional investors use only and not for use in public   23          ING Asian Debt Strategy
Ansprechpartner

                                                                        - Niederlassung Deutschland -

                                                                                    Westhafenplatz 1
                                                                                     60327 Frankfurt
                                                                                        Web: www.ingim.de

                        Susanne Hellmann                             Michael Schrinner
                        Managing Director                            Senior Sales Director Institutionals

                        Tel.:     +49 69 / 50 95 49 – 21             Tel.:   +49 69 / 50 95 49 – 13
                        Fax:      +49 69 / 50 95 49 – 30             Fax:    +49 69 / 50 95 49 – 31
                        Email: susanne.hellmann@ingim.com            Email: michael.schrinner@ingim.com

For professional investors use only and not for use in public   24                                          ING Asian Debt Strategy
Rechtliche Hinweise
Die in dieser Publikation enthaltenen Informationen dienen ausschließlich informativen Zwecken und stellen auf keinen Fall ein Angebot, insbesondere
einen Prospekt oder eine Aufforderung zum Handel, Kauf oder Verkauf von Wertpapieren, bzw. zur Teilnahme an einer Handelsstrategie, dar. Diese
Publikation ist ausschließlich für professionelle Anleger bestimmt. Obwohl der Inhalt dieser Publikation mit großer Sorgfalt zusammengestellt wurde,
können wir keine - weder ausdrückliche noch stillschweigende - Gewähr für die Richtigkeit oder Vollständigkeit der Angaben übernehmen. Wir behalten
uns das Recht vor, jederzeit und unangekündigt Änderungen oder Aktualisierungen der in dieser Publikation enthaltenen Informationen vorzunehmen.
Weder ING Investment Management (die für diesen Zweck ING Asset Management (Europe) B.V. als Rechtsperson angibt) noch irgendeine andere zur
ING-Gruppe gehörende Gesellschaft oder Körperschaft noch irgendwelche Vorstandsmitglieder, Geschäftsführer oder Mitarbeiter können direkt oder
indirekt für irgendwelche in dieser Publikation enthaltenen Informationen und/oder Empfehlungen haftbar oder verantwortlich gemacht werden. Die in
dieser Publikation enthaltenen Informationen sind auf keinen Fall als Erbringung einer Investmentdienstleistung zu verstehen. Die Verwendung der in
dieser Publikation enthaltenen Informationen erfolgt ausschließlich auf eigene Gefahr. Wir sind weder direkt noch indirekt für irgendwelche Verluste oder
Schäden, die dem Leser durch die Verwendung dieser Publikation oder durch eine darauf basierende Entscheidung entstehen, haftbar. Investitionen sind
mit Risiken verbunden. Bitte beachten Sie, dass der Wert der Anlage steigen oder sinken kann und die Wertentwicklung in der Vergangenheit nicht
notwendigerweise aussagekräftig für die Wertentwicklung in der Zukunft ist und in keinem Fall als aussagekräftig betrachtet wird. Diese Publikation und
die darin enthaltenen Informationen sind streng vertraulich und dürfen zu keinem Zeitpunkt ohne unsere vorherige Zustimmung kopiert, vervielfältigt,
verbreitet oder Dritten zugänglich gemacht werden. Jegliche Ansprüche, die sich aus oder im Zusammenhang mit den Bedingungen dieses
Haftungsausschlusses ergeben, unterliegen niederländischem Recht. Für alle in dieser Publikation genannten Produkte oder Wertpapiere gelten andere
Risiken und Geschäftsbedingungen, die von jedem Anleger vor einem Anlagegeschäft einzeln durchzulesen sind. Die in dieser Publikation enthaltenen
Informationen stellen auf keinen Fall eine Werbung für den Kauf oder Verkauf von Kapitalanlagen bzw. für die Zeichnung von Wertpapieren dar. Bezüglich
der in dieser Publikation genannten Produkte oder Wertpapiere sind möglicherweise weitere Informationen über bestimmte für diese Produkte oder
Wertpapiere geltende Beschränkungen aufgrund der jeweiligen gesetzlichen Bestimmungen erforderlich. Diese Publikation ist nicht als Werbung für den
Kauf oder Verkauf von Kapitalanlagen bzw. für die Zeichnung von Wertpapieren gedacht und auch nicht für Personen in Ländern bestimmt, in denen die
Verbreitung solcher Materialien aufgrund geltender Vorschriften oder Gesetze verboten ist. Allein verbindliche Grundlage für den Erwerb von ING
Investmentfonds sind die jeweiligen Verkaufsprospekte mit Risikohinweisen und ausführlichen Informationen, die Sie kostenlos bei ING Asset
Management B.V., Niederlassung Deutschland, Westhafenplatz 1, 60327 Frankfurt am Main, oder unter [www.ingim.de] erhalten.

For professional investors use only and not for use in public            25                                                    ING Asian Debt Strategy
You can also read