Company Presentation - Befesa

Page created by Roger Cross
 
CONTINUE READING
Company Presentation - Befesa
Company Presentation

February 2021
Company Presentation - Befesa
Disclaimer
This presentation contains forward-looking statements and information relating to Befesa and its affiliates that are based on the beliefs of its management, including
assumptions, opinions and views of Befesa and its affiliates as well as information cited from third party sources. Such statements reflect the current views of Befesa and
its affiliates or of such third parties with respect to future events and are subject to risks, uncertainties and assumptions.

Many factors could cause the actual results, performance or achievements of Befesa and its affiliates to be materially different from any future results, performance or
achievements that may be expressed or implied by such forward-looking statements, including, among others: changes in general economic, political, governmental and
business conditions globally and in the countries in which Befesa and its affiliates do business; changes in interest rates; changes in inflation rates; changes in prices;
changes to national and international laws and policies that support industrial waste recycling; legal challenges to regulations, subsidies and incentives that support
industrial waste recycling; extensive governmental regulation in a number of different jurisdictions, including stringent environmental regulation; management of exposure
to credit, interest rate, exchange rate and commodity price risks; acquisitions or investments in joint ventures with third parties; inability to obtain new sites and expand
existing ones; failure to maintain safe work environments; effects of catastrophes, natural disasters, adverse weather conditions, unexpected geological or other physical
conditions, or criminal or terrorist acts at one or more of our plants; insufficient insurance coverage and increases in insurance cost; loss of senior management and key
personnel; unauthorised use of Befesa’s intellectual property and claims of infringement by Befesa of others’ intellectual property; Befesa’s ability to generate cash to
service its indebtedness changes in business strategy and various other factors. Should one or more of these risks or uncertainties materialise, or should underlying
assumptions prove incorrect, actual results may vary materially from those described herein as anticipated, believed, estimated, expected or targeted.

Befesa and its affiliates do not assume any guarantee that the assumptions underlying forward-looking statements are free of errors nor do they accept any responsibility
for the future accuracy of the opinions expressed herein or the actual occurrence of the forecasted developments. No representation (express or implied) is made as to,
and no reliance should be placed on, any information, including projections, estimates, targets and opinions, contained herein, and no liability whatsoever is accepted as
to any errors, omissions or misstatements contained herein or otherwise resulting, directly or indirectly, from the use of this document.

This presentation is intended for information only and should not be treated as investment advice. It is not intended as an offer for sale, or as a solicitation of an offer to
purchase or subscribe to, any securities in any jurisdiction. Neither this presentation nor anything contained therein shall form the basis of, or be relied upon in connection
with, any commitment or contract whatsoever. This presentation may not, at any time, be reproduced, distributed or published (in whole or in part) without prior written
consent of Befesa.

Full year preliminary figures contained in this presentation are currently being audited by external auditors.

This presentation includes Alternative Performance Measures (APM), including EBITDA, EBITDA margin, net debt and capital expenditures which are not measures of
liquidity or financial performance under International Financial Reporting Standards (IFRS). EBITDA is defined as operating profit for the period (i.e. EBIT) before the
impact of amortisation, depreciation, impairment and provisions. EBITDA margin is defined as EBITDA divided by revenue. EBIT is defined as Operating profit for the year.
The Company uses EBIT to monitor its financial return after both operating expenses and a charge representing the cost of usage of both its property, plant and
equipment and definite-life intangible assets. EBIT margin is defined as EBIT as a percentage of revenue. These non-IFRS measures should not be considered in isolation
or as an alternative to results from operating activities, cash flow from operating, investing or financing activities, or other financial measures of Befesa’s results of
operations or liquidity derived in accordance with IFRS. Befesa believes that the APM included in this report are useful measures of its performance and liquidity. Other
companies, including those in the industry in which Befesa operates, may calculate similarly titled financial measures differently than Befesa does. Because all companies
do not calculate these financial measures in the same manner, Befesa’s presentation of such financial measures may not be comparable to other similarly titled measures
of other companies. These APM are not audited.

2    Company Presentation – February 2021
Company Presentation - Befesa
Befesa at a glance
Market leader in Europe & Asia in providing regulated critical hazardous waste recycling services to the steel and
aluminium industries

                             FY 2020                                                          Steel Dust Recycling                                          Aluminium Salt Slags Recycling

                           €604m
                               Revenue1)                                                                 #1                                                                     #1
                                                                                                   Position in Europe in                                       Position in Europe in salt slags subsegment
                                                                                           (c. 45-50% market share) and Asia                                             (c. 45-50% market share)
            35%
        2nd Aluminium

                                                             54%
                                                            Steel Dust
                                                                                                      28%                                                                    25%
                                                                                                      EBITDA margin                                             EBITDA margin in salt slags subsegment2)
                    11%                                                                                 (FY 2020)                                                             (FY 2020)
                   Salt Slags

                           €127m
                                EBITDA                                                                >15yrs                                                              >15yrs
                10%                                                                                    Relationships                                                         Relationships
            2nd Aluminium

          13%
         Salt Slags

                                                           77%
                                                          Steel Dust

Source: Company information, International Consulting Firm based on World Steel Association’s Steel Statistical Yearbooks, WBMS, industry research, expert Interviews.
1)   Excluding internal revenue; revenue split is calculated on revenues including internal revenue
2)   Including recycling of SPL (a hazardous waste generated in primary aluminium production)

3         Company Presentation – February 2021
Company Presentation - Befesa
Key milestones
      Befesa has grown successfully through organic initiatives and acquisitions
                                                                                                                                             EAFD expansion China
                                                                                                                                            Developing first two EAFD
                                                                                                EAFD expansion Korea & Turkey               recycling plants in China:
                                   Secondary aluminium plant in Bernburg                          Doubled capacity to 220 kt, Gyeongju            Changzhou, Jiangsu:
                                                                                                                                                  Completion of construction
                                                     Triton acquired Befesa
                                                                                                                                                  expected during Q1 2021
                                                                                                       1st WOX washing plant in Asia,
                         Entry in the Asian market2)                                                   close to Gyeongju plant
                                                                                                                                                  Xuchang, Henan:
                                                                                                       EAFD recycling capacity at                 Completion of construction
              WOX washing plant at Gravelines
                                                                                                       Iskenderun expanded to 110 kt              expected after summer ‘21
      Entry in the Turkish market1)

1987 1993 2000 2006                 2009           2010          2012      2013          2014   2015            2017          2018           2019         2020           2021

                                                                                                                                                         Since 18 Sep 2020,
                                              European leader in salt slags recycling,                                                                   member of
                                              acquiring Agor AG’s German assets

                                  Befesa acquired remaining stake in BUS,                                                            Entry to SDAX3)
                                  becoming European leader in EAFD recycling                                                         on 24 Sep 2018
                                                                                                                                                         Rated by:
                        Abengoa acquired Befesa from BUS

             Berzelius Umwelt Service (BUS) grouped their                                                              Successful IPO on
             Spanish assets into Berzeilius Felguera (Befesa)                                                          Frankfurt Stock Exchange

    Founded in Germany, Metallgesellschaft

      1) Through 51/49 JV with Canadian Silvermet
      2) By acquiring subsequent stakes in the Korean Hankook
      2) Free-float at 100% after Triton’s exit on 6 June 2019

        4     Company Presentation – February 2021
Company Presentation - Befesa
Market leader in Europe & Asia
                        Befesa is the market leader in steel dust and salt slags recycling services with a competitive advantage
                        due to its close-proximity to key clients
                                                                                                                                                                                          EAFD recycling plants

                                       Lünen                                                                                                                                              Salt slags & SPL recycling plants

                                                                        Hannover                                                                                                          Clients
                        Duisburg

                                                                             Freiberg                                                                                                                   Jiangsu & Henan2)
Fouquières
-lès-Lens1)
Asúa-Erandio
                                                                                           Iskenderun
                                                                                                                                                                                                                                       Gyeongju

Valladolid

                             Note: Footprint reflects only Befesa’s core recycling services – Steel Dust and Salt Slags & SPL

                        Europe                                                                                                                                           Europe
 STEEL DUST RECYCLING

                                                                                                                                              ALU SALT SLAGS RECYCLING
                                                 Capacity in kt                   Market share in %                                                                                    Capacity in kt              Market share in %

                                     #2                                                                                                                                           #2

                                     #3                                                                                                                                           #3

                        Asia                     Capacity in kt                   Market share in %

                                     #2

                                     #3

                        1)   50/50 joint venture with Recylex
                        2)   Chinese plants under construction: Changzhou, Jiangsu, cold and hot commissioning completed in March/April 2021; Xuchang, Henan, completion of construction expected after the summer of 2021

                        5         Company Presentation – February 2021
Highly regulated & critical service model
Befesa is the leading environmental services partner in the circular economy of the 2 nd steel & aluminium industry by
recycling and avoiding the landfilling of c. 1.5 MT hazardous waste and recovering c. 1.3 MT of new valuable materials

                                               HAZARDOUS WASTE                         BEFESA RECYCLING                                OUTPUTS                                   FINAL USAGE

                                                                                                                                        234 kt                                   Filler materials
                                                                                                                                                                                  e.g. cement,
                                                   690 kt
                                                                                                                                       IRON OXIDE
                                                                                                                                                                                       roads
        EAF steelmakers /
            recyclers                               STEEL DUST                                                                          233 kt
         (mini-mills, scrap                                                                                                            WOX SOLD
            recyclers)
                                                            Service fee                                                               Sale of zinc in WOX                      Zinc smelters
                                                            c. 10-20%                                                                 c. 80-90%                             e.g. steel galvanization

                                               HAZARDOUS WASTE                         BEFESA RECYCLING                                OUTPUTS                                   FINAL USAGE

                                                                                                                                        305 kt                                  Filler materials
                                                                                                                                                                                e.g. ceramics,
                                                   485 kt
                                                                                                                                ALU OXIDE & OTHERS
                                                                                                                                                                               cement, rockwool
                                                    SALT SLAGS                                                                  157 kt + 39 kt
             Aluminium
                                                       & SPL                                                                     MELTING  ALU
             producers /
                                                                                                                                  SALT CONCENTRATE
              recyclers                                                                                                                                                     Aluminium recyclers
                                                            Service fee                                                              Sale of salt & alu conc.
                                                            c. 40%                                                                   c. 60%

All figures are the average of the fiscal years 2018, 2019 and 2020
Value chains are simplified and only reflect Befesa’s core business segments (i.e. Steel Dust; Aluminium Salt Slags):
- Within Steel Dust Recycling Services business segment Befesa manages a Stainless sub-segment (94 kt stainless steel dust throughput, average over L3Y period 2018-2020)
- Within Aluminium Salt Slags Recycling Services business segment Befesa manages a Secondary Aluminium sub-segment (173 kt 2nd aluminium alloys produced, average over L3Y period 2018-2020)

  6     Company Presentation – February 2021
Mid-term growth roadmap
Executing well defined growth roadmap even during COVID-19;
Focus 2021: Ramping up operations at the first two EAFD recycling plants in China

                                                                                                                                                               1   HEDGING
                                                                                                                                                                   •   2020: 92.4kt @ €2,239/t
                                                                                                                                                                   •   2021: 92.4kt @ c. €2,150/t
                                                                                                                                                                   •   2022: 92.4kt @ c. €2,200/t
                                                                                                                                                                   •   Up to Oct 2023: 50.7kt @ c. €2,300/t
Indicative earnings

                                                                                                                                           3
                                                                                                                                                               2   ORGANIC GROWTH
                                                                                                                                     2021+                         Top 5 projects:
                                                                                                          2
                                                                                                                                                                   • Steel Dust:
                                                                         1
                                                                                                                                                                          Turkey expansion: Completed
                                                                                                         2021/22
                                                                                                                                                                          Korea washing: Completed
                                                                                                                                                                   •   Aluminium Salt Slags:
                                                                                        Managing Variability                                                              2 tilting furnaces (Spain): Completed
                           €160m

                                                                                                                                                               3   CHINA
                                                                                                                                                                   Building first two EAFD recycling plants
 FY'19 Actual /                                           Hedging                          Organic                           China                  Mid-term
                                                                                                                                                                   in two provinces (Jiangsu and Henan)
FY'20 normalised 1)                                                                        growth                                                   business
    EBITDA                                                                                                                                            plan

                      Note: Chart is illustrative and size of respective arrows in the chart is not indicative to the underlying growth potential

                      1) FY 2020 normalised for a) Zinc LME @$2,500/t (long-term consensus), and b) TC @$225/t (~9% $2,500/t LME)

7                        Company Presentation – February 2021
Zinc prices and hedging strategy
Hedges extended to October 2023; Improved earnings & cash flows visibility

Market zinc price vs. zinc hedges (€/t)
         € 3,500
                                                                                                                                                   LME zinc                 Forwards                     Average blended

                               €2,317

         € 2,500                                                                                                                                                                                   c. €2,300
                                                                          €2,239                                         c. €2,150                                 c. €2,200
                               €2,280
                                                                          €2,136

         € 1,500
                                      2019                                     2020                                      2021                                     2022                                      2023
           Hedging price (€/t)       €2,317                                    €2,239                                   c. €2,150                               c. €2,200                                  c. €2,300
 Zinc content hedged (kt)               92.4                                    92.4                                      92.4                                     92.4                                     50.71)

           € 500

Source: London Metal Exchange (LME) zinc daily cash settlement prices; Company information

Zinc hedges & blended average prices (€/t)
                                               2019                                2020
                                                                                                                    Hedging strategy unchanged:
        Unhedged                         26% or 33kt                         33% or 46kt
                                        @ €2,276/t LME                      @ €1,979/t LME                          •    Hedges in place until and incl. October 2023 (>2.5 years)
                                                                                                                    •    Targeting 60% to 75% of zinc equivalent volume
        Hedged                            74% or 92kt                          67% or 92kt
                                          @ €2,317/t                           @ €2,239/t                           •    Majority of hedges Euro based
                                                                                                                    •    Befesa providing no collateral
        Blended2)                              €2,280                             €2,136
                                                                          -€144/t / -6% yoy
1)   As of 31 December 2020, 30.6 kt of zinc equivalent were hedged for 2023 at c. €2,300/t; Subsequently, in February 2021, additional 20.1 kt of zinc equivalent were hedged for 2023 at c. €2,300/t
2)   Zinc blended prices are annual averages computed based on the monthly effective LME zinc and hedging prices weighted with the respective hedged and non-hedged volumes
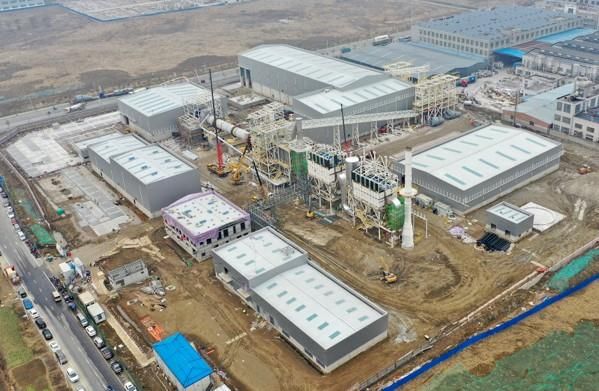
8         Company Presentation – February 2021
China I
Changzhou plant, Jiangsu province

Key facts of the plant:
•   1st EAFD recycling plant in China
•   Capacity to recycle 110kt EAFD p.a.
•   Total investment: c. €42m
•   Location: Changzhou (Jiangsu province)

Status update:
    Cold and hot commissioning planned for
    Mar/Apr
    Long-term financing closed July 2020

                                             Changzhou construction site, early February 2021
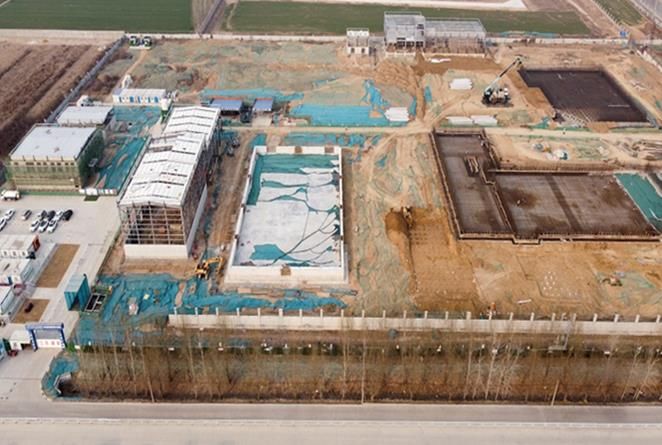
9    Company Presentation – February 2021
China II
Xuchang plant, Henan province

Key facts of the plant:
•    2nd EAFD recycling plant in China
•    Capacity to recycle 110kt EAFD p.a.
•    Total investment: c. €42m
•    Location: Xuchang (Henan province)

Status update:
     Foundation works / building structures
     progressing well; Completion expected
     after the summer of 2021
     Long-term financing closed December 2020

                                                Xuchang construction site, January 2021

10    Company Presentation – February 2021
Sustainability at Befesa
Key player within the circular economy, with c. 1.5 million tonnes recycled and c. 1.3 million tonnes of valuable
materials recovered annually, that contributes significantly to increase efficiency of raw material use in the metals
industry and promotes the transition towards a more sustainable economy

Lost Time Injury Rate (LTIR)                                           Ratings
• Excellence in health & safety is a priority for Befesa

• Aiming to reduce LTIR by at least 50% by 2024 vs. 2019
                                                                                    B                       14.8
                                                                              Top 3 of 205                 #3 of 60
          5.3                       -74.0%
                                                                             Metals & mining           Commercial services

                     3.6
                                2.9         2.6
                                                   2.1
                                                          1.4
                                                                                #5 of 105                   BBB
                                                                            Business services          Commercial services
         2015       2016       2017         2018   2019   2020

Global Challenges Index (GCX)                                          2021 Sustainability Report
• Befesa selected on 18 Sep 2020                                         • Publishing Progress Report in April

• GCX comprises a total of 50 shares
  selected according to strict criteria from
  a total of c. 6,000 companies worldwide

11   Company Presentation – February 2021
Experienced management team
 Senior management team delivering results through long-standing industry expertise, entrepreneurial spirit and focus
 on operational excellence as well as governance and compliance processes

                  Javier Molina                             Wolf Lehmann             Key achievements / track record
                  CEO                                       CFO;
                                                            incl. responsibilities             Extensive experience in steel and
                                                            for operational                    aluminium recycling business,
                                                            excellence & IT                    including managing through the cycle

                                                                                                 Strong performance results through
• CEO since 2000                             • CFO since 2014                                    focus on operational excellence
• Leading Befesa for >20 years               • 20+ years in finance &
                                               operational leadership roles,
                                               50/50 General Electric / PE                          Building strong business
                                                                                                    foundation of ESG, compliance
                                                                                                    and health & safety processes

                  Asier Zarraonandia                        Federico Barredo                          Successful international
                  Vice-president                            Vice-president                            expansion
                  Steel Dust                                Aluminium Salt Slags
                  Recycling Services                        Recycling Services
                                                                                                   Track record of successful
                                                                                                   acquisitions and turnarounds,
                                                                                                   e.g. BUS, Agor, Alcasa,
                                                                                                   Hankook, Silvermet
• 15+ years with Befesa                      • 25+ years with Befesa
• Running Befesa’s Steel Dust                • Running Befesa’s Aluminium Salt                Experience in developing greenfield
  business for >15 years                       Slags business for >20 years                   projects, e.g. Gravelines, South Korea,
                                                                                              Bernburg, China

 12   Company Presentation – February 2021
Multi-year trend – Key financials1)
(€m, unless otherwise stated)

                                              2017                                         2018                                          2019                                          2020
Revenue                                       €667.42)                                     €720.1                                        €647.9                                        €604.3

Reported EBITDA                               €153.0                                       €176.0                                        €159.6                                        €123.5

Reported EBITDA                               22.9%2)                                      24.4%                                         24.6%                                         20.4%
margin
Adjusted EBITDA                               €172.43)                                     €176.0                                        €159.6                                        €127.04)

Adjusted EBITDA                               25.8%2)                                      24.4%                                         24.6%                                         21.0%
margin
Net profit5)                                  €49.3                                        €90.2                                         €82.7                                         €47.6

EPS5) (€)                                     €1.026)                                      €2.65                                         €2.43                                         €1.40

Operating cash flow7)                         €91.5                                        €103.8                                        €102.5                                        €92.5

Cash position                                 €117.6                                       €150.6                                        €125.5                                        €154.6
end of period
Net debt                                      €406.4                                       €376.8                                        €416.9                                        €393.6

Net leverage                                  x2.4                                         x2.1                                          x2.6                                          x3.1

1) 2017, 2018 and 2019 are full year actual reported figures audited by external auditors; 2020 are full year preliminary figures currently being audited by external auditors
2) FY 2017 reported revenue amounted to €724.8m; Revenue of €667.4m is comparable after amendment IFRS 15 impacting non-operating revenue
3) 2017 EBITDA adjusted due to one-off non-recurrent items primarily related to the IPO
4) 2020 EBITDA adjusted for €3.5m for the UK Salt Slags plant closure
5) Net profit and total basic earnings/(losses) per share attributable to the ordinary equity holders of Befesa S.A.
6) FY 2017 EPS impacted by the conversion of the preferred shares carried out in October 2017 prior to the IPO; The weighted average number of ordinary shares used as the denominator in calculating total basic EPS

    in FY 2017 was 25,025 thousand shares, compared to the 34,067 thousand shares used from 2018 onwards
7) Operating cash flow is after WC change, taxes and interests; pre capex and pre dividend

13      Company Presentation – February 2021
Multi-year trend – Operational data
                                               2017                                           2018                                           2019                                          2020
 EAFD                                          661.0                                          717.1                                          665.8                                         687.0
 throughput (kt)
 EAFD average capacity                         84.7%                                          92.0%                                          80.7% / 90.1%1)                               83.0%
 utilisation (%)
 Waelz oxide (WOX)                             217.8                                          240.9                                          217.6                                         239.2
 sold (kt)
 Zinc LME price (€/t)                          €2,572                                         €2,468                                         €2,276                                        €1,979
 Zinc hedging                                  €1,876                                         €2,051                                         €2,317                                        €2,239
 price (€/t)
 Zinc blended price2)                          €2,160                                         €2,168                                         €2,280                                        €2,136
 (€/t)
 Salt Slags & SPL                              509.9                                          517.0                                          492.6                                         444.6
 treated (kt)
 Salt Slags & SPL avg.                         96.2%                                          97.5%                                          92.9%                                         83.7% / 86.9%3)
 cap. utilisation (%)
 Alu alloys produced                           184.1                                          169.3                                          176.7                                         174.3
 (kt)
 Secondary Alu avg.                            89.8%                                          82.6% / 98.1%4)                                86.2% / 91.1%5)                               84.8%
 capacity utilisation (%)
 Aluminium alloy FMB                           €1,766                                         €1,715                                         €1,397                                        €1,420
 price6) (€/t)
1) Installed capacity and corresponding utilisation rates in 2019 are normalised for the capacity upgrade in Turkey, from 65kt to 110kt (plant was shutdown from end of Jan to mid-Aug 2019)
2) Blended rate between hedged prices and average spot prices, weighted by the respective hedged and non-hedged volumes, reflecting the effective price to Befesa
3) Installed capacity and corresponding utilisation rates in 2020 are normalised for the UK salt slags plant closure in Q4 2020
4) Installed capacity and corresponding utilisation rates in 2018 are normalised for the furnace upgrades in Bilbao (plant was shutdown three months, from 2nd week of June to 3rd week of September),

    as well as the Barcelona - phase I (plant was shutdown two months, from 4 th week of August to 4th week of October)
5) Installed capacity and corresponding utilisation rates in 2019 are normalised for the furnace upgrade in Barcelona – phase II (plant was shutdown three months, from mid-August to mid-November)
6) Aluminium scrap and foundry ingots aluminium pressure diecasting ingot DIN226/A380 European Metal Bulletin free market duty paid delivered works

 14      Company Presentation – February 2021
Cash flow, net debt & leverage
Strong €230m liquidity (€155m cash balance + €75m RCF entirely undrawn)
even after dividend distribution and funding China

Adjusted EBITDA to total cash flow (€m)

             127.0
                                      -0.8
                                                            -17.0
                                Rigorous WC
                                                                                   -16.6                   92.5
                                management
                                                                                                                                 -25.1

                                                                                                                                                        -28.8
                                                                                                                                                                                15.3         -24.9            29.1
                                                                                                                                                     Mainly China           China local
                                                                                                                                                                                           30% of 2019
                                                                                                                                                     expansion              loans
                                                                                                                                                                                           net profit

         Adjusted               WC change                Interests                Taxes               Operating            Maintenance                 Growth                Bank          Dividend      Total cash flow
       EBITDA 2020                                                                                    cash flow               capex 1)                 capex             borrowings &                         2020
                                                                                                                                                                          FX effects 2)
 1)   Includes investments required to maintain or replace assets as well as those related to productivity, compliance and IT, as well as non-material collections from financial assets
 2)   Includes cash bank inflows/outflows from bank borrowings and other liabilities, as well as the effect of foreign exchange rate changes on cash

                                                                      YE 2019                                                                yoy change                                                    YE 2020

 LTM EBITDA                                                            €159.6                                                            -€32.6 / -20.4%                                                    €127.0

 Operating cash flow                                                   €102.5                                                             -€10.0 / -9.7%                                                     €92.5

 Gross debt                                                            €542.4                                                             +€5.8 / +1.1%                                                     €548.2

 Cash on hand                                                          €125.5                                                           +€29.1 / +23.2%                                                     €154.6

 Net debt                                                              €416.9                                                             -€23.3 / -5.6%                                                    €393.6

 Net leverage                                                           x2.61                                                                     +x0.5                                                      x3.10

15        Company Presentation – February 2021
You can also read