RETAIL BOND Investor Presentation - VECTOR
←
→
Page content transcription
If your browser does not render page correctly, please read the page content below
RETAIL BOND
Investor Presentation

VECTOR
May 2019

 1
DISCLAIMER
This presentation has been prepared by Vector Limited (“Vector”) in relation to the offer of unsecured, unsubordinated fixed rate bonds
described in this presentation (“Bonds”). Vector has lodged a Product Disclosure Statement dated 1 May 2019 (“PDS”) with the Registrar of
Financial Service Providers in New Zealand (“Registrar”) and made available the information on the register of offers of financial products
administered by the Registrar (“Register Entry”) (the PDS and the Register Entry, together the “Offer Materials’) in respect of the offer of Bonds
(“Offer”). The Offer Materials should be read before any investment decision is made.
A copy of the PDS is available through www.companiesoffice.govt.nz/disclose (OFR 12633) or by contacting the Joint Lead Managers (defined
below).
This presentation does not constitute a recommendation by Vector or ANZ Bank New Zealand Limited, Deutsche Craigs Limited, Forsyth Barr
Limited and Westpac Banking Corporation (ABN 33 007 457 141) (acting through its New Zealand Branch), (together, the “Joint Lead
Managers”), or Craigs Investment Partners Limited acting as Organising Participant (together with the Joint Lead Managers, the “Syndicate”)
nor any of their respective directors, officers, employees or agents to sell, purchase or retain the Bonds.
None of the Syndicate nor any of their respective directors, officers, employees and agents: (a) accept any responsibility or liability whatsoever
for any loss arising from this presentation or its contents or otherwise arising in connection with the offer of Bonds; (b) authorized or caused
the issue of, or made any statement in, any part of this presentation; and (c) make any representation, recommendation or warranty, express or
implied regarding the origin, validity, accuracy, adequacy, reasonableness or completeness of, or any errors or omissions in, any information,
statement or opinion contained in this presentation and accept no liability thereof (except to the extent such liability arises under the Financial
Markets Conduct Act 2013 (“FMC Act”) or cannot be disclaimed). The Syndicate do not guarantee the repayment of Bonds or the payment of
interest thereon or any other aspect of the Bonds.
This presentation is for preliminary informational purposes only and no part of it shall form the basis of or be relied upon in connection with
any contract or commitment whatsoever or constitute financial advice. The information in this presentation is summary in nature and is
necessarily brief. This presentation does not take into account your personal objectives, financial situation or needs and you should consult your
financial and other advisers before an investment decision is made. This presentation is not and should not be construed as an offer to sell or
a solicitation of an offer to buy Bonds and may not be relied upon in connection with any purchase of Vector securities. It is given in good faith
and has been obtained from sources believed to be reliable and accurate at the date of this presentation, but its accuracy, correctness and
completeness cannot be guaranteed.
.
    2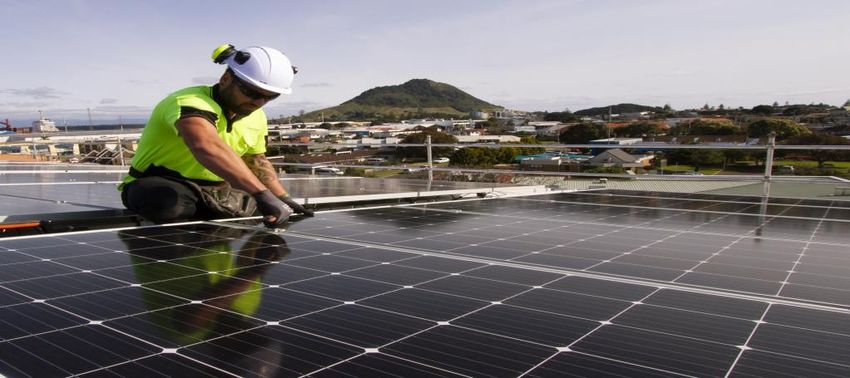
DISCLAIMER
Past performance is not indicative of future performance and no guarantee of future returns is implied or given. To the maximum extent permitted
by law and subject to any liabilities which might arise under the FMC Act, no representation or warranty, express or implied, is made as to the
accuracy, reliability, completeness or currency of any information, estimates, opinions or statements contained in this presentation (including any
forward-looking statements).
The distribution of this presentation, and the offer or sale of the Bonds, may be restricted by law in certain jurisdictions. Persons who receive this
presentation outside New Zealand must inform themselves about and observe all such restrictions. Nothing in this presentation is to be construed
as authorizing its distribution, or the offer or sale of the Bonds, in any jurisdiction other than New Zealand and Vector accepts no liability in that
regard. The Bonds may not be offered or sold directly, indirectly, and neither this presentation nor any other offering material may be distributed or
published, in any jurisdiction except under circumstances that will result in compliance with any applicable law or regulations.
Application has been made to NZX Limited for permission to quote the Bonds on the NZX Debt Market and all the requirements of NZX Limited
relating thereto have been duly complied with. However, NZX Limited accepts no responsibility for any statement in this presentation. The NZX
Debt Market is a licensed market operated by NZX Limited, a licensed market operator regulated under the Financial Markets Conduct Act 2013.
The information and opinions contained in this presentation are provided as at the date of this presentation and are subject to change without
notice. By attending or reading this presentation, you agree to be bound by the foregoing limitations and restrictions.

3
CONTENTS

4

CONTENTS Offer Highlights Vector Group Business Leadership Financial Performance & Capital Management Key Bond Terms and Timetable Credit Highlights 5
Offer Highlights

6
OFFER HIGHLIGHTS

    Issuer                Vector Limited

    Instrument            Unsecured, unsubordinated, fixed rate bonds

    Rating                Rating Agency         Issuer Credit Rating    Expected Issue
                                                                        Credit Rating
                          S&P Global Ratings    BBB (Stable)            BBB
    Issue Amount          Up to NZ$200m, plus up to NZ$50m oversubscriptions

    Maturity              27 May 2025 – 6 year bond

    Joint Lead Managers   ANZ, Deutsche Craigs, Forsyth Barr, Westpac

7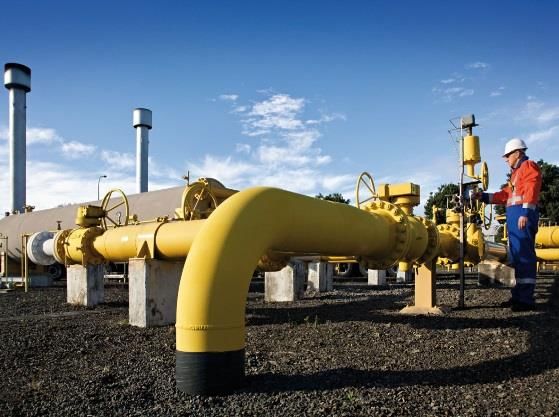
Vector Group
    New Zealand’s largest provider of energy infrastructure

8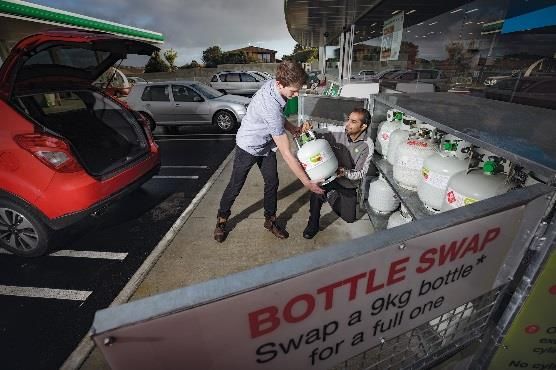
VECTOR BOARD

    DAME ALISON PATERSON      JONATHAN MASON          KAREN SHERRY          MICHAEL BUCZKOWSKI
             Chair              Deputy Chair          Trustee Director        Trustee Director

      ANTHONY CARTER                                   BOB THOMSON            BRUCE TURNER
                            DAME PAULA REBSTOCK
     Independent Director                            Independent Director   Independent Director
                              Independent Director
9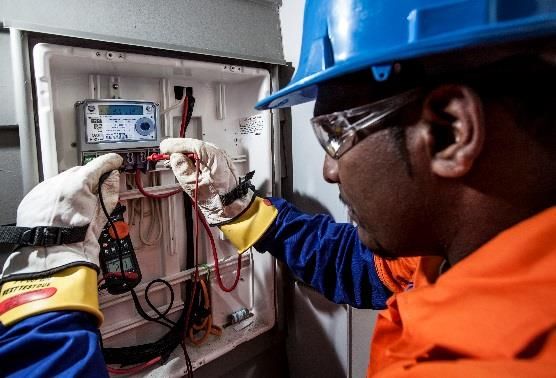
VECTOR EXECUTIVE TEAM

        SIM0N MACKENZIE                                               KATE BEDDOE           NIKHIL RAVISHANKAR

      Chief Executive Officer                                       Chief Risk Officer      Chief Digital Officer

          ANDRE BOTHA                                                   COLIN DALY
                                                                                                FIONA MICHEL
      Chief Networks Officer                                     CEO E-Co Products Group
                                                                                             Chief People Officer

     Jason Hollingworth, Chief Financial Officer, joins the executive team on 27 May 2019
10
VECTOR PORTFOLIO 11
VECTOR IS NZ’S LARGEST PROVIDER OF ENERGY INFRASTRUCTURE
                                                                        FY18 Revenue
- New Zealand’s largest owner and manager of energy
  infrastructure networks                              Technology 20%

    • #1 electricity distribution business
    • #1 provider of electricity and gas metering                                        Regulated
                                                                                        Networks 58%
    • #2 LPG business
                                                        Gas Trading
                                                        22%

- ~60% of revenue & ~70% of adjusted EBITDA sourced
  from regulated assets, with balance sourced from
  competitive activities                                     FY18 Segment Adjusted EBITDA

- Vector reports its financial results in 3 segments       Technology
                                                              25%
   • Regulated Networks
   • Technology                                                                         Regulated
   • Gas Trading                                       Gas Trading
                                                       7%
                                                                                        Networks
                                                                                          68%

 12
AUCKLAND’S POPULATION HAS GROWN BY 10% IN 4 YEARS
(MINISTRY OF TRANSPORT)
Population of Auckland - New Zealand Auckland Population Growth (2007 - 2017)
2,000 50 K 3.0%
45 K
2.5%
40 K
1,500
35 K
2.0%
30 K
Thousands
1,000 25 K 1.5%
20 K
1.0%
15 K
500
10 K
0.5%
5K
0 0K 0.0%
1996 2000 2004 2008 2012 2016 2020 2024 2007 2008 2009 2010 2011 2012 2013 2014 2015 2016 2017
Auckland population estimate Auckland population projection Annual Population Growth Annual Population Growth Rate
Source : Figure NZ Source : Statistics New Zealand
Auckland is the fastest growing city in NZ and among the fastest growing cities in the
world. Significant investment is required to support Auckland’s growth.
13ENERGY FUTURE 14
ELECTRICITY DISTRIBUTION
                           Electricity network customers1
                           567,009 (26% NZ)

                           Network Length (18,783km)1
                           Overhead      Underground
                           8,323km       10,460km

                           Network assets2
                           Grid Exit Points:           15
                           Zone Substation:            112
                           Distribution Substations:   33,652
                           Poles:                      119,228

                           1. As at 31 December 2018
                           2. As at 31 March 2018
15
VECTOR’S REGULATED NETWORKS DELIVER ENERGY TO AUCKLAND
HOMES & BUSINESSES REGULATED NETWORK CAPEX $M
- Vector delivers electricity to 567,009 and gas to
245.8
110,489 Auckland homes & businesses* 210.6
201.0
183.7
- Significant investment required to support 170.4
Auckland’s rapid growth 125.0
- Regulated asset base now at $3.4bn
• Electricity ~$3.0bn
• Gas ~$405m FY14 FY15 FY16 FY17 FY18 H1 2019
Replacement Growth
- Returns regulated by Commerce Commission
• Input Methodologies provide relative certainty NEW CONNECTIONS
of regulation through 2025
3,165
• Next “reset” for gas in October 2022 and for 3,515
3,323
electricity in April 2020 2,821
3,107
- Vector is at the forefront of using new technology 11,135 1,669
to ensure network investment is customer 6,202
7,813 8,526 9,138
5,160
focussed, efficient, flexible and future-proofed
FY14 FY15 FY16 FY17 FY18 H1 2019
16 *As at 31 December 2018 Electricity GasCUSTOMER ANALYTICS
Contemporary approach to understanding customers via data modelling. Key findings that are
informing our forecasting and investment plans:
Starting Position New Insight
New homes use 15% less New homes use 30% less
electricity per m2 than older electricity per m2 than older
homes homes
Homes with gas use 34%
Homes with gas use same
less electricity per m2 than
electricity as homes without
electricity only homes
Low income homes use less Higher income homes use
electricity than wealthier 23% less electricity per m2
homes than the lower income homes
17TECHNOLOGY SOLUTIONS Shifting load through GRID storage 18
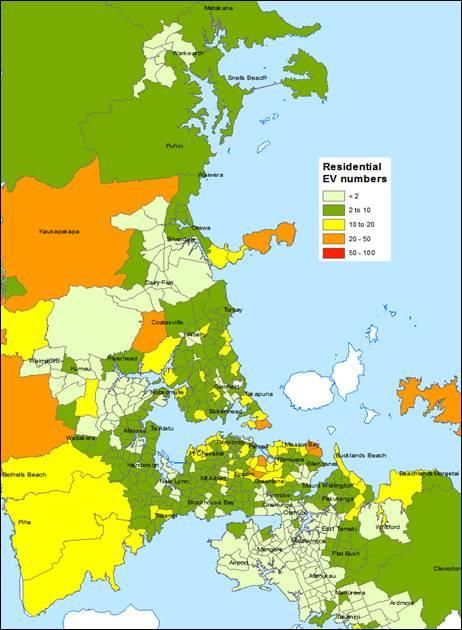
ELECTRIC VEHICLE OWNERSHIP BY SUBURB

                                       Source: Ministry of Transport
19
CHARGER TYPE VS. HOUSEHOLD CONNECTION CAPACITY
Capacity of different charger types compared to average
household connection capacity
Trickle – 2.4 kW
Slow – 7 kW
Fast – 22 kW
Rapid – 50 kW
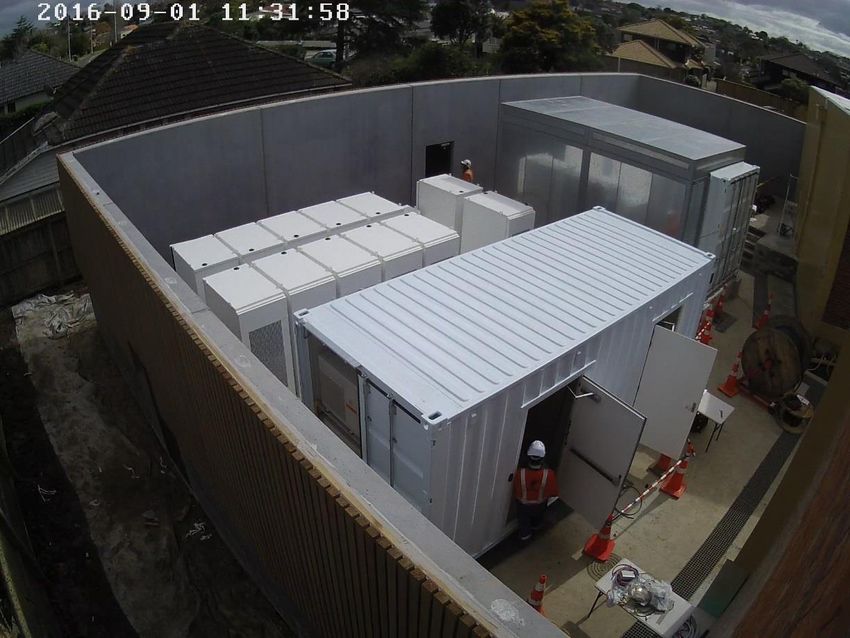
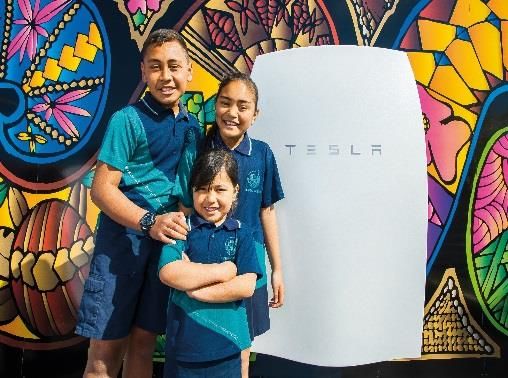
20 Source: Vector EV Network Integration Green PaperVECTOR’S TECHNOLOGY BUSINESS DELIVERS NEW ENERGY
SOLUTIONS TO HOMES & BUSINESSES
Metering New energy solutions
Vector owns ~1.6m electricity & gas meters • Large commercial solar and battery
• Installed more than 1.3m smart meters in projects in NZ & Pacific
NZ • Grid-scale batteries operational
• Deployed more than 100k advanced meters supporting network capacity in Auckland
in Australia • Well placed to meet growing demand for
• Nationwide field service capability in NZ energy efficient HVAC* solutions in
homes
HVAC – Heating ventilation and air conditioning
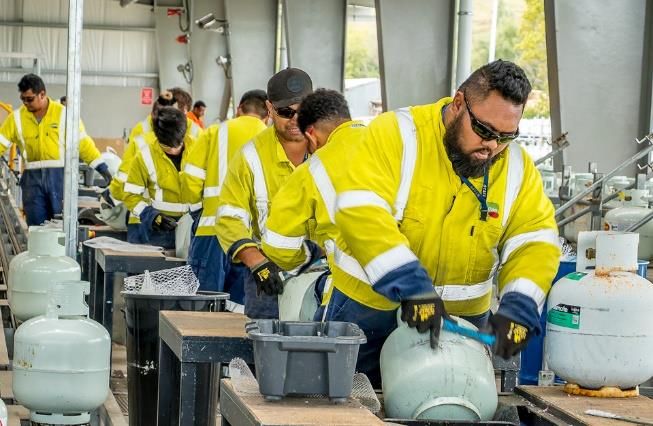
21VECTOR’S GAS TRADING BUSINESS DELIVERS LPG AROUND NZ
- Gas Trading business consists of:
• Natural Gas - wholesale, trading and industrial
sales; gas treatment plant in Taranaki.
• LPG - OnGas sales, distribution and reticulated
networks; 60% stake in Liquigas
- Natural gas business has declined over recent years
as entitlements to legacy gas have been exhausted
- Vector’s LPG operations occupy a strong market
position BOTTLE SWAP VOLUMES (‘000 cylinders)
- New LPG 9kg Bottle Swap plant in South Auckland H1 H2
operational and generating cost efficiencies 284
301
248
240
- Bottle Swap plant won Deloitte Energy Excellence 200
185
Health & Safety award 155
320 352 358
266 302
203 229
158
FY12 FY13 FY14 FY15 FY16 FY17 FY18 FY19
22BUSINESS LEADERSHIP 23
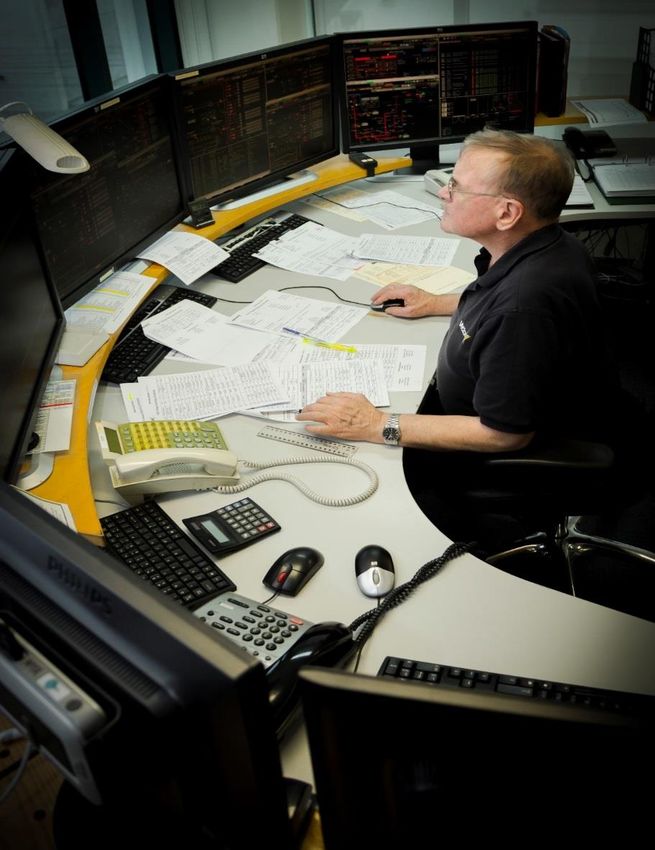
BUSINESS LEADERSHIP
 Urban Forest launched       Outage Centre             Accessibility Tick         Vector Lights             Safety Always
                               launched

• Commitment to          • New Outage Centre         • First NZ corporate    • Global media              • During H1 TRIFR
  replace every tree       launched as part of         to receive              coverage of Vector          (Total Recordable
  removed from             major overhaul of           Accessibility Tick,     Lights and Sky              Injury Frequency
  network with two         outage systems and          a public                Tower lighting up           Rate) decreased by
  native trees             processes                   recognition of an       the first major city in     17% and LTIFR
• Launched               • Supported by new            organisation’s          world to welcome            (Lost Time Injury
  September 2018           Security Operations         ongoing                 2019                        Frequency Rate)
  with more than           Centre, developed via       commitment to                                       decreased by 59%
  15,000 trees             partnerships with           becoming
  planted as part of       global leaders in cyber     accessible and
  launch                   security                    inclusive of
                                                       people with
24
                                                       disabilities
Financial Performance &
Capital Management
25FINANCIAL PERFORMANCE
FINANCIAL PERFORMANCE ($M)
676.2 688.6
H1 2018
H1 2019
1
250.0 264.7
236.0
219.1
201.1
182.7
79.0 83.3 82.5 82.5
Revenue Adjusted EBITDA Capital Expenditure Net Profit Operating Cash Flow Half Year Dividend
+1.8% +5.9% +10.1% +5.4% -7.2% +0.0%
Adjusted EBITDA is not a GAAP measure of profit. For a reconciliation of adjusted EBITDA to EBITDA and net profit refer to Interim/Annual Report.
26 1From 1 July 2018 Vector adopted IFRS 15/16 and changed the accounting treatment of gains/losses on disposal of fixed assets. Excluding these accounting changes,
comparable adjusted EBITDA would be $260m (up 4%). Comparatives not adjusted.5 YEAR GROUP ADJUSTED EBITDA PERFORMANCE
Group Adjusted EBITDA (Continuing Operations Only)
$M
For the year ended 30 June
473.0 474.4 470.1
446.5 451.9
FY2014 FY2015 FY2016 FY2017 FY2018
27CAPEX DRIVEN BY AUCKLAND GROWTH & METER DEPLOYMENT
GROSS CAPITAL EXPENDITURE ($M) GROSS CAPEX BY SEGMENT $7.9m 4%
H1 2019
$12.3m
400.0 7%
Regulated Networks $62.2m
350.0 71.5 H1 2018
62.3 31%
300.0 49.8 Gas Trading $40.2m
42.8 22%
250.0
200.0 Technology
41.2 $10.6m
309.7 $119.6m $125.0m
150.0 305.2 6%
272.8 Corporate 65% 62%
244.7
100.0
159.9
50.0 $6.0m
3%
0.0
FY15 FY16 FY17 FY18 H1 2019
Net capex Capital contributions
• H1 2019 Gross capex up 10.1% to $201.1m. Net capex (after deducting contributions) up 7.7% to
$159.9m
• H1 2019 Growth capex up 13.4% to $122.6m. Replacement capex up 5.2% to $78.5m
28STRONG BALANCE SHEET
- Group debt maturities are comfortably spread in a variety of markets
- Economic gearing as at 31 December 2018 at 49.6%
Strong balance sheet GROUP DEBT MATURITY PROFILE $M
150
297
350 307
355 325
300 307 277
251 240 250
138
FY19 FY20 FY21 FY22 FY23 FY24 FY25 FY26 FY27 FY28 FY29 FY30
Bank Facilities Credit Wrapped Floating Rate Notes Perpetual Capital Bonds USPP Wholesale Bonds Proposed - Senior Bond
295 YEAR GROUP NET ECONOMIC DEBT AND GEARING
NET ECONOMIC DEBT & GEARING
$M
52.5% 53.6%
48.8%
47.1%
43.7%
2,625 2,745 1,933 2,220 2,378
Jun 14 Jun 15 Jun 16 Jun 17 Jun 18
Net economic debt ($m) Gearing
30BBB CREDIT RATING
Vector rated BBB (stable outlook) by S&P Global Ratings & Baa1 (stable outlook) by Moody’s
FFO / CASH INTEREST COVERAGE FFO / DEBT %
4.0x 20%
Consistently above BBB
threshold of 9%
3.7x
Significant headroom above 16.0%
BBB threshold of 2.2x 15% 14.5%
3.5x 14.0%
12.9%
11.3%
3.0x
3.0x 2.9x 10%
2.7x
2.6x
2.5x 5%
2.0x 0%
2014 2015 2016 2017 2018 2014 2015 2016 2017 2018
BBB Threshold
BBB Threshold
Source : Standard & Poor’s Rating Report November 2018
31Retail Bond Issue Key Terms 32
KEY TERMS OF THE BONDS
     Issuer                        Vector Limited
     Instrument                    Unsecured, unsubordinated, fixed rate bonds
     Rating                        Rating Agency                       Issuer Credit Rating                 Expected Issue Credit Rating
                                   S&P Global Ratings                  BBB (Stable)                         BBB
     Issue Amount                  Up to NZ$200m, plus up to NZ$50m oversubscriptions
     Term                          27 May 2025 – 6 year bond
     Interest Rate                 Fixed rate of interest that will be set following the bookbuild
     Indicative issue margin and   To be announced via the NZX on Friday 10 May 2019
     minimum Interest Rate
     Interest Payments             Semi-annual in arrear in equal amounts
     Financial Covenants           The net debt of the Vector Group expressed as a percentage of the consolidated total capitalisation of the
                                   Vector Group shall not exceed 72%.

                                   At each calculation date, the ratio of EBITDA of the Vector Group to senior interest expense for the 12
                                   month period ending on the relevant calculation date shall be not less than 1.5:1.
     Listing                       NZDX under the ticker VCT090
     Brokerage                     0.50% brokerage, 0.25% firm fee
     Denominations                 Minimum $5,000 holding then $1,000 increments
     Joint Lead Managers           ANZ, Deutsche Craigs, Forsyth Barr, Westpac
33
KEY DATES
PDS lodged Wednesday, 1 May 2019
Indicative issue margin and minimum Friday, 10 May 2019
Interest Rate announced
Opening Date Monday, 13 May 2019
Closing Date 12 pm, Thursday, 16 May 2019
Rate Set Date Thursday, 16 May 2019
Issue Date / Allotment Date Monday, 27 May 2019
Expected date of initial quotation and Tuesday, 28 May 2019
trading
Maturity Date Tuesday, 27 May 2025
34CREDIT HIGHLIGHTS 35
KEY CREDIT HIGHLIGHTS
     New Zealand’s largest Electricity Distribution Business
          • Significant Investment to support Auckland’s rapid growth
          • Regulatory framework and strong market position

     # 1 provider of electricity and gas metering in New Zealand
          • 1.5m smart meters installed in NZ and Australia
          • Over 225,000 gas meters in NZ

     Health and Safety Record
          • TRIFR decreased by 17% and LTIFR by 59% in HY 19
          • Deloitte Energy Excellence Award for Health and Safety at Ongas Bottle Swap
            plant

     Strong investment grade credit rating
          • BBB (stable)
36
QUESTIONS 37
You can also read