Investor Presentation - Q1 FY 2019-20 - July 2019 - Bandhan Bank
←
→
Page content transcription
If your browser does not render page correctly, please read the page content below
Investor Presentation – Q1 FY 2019-20

July 2019

Disclaimer
• This presentation is confidential and may not be copied, published, distributed or transmitted. The information in this presentation is being provided by Bandhan Bank Limited
(also referred to as ‘Bank’). By attending a meeting where this presentation is made, or by reading this presentation material, you agree to be bound by following limitations:
The information in this presentation has been prepared for use in presentations by Bank for information purposes only and does not constitute, or should be regarded
as, or form part of any offer, invitation, inducement or advertisement to sell or issue, or any solicitation or any offer to purchase or subscribe for, any securities of the
Company in any jurisdiction, including the United States and India, nor shall it, or the fact of its distribution form the basis of, or be relied on in connection with, any
investment decision or any contract or commitment to purchase or subscribe for any securities of the Company in any jurisdiction, including the United States and
India. This presentation does not constitute a recommendation by the Bank or any other party to sell or buy any securities of the Bank. This presentation and its
contents are not and should not be construed as a prospectus or an offer document, including as defined under the Companies Act, 2013, to the extent notified and in
force or an offer document under the Securities and Exchange Board of India (Issue of Capital and Disclosure Requirements) Regulations, 2009as amended.
The Bank may alter, modify, or otherwise change in any manner the contents of this presentation without obligation to modify any person of such change or changes.
No representation warranty implied as to and reliance or warranty, express or implied, is made to, nor should be placed on, the fairness, accuracy, completeness or
correctness of the information or opinions contained in this presentation. Neither Bank nor any of its affiliates, advisors or representatives shall have any responsibility
or liability whatsoever (for negligence or otherwise) for any loss howsoever arising from any use of this presentation or its contents or otherwise arising in connection
with this presentation. The information set out herein may be subject to updating, completion, revision, verification and amendment and such information may
change materially. This presentation is based on the economic, regulatory, market and other conditions as in effect on the date hereof. It should be understood that
subsequent developments may affect the information contained in this presentation, which neither Bank nor its affiliates, advisors or representatives are under any
obligation to update, revise or affirm.
This presentation contains certain supplemental measures of performance and liquidity that are not required by or presented in accordance with Indian GAAP, and
should not be considered as an alternative to profit, operating revenue or any other performance measures derived in accordance with Indian GAAP or an alternative
to cash flow from operations as a measure of liquidity of the Bank. You must make your own assessment of the relevance, accuracy and adequacy of the information
contained in this presentation and must make independent analysis as you may consider necessary or appropriate for such purpose. Any opinions expressed in this
presentation are subject to change without notice and past performance is not indicative of future results. By attending this presentation you acknowledge that you
will be solely responsible for your own assessment of the market position of the Bank and that you will conduct your own analysis and be solely responsible for
forming your own view of the potential future performance of the Bank ’s business.
This presentation contains forward‐looking statements based on the currently held beliefs and assumptions of the management of the Bank , which are expressed in
good faith and, in their opinion, reasonable. Forward‐looking statements involve known and unknown risks, uncertainties and other factors, which may cause the
actual results, financial condition, performance, or achievements of the Bank or industry results, to differ materially from the results, financial condition, performance
or achievements expressed or implied by such forward‐looking statements. The risks and uncertainties relating to these statements include, but are not limited to,
risks and uncertainties regarding expansion plans and the benefits there from, fluctuations in our earnings, our ability to manage growth and implement strategies,
competition in our business including those factors which may affect our cost advantage, wage increases in India, our ability to attract and retain highly skilled
professionals, our ability to win new contracts, changes in technology, availability of financing, our ability to successfully complete and integrate our expansion plans,
liabilities, political instability and general economic conditions affecting our industry. Unless otherwise indicated, the information contained herein is preliminary and
indicative and is based on management information, current plans and estimates. Industry and market‐related information is obtained or derived from industry
publications and other sources and has not been verified by us. Given these risks, uncertainties and other factors, recipients of this document are cautioned not to
place undue reliance on these forward‐looking statements. The Bank disclaims any obligation to update these forward‐looking statements to reflect future events or
developments. 2
This presentation is not an offer for sale of securities in the UNITED STATES or elsewhere.Key Highlights & Strengths
3Key Highlights
Bandhan Bank - Overview Snapshot of operations (30th June 2019)
Total Deposits ₹ 437.01 bn
Loan portfolio (on book + off book) for Q1FY 19-20 grew 39.36% Y-o-Y
Deposits grew by 42.34% Y-o-Y in Q1 FY 19-20 Total loans
₹ 454.20 bn1
and advances
Net NPA at 0.56%
Net interest margin
10.45%*
Retail Deposit to Total Deposit at 76.09% (NIM)
Added 7.08 lakh Customer during the quarter with total customer base CASA ratio (%) 36.06%
reaching to 17.27 million (Micro Banking- 13.58 million and Non Micro–
ROAA (%) 4.89%*
3.69 million)
Income from PSLC of ₹3.70 Billion to be recognised over 4 quarters, ROAE (%) 24.43%*
hence booked ₹0.93 Billion in Q1 FY19-20
34 999 3,014 17.27 mm 86%
States & UTs Branches DSCs Customers Micro loans
458 481 32,774 95%1
Cities ATMs Employees Priority sector loans
* Annualised 4
1 On book + Off Book;Geographical Distribution
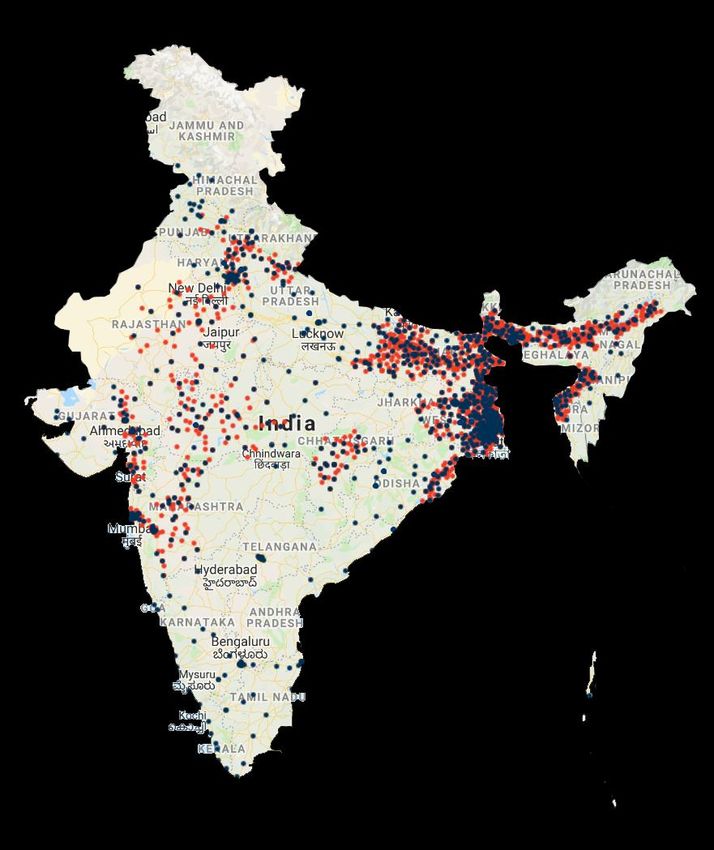
5Geographical Distribution
Banking Outlets Focus on serving the rural &
underbanked population
5000
4000 4013 Banking Outlets as on 30th June 2019*
3701
4000
Metro,
3000 10%
Rural,
Urban,
2000 36%
2764 3014 3014 19%
1000
937 986 999
0
June 18' March 19' June 19' Semi-
urban,
Branches DSCs Banking Outlets 35%
Multi channel distribution network with a mix of Significant presence in under- penetrated
branches and digital East and North East India
West South
Branches ATMs DSCs Net banking mBandhan Debit card
8% 5%
North
6%
Central
16% East
51%
North
*Basis original classification at the time of opening East 6
14%Geographical Distribution
Present in 34 of the 36 States and
Union Territories of India.
Lakshadweep & Daman and Diu are the only
ones that do not have a Bandhan Bank
presence.
DSCs BranchesAmalgamation Update
8Update on Amalgamation
of Gruh Finance into and with the Bank
Receipt of approval from
Application to SEBI for NSE and BSE
considering the Receipt of approval from
amalgamation as a SEBI for adaptation of Filing the
Approval of method of complying scheme of Amalgamation as scheme with
amalgamation with Minimum Public a method to comply with NCLT, Kolkata
by the Board Filing with RBI shareholding (MPS) MPS Norms. bench
12.01.2019 06.02.2019 14.03.2019 15.04.2019 20.06.2019
07.01.2019 14.01.2019 08.02.2019 03.04.2019 04.04.2019
Filing with Stock Filing with Completion Receipt of Receipt of Order issued by
Exchanges Commission of India (CCI) approval from approval from NCLT, Kolkata for
RBI CCI convening meeting
of the equity
shareholders on
July 30, 2019
4Business Overview
10Asset Overview
Advances Growth (₹ in Billion) Composition of Advances (in %)
454.20 447.76
325.90
85% 86% 86%
15% 14% 14%
June 18' June 19' March 19'
June 18' June 19' March 19'
Non-Micro Banking Assets Micro Banking Assets
Total Advances (₹ in Billion)
325.90 333.73 355.99 447.76 454.20
17.61 15.92 18.41 16.99 SME
18.71
4.50 4.51 5.49
4.49 4.60 NBFC-
11.29 14.34 19.87 22.63
12.00 Others
10.48 12.05 18.83 17.43 NBFC-
10.96
MFI
Retail
279.74 289.74 309.18 386.15 391.66
Micro
11
JUN-18 SEP-18 DEC-18 MAR-19 JUN-19Micro Banking Assets
Micro Banking Asset Growth (₹ in Billion) Number of Active Micro Borrowers (Mn)
9.84 9.49
391.66 386.15 7.95
279.7
June 18' June 19' March 19'
June 18' June 19' March 19'
Micro Loan Disbursement (₹ in Billion) Number of Customers (in Million)
Micro Banking General Banking
193.24
146.81 17.27 16.56
123.2 13.65
108.47 119.87
94.72 96.41 3.69 3.46
72.19 2.66
46.41
10.99 13.58 13.1
Jun-17 Sep-17 Dec-17 Mar-18 Jun-18 Sep-18 Dec-18 Mar-19 Jun-19 June 18' June 19' March 19'
12Non Micro Assets
Non Micro Banking Asset growth (₹ in Billion ) Product wise Advances – Non Micro (₹ in Billion)
70
62.54 61.61
60 5.49
46.16 4.5
50
22.63 19.87
4.49
40
12.00
June 18' June 19' March 19' 30
18.41
16.99
20 18.71
Higher PSL Portfolio
5% 10 17.43 18.83
10.96
0
June' 18 June' 19 Mar' 19
Retail MSME NBFC-MFI NBFC Others*
95%
Priority sector advances (as a % of advances) – Q1 FY2020
PSL Assets Non PSL Assets *Includes ILF&S exposure of Rs 3.85 billion 13Liabilities Profile
Deposits Growth (₹ in Billion) Retail to total Deposits (%)
79.98% 76.09% 77.36%
437.01
307.03 June 18' June 19' March 19'
CASA (%)
279.44
TD 40.8%
35.5% 36.1%
Savings
Current 198.16
June 18' June 19' March 19'
Average SA Balance (₹ in 000’)
128.34
88.15 General Banking Micro Banking
1.56 2.35 2.01
20.72 29.23 34.00 40.69 35.08
June 18' June 19' June' 18 Mar' 19 June' 19
14Credit Rating
Rating of Bank’s Financial Securities
Amount
Instrument Rating Rating Agency
(₹ in Billion)
CARE AA-;
(Double A Minus)
CARE Ratings
Outlook: Credit watch with
Unsecured Subordinated Non -
developing implications) 1.60
Convertible Debenture
[ICRA]AA (Double A;
Outlook: placed on rating watch ICRA
with developing implications)
[ICRA]AA (Double A;
Term Loans From Bank Outlook: placed on rating watch ICRA 0.80
with developing implications)
Certificate of Deposit [ICRA] A1+ ICRA 30.00
15Financial Overview
16Financial Performance
Total income (₹ in Billion) PAT (₹ in Billion)
Net Interest Income Other Income Total Income
19.52
7.01
55.59 4.82
Q1 FY19 Q1 FY20 FY19
10.63
Operating expenses to Average Assets (%)
3.80% 3.60%
17.23 3.38%
44.96
12.48 3.12
2.11
10.37 14.11
Q1 FY19 Q1 FY20 FY19
Q1 FY19 Q1 FY20 FY19
17Financial Performance
ROAA & ROAE* Spread %
ROAA ROAE Yield Cost of funds (Excl Cap.) Spread
24.4%
19.9% 15.4% 15.7% 15.4%
19.0%
8.9%
9.1% 9.1%
6.5% 6.6% 6.3%
4.5% 4.9% 4.2%
Q1 FY19 Q1 FY20 FY19 Q1 FY19 Q1 FY20 FY19
Cost to Income Ratio Fee Income to Total Income Ratio
34.2% 32.6%
29.9% 12.8% 13.8%
11.9%
Q1 FY19 Q1 FY20 FY19 Q1 FY19 Q1 FY20 FY19
18
* Annualised; Monthly AverageFinancial Performance
Capital Adequacy Ratio NIM
Tier I Tier II Total 10.5%
10.4%
32.61%
27.03% 29.20% 10.3%
1.18%
1.28% 1.32%
31.43% 27.88%
25.75%
Q1 FY19 Q1 FY20 FY19
June 18' June 19' March 19'
Gross NPA and Net NPA Credit Cost
Credit Cost - NPA Credit Cost - Standard
Gross NPA (%) Net NPA 2.29%
2.02% 2.04%
1.26% 1.29%
2.01%
0.78%
0.64% 0.56% 0.58% 1.06%
0.66%
0.12% 0.23% 0.27%
June 18' June 19' March 19' Q1 FY19 Q1 FY20 FY19 19Profit & Loss Statement (IN ₹ Billion)
Particulars Q1 FY20 Q1 FY19 YoY% Q4 FY19 Q0Q% Mar-19
Interest Income 21.21 15.56 36.31% 18.33 15.71% 66.44
Interest expenses 7.1 5.19 36.80% 5.75 23.48% 21.48
Net Int. Income (NII) 14.11 10.37 36.07% 12.58 12.16% 44.96
Non Interest Income 3.12 2.11 47.87% 3.88 -19.59% 10.63
Total Income 17.23 12.48 38.06% 16.46 4.68% 55.59
Operating Expenses 5.15 4.27 20.61% 4.92 4.67% 18.11
Operating Profit 12.08 8.21 47.14% 11.54 4.68% 37.48
Provision (Std. + NPA) 1.34 0.82 63.41% 1.55 -13.55% 7.73
MTM Loss on Investments -0.09 -0.02 350.00% -0.01 800.00% -0.38
Profit before tax 10.83 7.41 46.15% 10 8.30% 30.13
Tax 3.82 2.59 47.49% 3.49 9.46% 10.61
Profit after tax 7.01 4.82 45.44% 6.51 7.68% 19.52
20Balance Sheet (IN ₹Billion)
As at As at
31st
30th June QoQ%
March
2019
Particulars 2019
Capital & Liabilities
Capital 11.93 11.93 0.00%
Reserves & Surplus 102.79 100.09 2.70%
Shareholder Funds 114.72 112.02 2.4103%
Deposits 437.01 432.32 1.08%
Borrowings 4.58 5.21 -12.09%
Other liabilities and provisions 30.37 14.87 104.24%
Total 586.68 564.42 3.94%
Assets
Cash and balances with Reserve 33.52 38.79
Bank of India -13.59%
Balance with Banks and Money at 21.13 19.24
call and short notice 9.82%
Investments 107.37 100.37 6.97%
Advances 414.86 396.43 4.65%
Fixed Assets 3.40 3.31 2.72%
Other Assets 6.40 6.28 1.91%
Total 586.68 564.42 3.94% 21Our Board & Management
22Experienced and professional team…
Chandra Shekhar Ghosh Mahendra Mohan Gupta
MD & CEO Head, Legal
Founder of BFSL, has 27 years of experience in the field of 34+ years experience in the legal, finance and banking industry
microfinance and development Previously worked as DGM- Legal at ICICI Bank
Awarded ‘Entrepreneur of the Year’ by Forbes and ET in 2014
Deepankar Bose
Management Team
Head, Corporate Centre Santanu Banerjee
36+ years experience in banking industry Head, HR
Previously served as Chief General Manager and Head Of Wealth 27+ years of experience in the field of banking and finance
Management business, at SBI Previously worked as Head of HR Business Relationship at Axis bank
Sunil Samdani Vijay kumar Ramakrishna
Chief Financial Officer Chief Information Officer
20+ years of experience in financial industry 22+ years of experience in the field of technology
Previously served as Head of Business Analytics and Strategy at Previously worked as Group Manager of Intuit India and as Chief
Development Credit Bank and as CFO at Karvy Technology Officer of Yes Bank
Biswajit Das Subhro Kumar Gupta
Chief Risk Officer Chief Audit Executive
28 years of experience in banking industry 35+ years experience in Banking Industry.
Previously served as Head-RBS and regulatory reporting at ICICI Bank Previously served as Head Audit at ICICI BankExperienced and professional team…
Arvind Kanagasabai Nand Kumar Singh
Head, Treasury Head, Banking Operations and Customer Services
27+ years experience in banking industry
30+ years of experience at a PSU Bank
Previously served as Retail Banking Head, Patna Circle, at Axis Bank
Previously served as CFO at SBI DFHHL, Mumbai
Sourav Kar
Management Team
Nicky Sharma
Head – Fraud Risk Management Chief Strategy Officer
27+ years of experience in banking industry
10+ years of experience in the field of technology & Finance
Previously served as Regional Business Manager - Liability Sales at
Previously served as Associate Director at PWC, Gurgaon
ING Vysya Bank
Indranil Banerjee Saurabh Jain
Company Secretary Head – Wholesale Banking
17+ years experience in financial industry 17+ years of experience in banking industry
Previously served as Company Secretary at Energy Development Previously served as Vice President & Head – Business Banking
Company Products, Private & Commercial Clients at Deutsche Bank AG
Dhruba Jyoti Chaudhuri Srinivasan Balachander
Head - Corporate Services Chief Compliance Officer
28+ years experience in Administration, Infrastructure & Facilities 20+ years experience in banking industry.
field. Previously served as Chief Compliance Officer at Axis Bank Ltd.
Previously served as Infrastructure Head at ICICI Bank Ltd.… backed by a strong independent Board
Chandra Shekhar Ghosh
MD & CEO Dr. Anup Kumar Sinha
Has significant experience in the field of microfinance Part-time Chairman
Awarded ‘Outstanding Leadership Award’ by Dhaka University Economist with Ph.D from University of Sothern California
Served as Professor of Economics at IIM Calcutta for 25 years
Bhaskar Sen Chintaman Mahdeo Dixit
Director Director
Retired as Chairman & MD of United Bank of India
Significant experience in finance and accountancy sector
Previously, Executive Director of Dena Bank
Previously, he has worked at Life Insurance Corporation and Indian
Bank
Board of Directors
Sisir Kumar Chakrabarti Snehomoy Bhattacharya
Director Director
Previously, Deputy Managing Director at Axis Bank
Significant experience in public and private banking sector
Also worked with State Bank of Bikaner and Jaipur prior to joining
Previously worked as Executive Director – Corporate Affairs Axis
Axis Bank Bank
Ranodeb Roy
T. S. Raji Gain
Non-executive Director
Director
Founder of RV Capital Management Private Limited, Singapore, he
Significant experience in the field of agricultural and rural
was earlier heading Fixed Income Asia Pacific in Morgan Stanley
development, Previously, she has worked with NABARD
Asia) Singapore
Currently, Executive Director BIRD
Dr. A S Ramasastri Santanu Mukherjee
Director Director
Director, Institute for Development & Research of Banking Technology; Significant experience in public sector Banking in various
Chairman of IFTAS; company promoted by IDRBTto provide capacities in SBI Group
technology services in Banking & financial sectors Former MD of State Bank of Hyderabad
Dr. Holger Dirk Michaelis
Nominee Director Harun Rashid Khan
Significant experience in private equity and as strategic advisor to Director
financial services companies Retired as Deputy Governor of Reserve Bank of India
Currently, he is working at GIC Instrumental in formulation of Payments system Vision 2018 of RBI
25Awards and accolades
Businessworld Magna Awards 2019
Bandhan Bank won two awards in the small size bank category at
the glittering ceremony of Magna Awards 2019 organised by
Businessworld magazine in Mumbai.
1. Best Bank
2. Fastest Growing Bank
'Banker of the Year' award was conferred upon
Mr. Chandra Shekhar Ghosh.Thank You Investor.relations@bandhanbank.com
You can also read