MANUFACTURING COMPENSATION & BENEFITS BENCHMARKING STUDY - THE 2021 KENTUCKY GEARING UP FOR SUCCESS - Barnes Dennig
←
→
Page content transcription
If your browser does not render page correctly, please read the page content below

THE      2021 KENTUCKY
       MANUFACTURING
COMPENSATION & BENEFITS
   BENCHMARKING STUDY
  GEARING UP FOR SUCCESS
          Presented by:
2021 KENTUCKY MANUFACTURER’S COMPENSATION &
                                                                 BENEFITS BENCHMARKING STUDY

TABLE OF CONTENTS

                  I.       Overview                                                                     1-4

                  II.      Company Background                                                           5-9

                  III.     Compensation Information                                                   10-15

                  IV.      International Operations                                                   16-20

                  V.       Company Operations                                                         20-31

                  VI.      Employee Benefit Information                                               31-43

© Barnes Dennig, North Side Bank and Trust, Northern Kentucky Chamber of Commerce and USI Insurance           page 1
OVERVIEW
To gain a clearer picture of how area manufacturers are adjusting to these challenging
times, Barnes Dennig, North Side Bank and Trust Company, and USI Insurance
partnered to conduct the 2021 Manufacturing Compensation & Benefits Benchmarking
Study. For the first time since publishing the study in 2002, we have provided a report
developed for strictly Kentucky manufacturers.

Twenty-two Kentucky companies responded to the survey. Our study findings show
that a majority of Kentucky manufacturers’ staff levels have seen steady or increased
staff levels while most cited finding staff as a top operational issue.

COMPANY BACKGROUND
♦   Of the companies surveyed:
              4 (18%) had annual sales less than $5 million
              1 (5%) had annual sales of $5 – 9.9 million
              6 (27%) had annual sales of $10 – 25.9 million
              4 (18%) had annual sales of $26 – 50.9 million
              3 (14%) had annual sales of $51 – 99.9 million
              0 (0%) had annual sales of $100 – 249.9 million
              4 (18%) had annual sales of more than $250 million

♦   Ninety-one percent (91%) of respondents are privately held companies, with the
    remaining reporting as public.

♦   Five percent (5%) listed the Midwest as their primary market, 41% listed national as
    their primary market; and 36% doing business internationally. Five percent (5%) of
    companies do business only in the local Greater Cincinnati area.

© Barnes Dennig, North Side Bank and Trust, Northern Kentucky Chamber of Commerce, and USI Insurance   page 2
COMPENSATION INFORMATION
The compensation data is reflective of when the study was conducted (March / April
2021). Base and bonus information was collected from Kentucky manufacturers for 16
different positions.
In addition, data was collected about the way bonuses are calculated with the results
showing that percentage of net profits is a leading method. As shown later in this
report, the average pay increase received in 2020 was 4.4%, which is consistent with
what manufacturers are expecting for 2021, an average increase up to 3.5%.
EMPLOYEE BENEFIT INFORMATION
Manufacturers are implementing high-deductible health plans, along with buy-up
options, along with the more traditional health plan options. Use of wellness programs
continues to be a growing trend among manufacturers. Data on these strategies and
more are included in this section. Other items related to the benefit questions are below:
Companies that experienced an increase in healthcare costs reported an annual
increase of 7.1% in 2021.
Annual employee contributions range between $97 (Single) and $446 (Family).
Ten (10) companies (45%) offer health savings accounts, while 80% of those
companies make a flat dollar amount contribution directly to the employee’s HSA.
Four (4) companies (25%) charge a spousal surcharge (extra monthly contribution
from employees who spouses are eligible to participate in their own employers’
plan).
INTERNATIONAL AND COMPANY OPERATIONS
These two sections of the study offer a look at the inside workings of area
manufacturers. Identifying the top personnel or operational issues, capturing how the
current economic environment is affecting companies or sharing the positives and
negatives of doing business internationally are all included.
When it comes to your suppliers, how are you evaluating them to ensure
success into the future?
What are the key performance indicators (KPIs) to watch to ensure
financial stability for years to come?
What manufacturing-specific metrics are your company utilizing to
evaluate performance?
When it comes to doing business overseas, what are area manufacturers
doing to ensure success?
© Barnes Dennig, North Side Bank and Trust, Northern Kentucky Chamber of Commerce, and USI Insurance page 3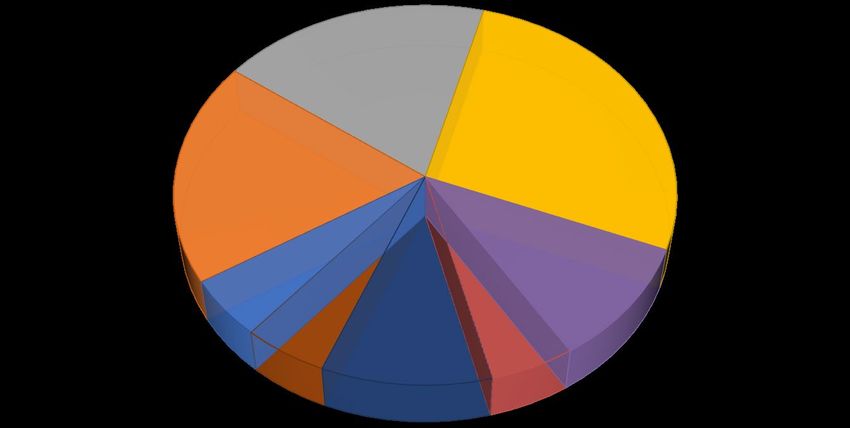
This year we asked what some of the key performance indicators (KPIs) manufacturers
are utilizing to monitor their business. Responses included:

Reliability of costing systems and integration with estimating programs is important to
manufacturers. Based on a 5-point scale (1 being poor; 5 being excellent), respondents
ranked their reliability and integration at 3.6 and 3.5 respectively. In addition, we asked
if the costing system is helping price their products. Of the companies that answered
this question, 11 companies or 73% said yes.

Companies are currently running 1.6 shifts (on average). In addition, companies are
working 7% overtime annually.

© Barnes Dennig, North Side Bank and Trust, Northern Kentucky Chamber of Commerce, and USI Insurance   page 4

2021 KENTUCKY MANUFACTURER’S COMPENSATION &
                                                                 BENEFITS BENCHMARKING STUDY

COMPANY BACKGROUND
The information gathered in this section relates to general company data including annual sales, age of
company, unionization, type of company, business structure, geographic coverage, and employee count
and turnover.

                                      Annual Sales – Companies

                                                      27%
                                5%
                                                                      18%

                                         18%
                                                                     14%

                                                      18%
                                                                           0%

                                  Under $5 Million            $5-$9.9 Million
                                  $10-$25.9 Million           $26-$50.9 Million
                                  $51-$99.9 Million           $100-$249.9 Million
                                  More than $250 Million

The largest percentage (68%) of participating companies have been in business for 30 years or more,
leaving only a small number of manufacturers who have been in business for less than 30 years.

                            Age of Companies Participating

                                   18%

                                                                                          68%

                                14%
                                            0%
                                       0%

                1-5 years old   6-10 years old     11-15 years old      16-29 years old         30+ years old

© Barnes Dennig, North Side Bank and Trust, and USI Insurance                                                   page 5
Overall, just three companies or 14% of participating companies are operating union shops.

                                  Union vs. Non-Union Manufacturers

              14%                                                    86%

       0%        10%       20%         30%       40%           50%     60%     70%      80%       90%   100%

                                                       Union     Non-Union

The vast majority (91%) of participating companies indicated that they were privately owned.

                    Company Ownership                                        Family Owned
                                       91%                                      68%

                            9%                                                                 32%

                             Private    Public                                   Yes    No

© Barnes Dennig, North Side Bank and Trust, Northern Kentucky Chamber of Commerce, and USI Insurance           page 6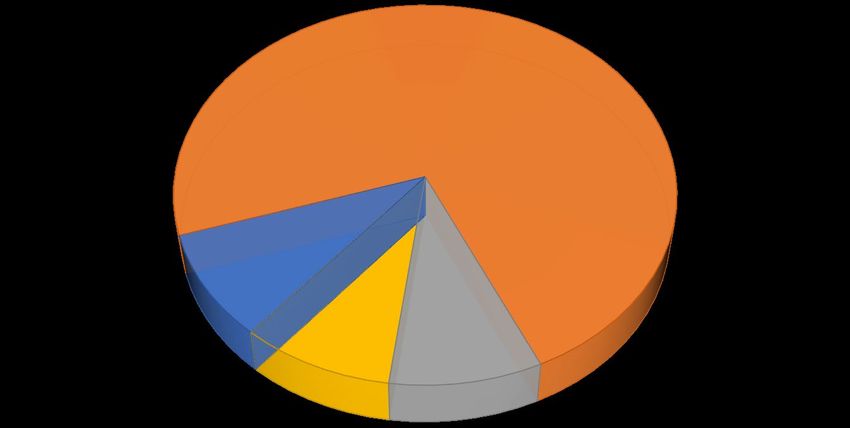
Of the 21 companies reporting on their corporate structure, 7 (33%) are S Corps, 12 (57%) are C Corps, 2
(10%) are limited liability company (LLCs).

                                    57%                                              33%                10%

       0%        10%       20%       30%       40%       50%          60%        70%        80%   90%         100%

                                     C Corp     S Corp    LLC    Partnership        Other

Seventy-seven percent (77%) of the companies sell nationally (41%) or internationally (36%), while
leaving only 23% of manufacturers that sell strictly within the Midwest (or closer markets).

                                     Company’s Primary Market

                                                                41%

                                      5%

                                  18%

                                                                      36%

                                      Local    Midwest      National        International

© Barnes Dennig, North Side Bank and Trust, Northern Kentucky Chamber of Commerce, and USI Insurance                 page 7
The ranges of Full-Time Equivalent employees for participants is noted below:

                       Full-Time Equivalent Employee Counts

                                                    19%

                                                                            27%
                                      19%

                                         5%                               10%
                                               5%
                                                                   5%
                                                          10%

              Less than 15    15-24    25-50     51-100     101-150     151-250       251-400   More than 400

The majority of manufacturers are either increasing their employee levels or keeping their workforce the
same. Eighteen percent (18%) reported increases in their employee levels while decreases were
experienced by 41% of companies.

                                  Changes in Employee Levels

                                                     41%

                                      18%

                                                                      41%

                                        Increased     Decreased       Kept the same

© Barnes Dennig, North Side Bank and Trust, Northern Kentucky Chamber of Commerce, and USI Insurance            page 8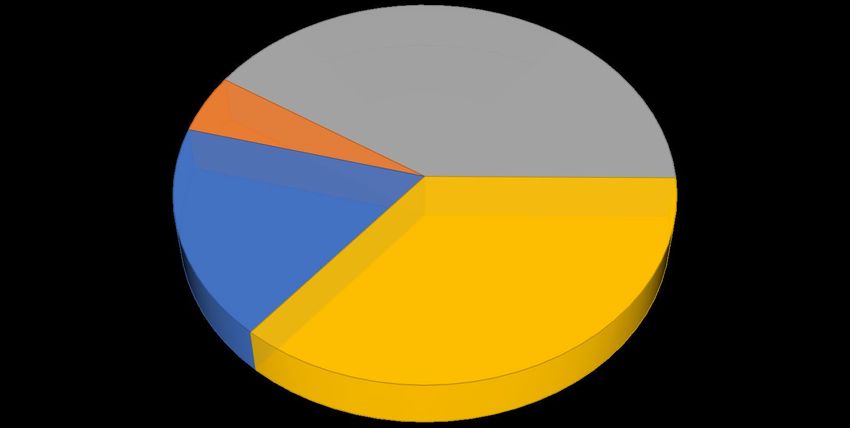
The 22 Kentucky study participants belong to the following groups:

 AWS (America Welding Society)
 Cast Stone Institute
 Chamber
 ERA
 IAPD
 KAM
 KY Restaurants Association
 National Concrete Masonry Assoc
 National Precast Concrete Association (NPCA)
 NFIB
 Northern Kentucky Chamber of Commerce (x4)
 Ohio Restaurant Association
 PMPA
 SHRM
 Supplier and Vendor Sites
 The American Institute of Architects Greater Cincinnati Home Builder's Assoc
 The Brick Industry Assoc
 The Construction Specifications Institute

© Barnes Dennig, North Side Bank and Trust, Northern Kentucky Chamber of Commerce, and USI Insurance   page 9
COMPENSATION INFORMATION
The information gathered in this section relates to the compensation structure of 16 different positions
within the company, looking at mean base salary, mean bonus, prior year averages, the range of each
salary category and the total compensation ranges. Also included is information pertaining to how
bonuses are calculated and annual pay increase ranges.
The positions surveyed include:
President/CEO
Executive/Senior Vice President
COO/Vice President, Manufacturing
CFO/Vice President, Finance
Sales/Marketing Executive
Division/General Manager
Controller/Accounting Manager
HR Executive
IT Manager
Engineer Manager
Project Manager
Shipping and Receiving Supervisor
Foreman
Plant Supervisor
Machine Operator
Supply Chain Manager
© Barnes Dennig, North Side Bank and Trust, Northern Kentucky Chamber of Commerce, and USI Insurance page 10President/CEO
% of
73% Companies 2021 Range 2021 Average
Total
Base Salary 73% 15 $95,000 - $500,000 $256,173
27% Bonus Amount 27% 13 $2,922 - $434,200 $109,830
Base Salary Bonus Amount Total Compensation $150,000 - $699,200 $351,359
Executive/Senior Vice
President
77% % of
Companies 2021 Range
2021 Average
Total
Base Salary 77% 9 $95,000 - $237,000 $162,921
23% Bonus Amount 23% 6 $2,600 - $154,419 $73,670
Total Compensation $100,000 - $310,000 $212,035
Base Salary Bonus Amount
COO/Vice President,
Manufacturing
% of
83% Total
Companies 2021 Range 2021Average
Base Salary 83% 8 $65,000 - $237,000 $135,288
17% Bonus Amount 17% 5 $10,000 - $70,000 $43,500
Base Salary Bonus Amount Total Compensation $75,000 - $307,000 $162,475
CFO/Vice President,
Finance
86% % of
Companies 2021 Range 2021 Average
Total
Base Salary 86% 8 $100,000 - $262,700 $168,270
14% Bonus Amount 14% 5 $29,344 - $50,000 $42,251
Total Compensation $125,000 - $292,044 $194,677
Base Salary Bonus Amount
© Barnes Dennig, North Side Bank and Trust, Northern Kentucky Chamber of Commerce, and USI Insurance page 11Sales/Marketing
Executive
% of
78% Total
Companies 2021 Range 2021 Average
Base Salary 78% 17 $65,000 - $230,000 $133,190
22% Bonus Amount 22% 13 $3,000 - $162,400 $47,844
Base Salary Bonus Amount Total Compensation $77,000 - $317,400 $169,776
Division/General Manager
87% % of
Companies 2021 Range 2021 Average
Total
Base Salary 87% 7 $77,000 - $207,518 $119,213
13% Bonus Amount 13% 4 * *
Base Salary Bonus Amount Total Compensation $77,000 - $244,821 $136,939
Controller/ Accounting
Manager
82% % of
Companies 2021 Range 2021 Average
Total
Base Salary 82% 12 $55,200 - $140,000 $102,123
18% Bonus Amount 18% 8 $8,000 - $67,200 $32,830
Base Salary Bonus Amount Total Compensation $55,200 - $170,000 $124,009
HR Executive
89% % of
Companies 2021 Range 2021 Average
Total
Base Salary 89% 8 $56,680 - $177,123 $107,868
11% Bonus Amount 11% 7 $2,000 - $54,469 $15,235
Base Salary Bonus Amount Total Compensation $58,680 - $193,687 $121,199
© Barnes Dennig, North Side Bank and Trust, Northern Kentucky Chamber of Commerce, and USI Insurance page 12IT Manager
% of
Companies 2021 Range 2021 Average
Total
84%
Base Salary 84% 7 $75,000 - $117,000 $99,868
16% Bonus Amount 16% 5 $8,000 - $53,000 $26,131
Base Salary Bonus Amount Total Compensation $75,000 - $163,000 $118,533
Engineer Manager
% of
87% Total
Companies 2021 Range 2021 Average
Base Salary 87% 14 $61,800 - $143,850 $100,786
13%
Bonus Amount 13% 9 $6,000 - $72,369 $23,639
Base Salary Bonus Amount
Total Compensation $61,800 - $171,126 $115,983
Project Manager
% of
Companies 2021 Range 2021 Average
Total
89%
Base Salary 89% 9 $75,000 - $102,000 $83,423
11% Bonus Amount 11% 5 $1,000 - $72,225 $19,024
Base Salary Bonus Amount Total Compensation $76,000 - $150,925 $93,992
Shipping and Receiving
Supervisor
% of
Companies 2021 Range 2021 Average
Total
94%
Base Salary 94% 13 $42,640 - $98,761 $55,119
6% Bonus Amount 6% 7 $1,000 - $20,000 $7,625
Total Compensation $42,800 - $108,637 $69,225
Base Salary Bonus Amount
© Barnes Dennig, North Side Bank and Trust, Northern Kentucky Chamber of Commerce, and USI Insurance page 13Foreman
% of
Companies 2021 Range 2021 Average
Total
93%
Base Salary 92% 6 $51,000 - $96,000 $69,517
7% Bonus Amount 8% 4 * *
Base Salary Bonus Amount Total Compensation $51,000 - $108,500 $75,494
Plant Supervisor
% of
Companies 2021 Range 2021 Average
Total
93%
Base Salary 93% 11 $42,000 - $105,000 $75,394
7% Bonus Amount 7% 6 $750 - $35,996 $10,381
Base Salary Bonus Amount Total Compensation $42,000 - $111,500 $81,056
Machine Operator
% of
Companies 2021 Range 2021 Average
Total
97%
Base Salary 97% 16 $36,000 - $68,348 $46,407
3% Bonus Amount 3% 6 $500 - $10,000 $3,667
Base Salary Bonus Amount Total Compensation $37,500 - $68,348 $47,782
Supply Chain Manager
% of
Companies 2021 Range 2021 Average
Total
93%
Base Salary 93% 8 $47,500 - $123,300 $84,223
7% Bonus Amount 7% 4 * *
Base Salary Bonus Amount Total Compensation $49,500 - $126,000 $90,689
© Barnes Dennig, North Side Bank and Trust, Northern Kentucky Chamber of Commerce, and USI Insurance page 14Of the 22 companies that responded to this question, nearly half reported awarding bonuses as a % of
net profit. Participants calculated bonuses in the following ways. (Note: Of the companies responding,
some utilize more than one way to calculate bonuses).
Bonus Calculation Criteria
60%
50% 48%
40% 38%
29%
30%
20%
14% 14% 14%
10%
0%
0%
Discretionary % of sales Personal goal achievement
Company goal achievement % of gross profit % of net profit
Other
Below is a scale of the average actual past pay increases and the anticipated increases for 2021.
Pay Increases 2020 and 2021 (anticipated)
5.0%
4.4%
4.5%
4.0%
3.5%
3.5%
3.0%
2.5%
2.0%
1.5%
1.0%
0.5%
0.0%
2020 2021
© Barnes Dennig, North Side Bank and Trust, Northern Kentucky Chamber of Commerce, and USI Insurance page 15INTERNATIONAL OPERATIONS
The spilt between international and domestic sales wase fairly consistent across revenue and employee
size. Three (3) companies do not conduct business internationally. There was one company that reported
doing the same amount of international sales as domestic.
Percentage of Sales that is Domestic vs.
International Sales
88% 12%
0% 20% 40% 60% 80% 100%
Domestic International
The following chart reveals how international sales are changing.
Change in International Sales as a
% of Total Sales
39%
22%
0% 33%
6%
Significantly increased (more than 20%) Moderately increased (1% to 20%)
Remained the same Moderately decreased (-1% to -20%)
Significantly decreased (more than -20%)
© Barnes Dennig, North Side Bank and Trust, Northern Kentucky Chamber of Commerce, and USI Insurance page 16An Interest Charge - Domestic International Sales Corporation (IC-DISC) offers U.S. exporters (who
qualify) export-related tax benefits; however, most have not considered it.
Percentage of Companies Utilizing an Interest-Charge
Domestic International Sales Corporation (IC-DISC)
77%
23%
0%
Yes, we have an IC-DISC No, but we've considered it No, and have not considered it
Do you have an Insurance Captive?
21%
74%
5%
Yes No, but we have considered it No, and have not considered it
© Barnes Dennig, North Side Bank and Trust, Northern Kentucky Chamber of Commerce, and USI Insurance page 17Lost Business to Overseas Competitor
73%
27%
Yes No
Of the companies that have international sales, the following graph shows how many have overseas
production facility/facilities. The following countries were identified as locations for international facilities:
Germany (4), Slovakia (2), Switzerland (2), and Others.
Percentage of Companies with Overseas Production Facilities
80% 75%
70%
60%
50%
40%
30% 25%
20%
10%
0%
2021
No Yes
© Barnes Dennig, North Side Bank and Trust, Northern Kentucky Chamber of Commerce, and USI Insurance page 18The following chart shows what percentage of companies have overseas sales reps. The following
countries were identified as location of sales rep offices: China (2), Mexico (2), Germany (2), Japan (2),
Italy (2), France (2), UK (2), and others.
Percentage of Companies with Overseas Sales Representative
90%
79%
80%
70%
60%
50%
40%
30%
21%
20%
10%
0%
No Yes
Employee Expense Reimbursement: Which of the following do you offer?
100% 94%
90%
90%
80%
70% 61%
60% 55%
50% 45%
39%
40%
30%
20%
10%
10% 6%
0%
Mileage expenses, rate per Car Allowance, monthly Company owned or leased Occupancy expenses
mile amount vehicle, monthly amount
Yes No
© Barnes Dennig, North Side Bank and Trust, Northern Kentucky Chamber of Commerce, and USI Insurance page 19Eight (8) of the 15 (53%) responding companies are outsourcing product components or raw materials
outside the U.S.
Outsourcing/Purchasing Product Components
Outside of US
53%
47%
Yes No
COMPANY OPERATIONS
Gross margin per full-time equivalent employee is a key performance indicator (KPI) for many
manufacturers. This amount is calculated by taking the gross margin (or gross profit) and dividing it by the
total number of full-time equivalent employees.
Gross Margin per FTE
$120,000
$99,755
$100,000
$80,000
$60,000
$40,000
$20,000
$0
Of the metrics most utilized to evaluate performance by participating companies: efficiency ranks as the
highest methods for the Kentucky companies surveyed. The companies surveyed utilize On-time delivery
second most. (See chart on following page)
Manufacturing Methods – Utilized to Evaluate Performance
© Barnes Dennig, North Side Bank and Trust, Northern Kentucky Chamber of Commerce, and USI Insurance page 2080% 74%
68%
70%
63%
60%
50% 47%
42%
40% 37%
32%
30%
20%
10%
0%
0%
Throughput Cost of Efficiency On-time Inventory Down time Safety Other
Quality delivery turnover
Participants reported the increase / decrease in the cost of raw materials over the past 12 months. Thirty-
nine percent of companies reported seeing a moderate increase in prices.
Raw Material Prices
45%
39%
40%
35% 33%
30% 28%
25%
20%
15%
10%
5%
0%
0%
Moderately decreased (-5% Remained the same Moderately increased (5% Significantly increased
to -15%) to 15%) (more than 15%)
© Barnes Dennig, North Side Bank and Trust, Northern Kentucky Chamber of Commerce, and USI Insurance page 21How would you evaluate your costing system based on the following factors?
Integration with Estimating 20% 27% 40% 13%
Reliability 14% 36% 43% 7%
0% 10% 20% 30% 40% 50% 60% 70% 80% 90% 100%
Excellent Very Good Good Below Average Poor
Does your costing system help you price your
products?
73%
27%
Yes No
© Barnes Dennig, North Side Bank and Trust, Northern Kentucky Chamber of Commerce, and USI Insurance page 22Lean manufacturing is a systematic approach to identifying and eliminating waste through continuous
improvement by flowing the product at the pull of the customer, among other principles. It has proven to
increase customer satisfaction, employee involvement and company profitability.
Companies Utilizing Lean Manufacturing
Principles
50%
50%
Yes No
Participants were asked “What do you see as the top two personnel issues facing manufacturers in
2021?” Based on the responses, recruiting/retaining qualified employees and healthcare costs have
remained at the top for all companies.
Top Personnel Issues
60%
55%
50%
40%
36%
32%
30% 27%
20% 18%
14%
9% 9%
10%
0%
0%
© Barnes Dennig, North Side Bank and Trust, Northern Kentucky Chamber of Commerce, and USI Insurance page 23Participants were asked, “What do you see as the top two operational issues facing manufacturers in
2021?” Based on the responses, the top two issues facing all companies are finding/retaining skilled
workers and controlling costs. The third top issue for companies appears to be global competition.
Top Operational Issues
70%
62% 62%
60%
50%
40%
30%
19%
20%
14%
10% 10% 10% 10%
10%
5%
0% 0%
0%
© Barnes Dennig, North Side Bank and Trust, Northern Kentucky Chamber of Commerce, and USI Insurance page 24Effects of the Current Economic Environment
40% 36%
35%
30% 27%
25% 23%
20% 18%
15% 13%
9% 9% 9%
10%
5%
5%
0%
0%
© Barnes Dennig, North Side Bank and Trust, Northern Kentucky Chamber of Commerce, and USI Insurance page 25The following graph shows that 79% of manufacturers are not utilizing measurement metrics to monitor
their key suppliers.
Utilization of Measurements/Tools to Monitor
Key Suppliers
79%
21%
Yes No
When asked to describe their company’s current financing situation, 58% (eleven) of companies
experienced no change.
Current Financial Situation
70%
58%
60%
50%
40%
30%
20% 11% 11% 11% 11%
10% 5% 5%
0% 0% 0% 0%
0%
© Barnes Dennig, North Side Bank and Trust, Northern Kentucky Chamber of Commerce, and USI Insurance page 26Twenty-nine percent (29%) of manufacturers experienced employee turnover rates between 1% and 5%
in 2020. Very few manufacturers experienced no turnover.
Previous Year Turnover Rate
35%
29%
30%
25%
19% 19%
20%
14% 14%
15%
10%
5%
5%
0%
0% 1% - 5% 6% - 10% 11% - 20% 21% - 30% Greater than 30%
© Barnes Dennig, North Side Bank and Trust, Northern Kentucky Chamber of Commerce, and USI Insurance page 27Enhanced Compensation was a top strategy for Kentucky Employers.
Strategies for Employee Recruitment Programs
60%
53%
50% 47%
40%
40%
33%
30% 27% 27% 27%
20%
20%
13% 13%
10% 7%
0%
0%
© Barnes Dennig, North Side Bank and Trust, Northern Kentucky Chamber of Commerce, and USI Insurance page 28For Kentucky manufacturers, the top strategy was flexible work arrangements with the second strategy
being increased compensation.
Strategies for Retaining Top Talent
80%
68%
70%
60% 55%
50%
41%
40%
32% 32%
30% 27% 27%
23%
18%
20%
10% 5%
0% 0%
0%
Rank the Top Two Challenges Facing Your Frontline Employees
1 63% 11% 5% 16% 5%
2 10% 21% 32% 37%
0% 10% 20% 30% 40% 50% 60% 70% 80% 90% 100%
Economic Security-Financial Wellbeing Housing
Health and Safety Transportation
Childcare Skill Development
Other
Most employers ranked economic security-financial wellbeing as the top challenge facing frontline
employees with health and skill development ranked second.
© Barnes Dennig, North Side Bank and Trust, Northern Kentucky Chamber of Commerce, and USI Insurance page 29How Would You Rate Your Organization’s Performance in Attracting and
Retaining Diversity in the Employee Base?
73%
9%
9%
9%
Very Effective Effective Ineffective Very Ineffective
What Does Your Organization Need to Better Recruit and Retain Diversity in the
Employee Base? (Check all that Apply)
50% 47%
45%
40%
35% 33%
30%
25%
20%
15%
10% 7% 7% 7%
5%
0% 0% 0% 0%
0%
Intentionally Connections to Resources and Resources and Marketing and Active and Regional Organizational Other
inclusive diverse talent training on training on brand engaged Infrastructure commitment
recruitment pools inclusive inclusive awareness Employee (e.g. adequate to focus on
strategy recruitment retention support Resource transportation recruiting and
practices practices Groups/Special options, retaining
Interest roadway diverse talent
Groups/Affinity improvements,
Groups etc.)
© Barnes Dennig, North Side Bank and Trust, Northern Kentucky Chamber of Commerce, and USI Insurance page 30How many shifts do you currently run?
50% 47%
45%
40%
35% 33%
30%
25%
20%
15%
10% 10%
10%
5%
0%
1 2 3 More than 3
Percent of Total Annual Overtime as Compared to Regular Time
8%
7%
7%
6%
5%
4%
3%
2%
1%
0%
Percent of Overtime
© Barnes Dennig, North Side Bank and Trust, Northern Kentucky Chamber of Commerce, and USI Insurance page 31Employee Benefit Information
The chart below examines benefit offerings from participant companies
Benefits Offered by Participating Companies
100% 100%100% 95%
91%
90%
80% 77%
70%
59%
60% 55% 55%
50% 50%
50% 45%
41% 41%
40% 36%
30% 27% 27%
20% 18%
14%
9% 9%
10% 5% 5% 5% 5%
0% 0%
0%
© Barnes Dennig, North Side Bank and Trust, Northern Kentucky Chamber of Commerce, and USI Insurance Page 31Number of Weeks of Vacation, Not Including Compensatory Time Off
5.00
4.40 4.40 4.40
4.50 4.30
4.00 3.90
4.00 3.90 3.80
3.50
3.50 3.30
3.10 3.30
3.10
3.00 2.70 2.70 2.60
2.30 2.50
2.50
2.20
2.00 1.90
1.50
1.00
0.50
0.00
1 year or less 2-5 years 6-9 years 10-14 years 15+ years
Officers Outside Sales Salaried Professionals Hourly Associates
Does your 401(k) Program Allow for Discretionary Profit Sharing?
48%
52%
Yes No
© Barnes Dennig, North Side Bank and Trust, Northern Kentucky Chamber of Commerce, and USI Insurance Page 32The following graph depicts 401(k) plan structures of manufacturing organizations:
Additional 401(k) Options Offered
90%
82%
80%
71%
70%
59%
60%
50%
40%
30%
20%
10%
0%
Roth Provisions Safe Harbor Plan Allowance for Loans
Column1
Twenty-four percent (24%) of manufacturers reported making a profit-sharing contribution last year.
Did the Company Make a Profit-Sharing Contribution Last Year?
76%
24%
Yes No
© Barnes Dennig, North Side Bank and Trust, Northern Kentucky Chamber of Commerce, and USI Insurance Page 33Health Insurance Plans
When manufacturers look at funding a health insurance plan, the majority are fully insured:
Health Insurance Plan Funding
52%
48%
Fully Insured
Partially self-insured with stop loss protection for excessive claims
Other
Do not provide health insurance plan
Programs Utilized to Manage Claims
Other 0%
Prescription Carve-out 29%
Predictive Modeling 0%
Concurrent Review 14%
Disease Management 43%
Medical Case Management 79%
Pre-Certification 29%
Health Risk Assessment 14%
Utilization Management 57%
Health Screening (blood draw, pressure, etc.) 29%
Wellness Education 71%
0% 10% 20% 30% 40% 50% 60% 70% 80% 90%
© Barnes Dennig, North Side Bank and Trust, Northern Kentucky Chamber of Commerce, and USI Insurance Page 34PPO is the most common plan type (86% of companies utilize this type of plan), as shown below. Health
Savings Account (HSA) is the second most popular type of plan offer, while fewer organizations offer a
Health Reimbursement Account or HMO.
Health Plans Offered
100%
90% 86%
80%
70%
60% 57%
50%
40%
29%
30%
20% 14%
10% 5%
0%
HMO PPO Health Health Savings Acct Other
Reimbursement Acct
The following charts look at what employees are contributing to their core health insurance plans.
% of Premium Paid by Employee
36%
35% 35%
35%
34%
33% 33%
33%
32% 32% 32%
32%
31%
31%
30%
29%
2020 2021 2020 2021 2020 2021 2020 2021
Single Employee/Spouse Employee/Children Family
© Barnes Dennig, North Side Bank and Trust, Northern Kentucky Chamber of Commerce, and USI Insurance Page 35Gross Premium Per Month
$1,600.00 $1,512.37
$1,453.09
$1,400.00
$1,200.00
$1,051.69
$1,015.68
$1,000.00 $943.23 $855.47
$800.00
$600.00 $501.22 $491.31
$400.00
$200.00
$0.00
2020 2021 2020 2021 2020 2021 2020 2021
Single Employee/Spouse Employee/Children Family
Employee Contribution Per Month
$500
$438 $446
$450
$400
$350
$302 $301 $289
$300
$260
$250
$200
$150
$90 $97
$100
$50
$0
2020 2021 2020 2021 2020 2021 2020 2021
Single Employee/Spouse Employee/Children Family
© Barnes Dennig, North Side Bank and Trust, Northern Kentucky Chamber of Commerce, and USI Insurance Page 36Insurance gross premiums have been on the rise for several years, and in this study, the results are the
same. Year-over-year increases continue to average around 8%.
20%
18%
18%
16%
14%
12%
10% 9%
8% 7%
6%
4%
2%
N/A
0%
% Increase % Decrease % Increase % Decrease
From 2018-2019 From 2020-2021
© Barnes Dennig, North Side Bank and Trust, Northern Kentucky Chamber of Commerce, and USI Insurance Page 37Health Savings Accounts
Consumer driven health plans are one of the most popular ways to cut healthcare costs. Eighty one
percent (81%) of participants have considered them or are reviewing them in 2021.
Have You Considered Consumer Driven Health Plans?
81%
5%
14%
Yes Will be Reviewing sometime in 2021 No
Our results show that out of the 22 Kentucky participants, 14 companies (64%) offer health savings
accounts, while 43% of those companies make a flat dollar amount contribution directly to the employee’s
HSA.
Employer Contribution to Employee HSA Accounts
120%
100% 100%
100%
80%
57%
60%
43%
40%
20%
0% 0%
0%
Flat Amount We Match a Percentage of Other
Employee Contribution
Yes No
© Barnes Dennig, North Side Bank and Trust, Northern Kentucky Chamber of Commerce, and USI Insurance Page 38COST SAVING STRATEGIES
Wellness programs are the buzz of today’s strategies to control healthcare increases. The graph below
shows that 90% of respondents claim wellness programs are important for controlling healthcare costs.
Importance of Wellness Program
in Controlling Healthcare Costs
47%
14%
29%
10%
Very Important Important Somewhat Important Not Important
Do you provide a Health Risk Assessment for employees?
48%
52%
Yes No
© Barnes Dennig, North Side Bank and Trust, Northern Kentucky Chamber of Commerce, and USI Insurance Page 39Innovative strategies are being utilized by company management teams. One of the more popular
strategies is charging a monthly surcharge for individuals with high-risk lifestyles. Fourteen percent (14%)
of participants charge an additional premium to tobacco users while other high-risk surcharges were not
as widely implemented.
Surcharge for High-Risk Lifestyles
120%
100%
100% 91%
86%
80%
60%
40%
20% 14%
9%
0%
0%
Tobacco Use Exceeding Body Weight Benchmarks Other
Yes No
© Barnes Dennig, North Side Bank and Trust, Northern Kentucky Chamber of Commerce, and USI Insurance Page 40One option for employers to control healthcare costs is spousal exclusion, when the spouse is eligible
under their own employer’s plan. The following chart depicts participants’ policies for covering spouses
with coverage through their employer.
Policies for Addressing a Spouse Eligible for Coverage on
Their Own Employer’s Plan
80% 75%
70%
62%
60%
50%
38%
40%
30% 25%
20%
10%
0%
Exclude such spouse from coverage Add a surcharge to the employee contribution
Yes No
© Barnes Dennig, North Side Bank and Trust, Northern Kentucky Chamber of Commerce, and USI Insurance Page 41Controlling healthcare costs is one of the most important issues facing companies today. In addition to
the re-structuring of plans, below are additional strategies manufacturers are considering in order to
control healthcare costs:
Future Strategies for Controlling Healthcare Costs
Implement Health Savings Accounts (HSA) and High
15% 15% 65% 5%
Deductible Plans
Increase employee payroll contribution 33% 22% 12% 33%
Increase employee cost sharing (copays, deductible,
10% 16% 32% 42%
etc.) for Healthcare Services
Implement new health plan providers 5% 25% 50% 20%
Implement Health Reimbursement Arrangements (HRA) 6% 33% 22% 39%
Implement Dependent Audits 11% 21% 21% 47%
Host On-Site Nurse/Physician/Clinic 5% 37% 58%
0% 10% 20% 30% 40% 50% 60% 70% 80% 90% 100%
Key Strategy Significant Interest Some Interest Not Considering
© Barnes Dennig, North Side Bank and Trust, Northern Kentucky Chamber of Commerce, and USI Insurance Page 42At any time in the last two years have you had a specialty
prescription drug claim in excess of $100,000 annually?
20% 80%
Yes No
© Barnes Dennig, North Side Bank and Trust, Northern Kentucky Chamber of Commerce, and USI Insurance Page 43Compiled and Published by:
You can also read