Kairos Aerospace Technical White Paper: Methane Detection
←
→
Page content transcription
If your browser does not render page correctly, please read the page content below
Kairos Aerospace
                     Technical White Paper: Methane Detection
                         Elena S.F. Berman, Erin B. Wetherley, Brian B. Jones

Introduction
The Kairos Aerospace LeakSurveyor™ is a light-aircraft mounted, integrated methane gas imaging
system which detects large methane emissions from as much as 150 square miles of oil and gas
infrastructure in a single day. LeakSurveyor provides georeferenced methane emissions data
combined with real-time optical imagery for accurate methane source attribution and
quantification. Kairos Aerospace offers methane detection as a service, eliminating customers’
need for capital outlays, operator training, raw data analysis, and instrument upkeep. During
2019 and 2020, Kairos Aerospace has inspected more than 136,000 wells and over 42,000 miles
of pipeline in North America for methane emissions, resulting in the elimination of more than 8
billion cubic feet of methane releases. The Kairos Aerospace LeakSurveyor provides customers
actionable data on large-scale methane fugitive emissions in a timely and cost-effective offering.

 WEB: kairosaerospace.com | EMAIL: info@kairosaerospace.com | PHONE: (650) 386-5785 | LOCATION: Mountain View, CA
                               Methane Detection Technical White Paper: Revision 1F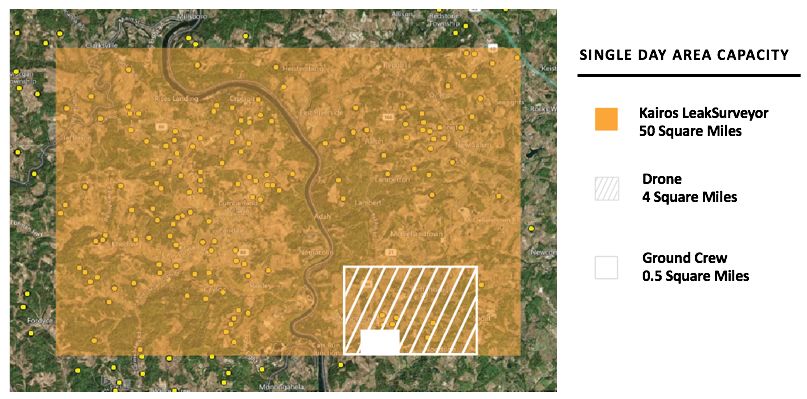
Background
Cost-effective detection of methane plumes, particularly from fugitive methane emissions, has
become a high priority for industry and governments alike. There are many challenges to
detecting fugitive methane emissions including, but not limited to, the large number of potential
emission sources over vast geographical areas, the unpredictable and intermittent nature of
fugitive emissions, and the wide range of leak sizes. Recent research has shown that fossil
methane emissions are most likely underestimated in current inventories1,2,3. Zavala-Araiza et
al. concluded that total methane emissions correspond to 1.5% of natural gas production4.

Furthermore, consensus is emerging that a small percentage of leaks account for a
disproportionately large percentage of the total volume of gas released (5, 6 and 7 among many
others). For example, Brandt et al. in a review of 15,000 measurements in the literature, showed
that 5% of the leaks were responsible for contributing over 50% of the total volume of released
methane5. Many others have found similar distributions; recently Rella et al. surveyed oil and
gas producing wells and found that 6% of sites produced 50% of emissions8 and Yacovitch et al.
surveyed a variety of oil and gas infrastructure to find that 7.5% of emitters contributed 60% of
the total methane emissions9. These largest emissions have been dubbed “super-emitters” and,
as Brandt et al.10 note, “present an opportunity for large mitigation benefits [for] reliable
(possibly remote) methods to rapidly identify and fix the small fraction of high-emitting sources.”
While there is wide agreement on the importance of “super-emitters”, it has in the past been
difficult to ascertain the distribution of large leaks due to studies having small sample sizes; Kairos
data suggests that the distribution is even more heavily weighted towards the large emission
sources than previously thought.

In terms of both driving operational efficiency and environmental benefit, fugitive emission
monitoring systems that give equal weight to identifying very small leaks and larger ones are
ineffective due to the outsized impact super-emitters play in the distribution of emissions. Kairos
 WEB: kairosaerospace.com | EMAIL: info@kairosaerospace.com | PHONE: (650) 386-5785 | LOCATION: Mountain View, CA
                               Methane Detection Technical White Paper: Revision 1F
Aerospace has rethought the value proposition of a fugitive emissions monitoring program to
focus exclusively on identifying medium and large leaks as quickly as possible. Given the outsized
effect that super-emitters have on methane emissions, the timely detection of large methane
leaks is the most cost-effective way to reduce total methane emissions, and subsequently
minimize environmental impact, enhance safety, and reduce product loss.
Kairos Aerospace Integrated Methane Imaging System
Approach
Based on this current research, the Kairos Aerospace LeakSurveyor is intentionally designed to
cost-effectively detect medium and large methane emission sources over expansive geographical
areas. The LeakSurveyor instrument is easily mounted on widely-available, light aircraft and
flown at standard, general-aviation altitudes of 3,000 ft above ground level (AGL), making it faster
and safer than both helicopters and low-flying aircraft. Light aircraft can fly longer and farther
than commercially available drones, which rarely have battery lives of more than a few hours,
limiting their flight range and increasing their cost. Drones are also subject to complex and
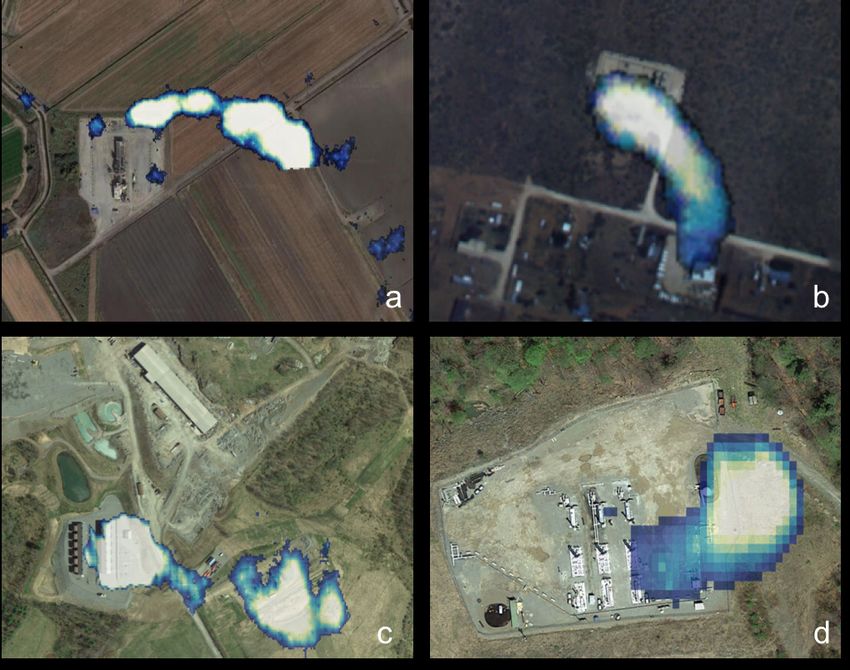
shifting state regulatory requirements. The LeakSurveyor system is faster and less expensive
than a ground crew, particularly over the large geographical areas typically covered by oil and
Figure 1: LeakSurveyor covers orders of magnitude more area than a ground crew, covering hundreds of assets in
a single day and allowing frequent revisits. Small yellow squares indicate gas wells and facilities.
WEB: kairosaerospace.com | EMAIL: info@kairosaerospace.com | PHONE: (650) 386-5785 | LOCATION: Mountain View, CA
Methane Detection Technical White Paper: Revision 1F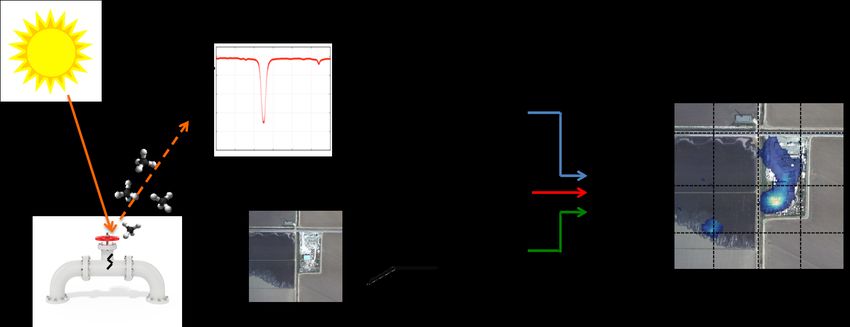
gas infrastructure (Figure 1).       Ground crews spend the majority of their time driving between
sites and surveying sites with no significant emissions; this is time that could be spent verifying,
and fixing, the most critical emissions11.

LeakSurveyor can monitor thousands of facilities or hundreds of miles of linear pipeline
infrastructure in a single day, quickly determining which assets need attention and allowing
frequent retesting of sites. LeakSurveyor can thus serve as the foundation in a tiered emissions
detection strategy that combines frequent aerial monitoring for large emissions with ground
teams for verification and repairs. Furthermore, Kairos provides operators with the data needed
to transparently report on Environmental, Social, and Governance (ESG) commitments.

In addition, Kairos Aerospace operates LeakSurveyor as a service to our customers; Kairos
performs all the data collection and processing, providing customers with actionable information
about assets surveyed. Customers require no capital outlays for equipment like aircraft and
sensors, no training of personnel, no instrument calibration, maintenance, or repairs, and no
complicated data analysis. Kairos eliminates the possibility of operator error or variation as all
protocols, from pre-survey calibration to post-survey data quality assurance, are performed by
highly-trained Kairos-employed engineers.

Instrumentation:
The patented Kairos Aerospace LeakSurveyor system consists of three integrated measurement
capabilities: 1) an infrared spectrometer that detects methane; 2) GPS and inertial monitoring
units (IMU) to record precise position; and, 3) an optical camera for visual verification of sites.
When reflected sunlight passes through a plume of gas, the gas molecules absorb certain
wavelengths in the infrared. Each type of gas molecule absorbs specific wavelengths of light
while letting others pass, as shown in Figure 2 for methane, water, carbon dioxide, and ethane.

 WEB: kairosaerospace.com | EMAIL: info@kairosaerospace.com | PHONE: (650) 386-5785 | LOCATION: Mountain View, CA
                               Methane Detection Technical White Paper: Revision 1F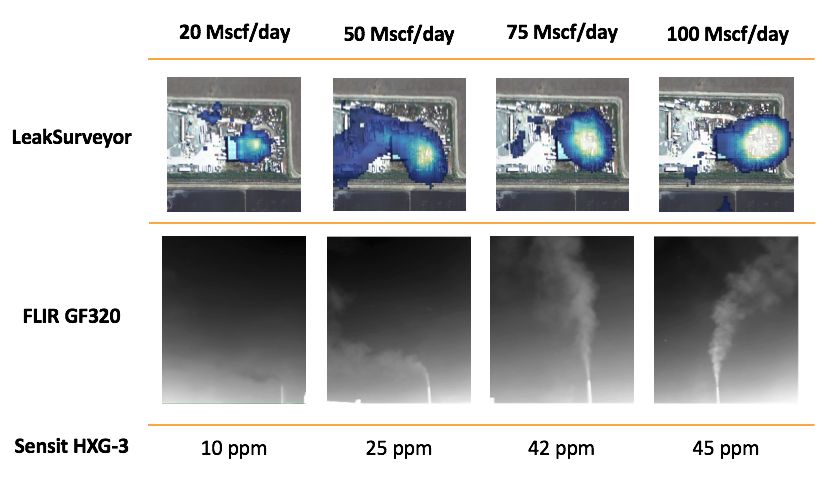
Figure 2: Absorption spectrum of methane (green), water (black), carbon dioxide (red), and ethane
        (blue) in the infrared region of the electromagnetic spectrum. Plot courtesy of Spectralcalc.
LeakSurveyor collects reflected sunlight and measures the absorption of infrared light (Figure 3).
The spectrometer detects the specific pattern of methane absorption at high spectral resolution,
avoiding signal confusion from other gases like carbon dioxide, water vapor, and ethane.
LeakSurveyor measures the total concentration of methane along the path of the light entering
the instrument and determines the amount of methane in excess of the standard atmospheric
methane concentration. Excess methane concentration is driven by both methane release rate
and the speed of wind that dissipates the methane plume.

        Figure 3: Sunlight reflects off the ground and passes through methane molecules in a plume,
        which absorb certain frequencies of the infrared light while letting others pass through.
        LeakSurveyor translates these absorption features into an image of detected methane.

 WEB: kairosaerospace.com | EMAIL: info@kairosaerospace.com | PHONE: (650) 386-5785 | LOCATION: Mountain View, CA
                               Methane Detection Technical White Paper: Revision 1F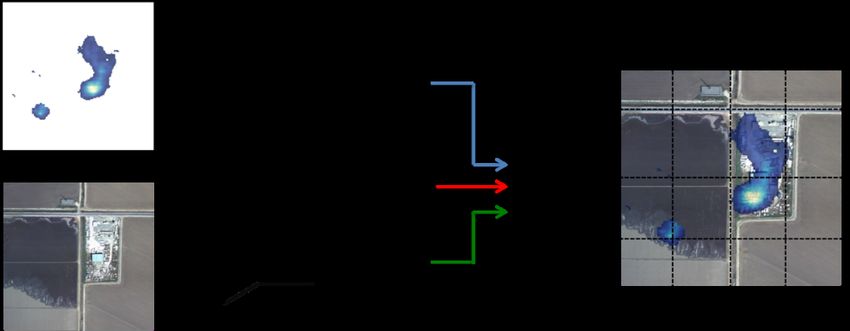
Raw spectral data is automatically processed using proprietary, innovative data analytics
including atmospheric retrieval techniques and advanced chemometric routines. This automated
data pipeline converts raw spectral data into a set of images: sunlight illumination, confidence
metrics, and detected methane plumes. Kairos engineers then review the data to identify high-
confidence methane plumes. The methane data is combined with the precise location
information provided by the GPS and IMU instrumentation. Finally, the geolocated methane
images are superimposed on optical images that were collected at the same time as the methane
data (Figure 4). This combination of methane detection, precise geolocation that can feed into
customers’ in-house mapping tools, and optical data allows the customer to determine the
location and likely source of the methane plume.

              Figure 4: Conceptual diagram (with actual field imagery) of the LeakSurveyor
              instrument, which synthesizes data from a methane spectrometer, GPS and IMU
              instrumentation, and an optical camera to create a single georeferenced image of a
              methane plume superimposed on an optical image.

Performance
The Kairos Aerospace LeakSurveyor has detected methane emissions from more than 136,000
wells and over 42,000 miles of pipeline in North America in the last 2 years. In a subset of flights
for which we have accurate inventories of ground infrastructure, 2% of production sites (a mix of
wells, tank batteries, separation units, etc.) were found to be medium or large methane emission
sources.    Figure 5 shows false-color images of example methane plumes detected by
LeakSurveyor over working oil and gas facilities; these methane emissions were detected

 WEB: kairosaerospace.com | EMAIL: info@kairosaerospace.com | PHONE: (650) 386-5785 | LOCATION: Mountain View, CA
                               Methane Detection Technical White Paper: Revision 1F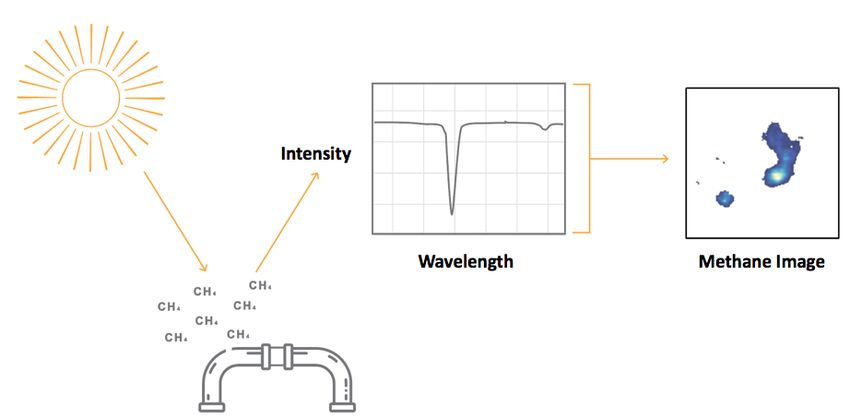
emanating from an underground gas storage facility, an underground gas gathering pipeline, a
compressor station, and a well pad.

        Figure 5: False color methane plume images collected by LeakSurveyor in the field over a
        working underground storage facility (a), an underground gathering pipeline (b), a compressor
        station (c), and a well pad (d).

Kairos has a robust set of calibration and validation procedures designed to provide consistent
results to our customers across many flights and over time. Forty-five automated data quality
checks are performed on each flight data set to ensure optimal data quality. These include checks
on flight operations, hardware performance, and data integrity. Furthermore, Kairos engineers
inspect and interpret the results from each flight prior to delivery to the customer.

Some leak detection technologies are sensitive to false positive results due to dust in the area of
investigation. Kairos has conducted on-the-ground tests of dust interference, with no methane
signal detected from dust plumes. As can be seen in Figure 6, while methane is clearly detected

 WEB: kairosaerospace.com | EMAIL: info@kairosaerospace.com | PHONE: (650) 386-5785 | LOCATION: Mountain View, CA
                               Methane Detection Technical White Paper: Revision 1F
at the site of methane release, no methane signal is detectable over the dust plume created by
farming equipment.
Figure 6: Dust clouds created by equipment (left) create no detectable interference to the methane signal
produced by LeakSurveyor instrumentation (right, no methane signal observable at dust cloud, orange arrow).
Methane signal is clearly observable over the release site (right).
To simulate real-world operational conditions, Kairos routinely flies LeakSurveyor
instrumentation above controlled methane releases of known release rate in order to
characterize the detection sensitivity of our spectrometers. Methane is released from a point
source at varying well-controlled rates and detected using LeakSurveyor instrumentation with
Kairos’ standard practice of measuring each plume at least twice. Furthermore, in October of
2019, Stanford University researchers conducted a 4 day, independent, blinded controlled-
release trial of the Kairos LeakSurveyor system. Figure 7 shows the measured probability of
detecting emissions of various sizes over multiple flights, in multiple geographic regions, and
measured using five different LeakSurveyor instruments in our fleet. The blinded Stanford data
is included in this analysis. A best fit curve to the data shows that the 50% probability of detection
occurs at 4.6 Mscf/day (thousand standard cubic feet per day) per mph of wind; this result is
similar between instruments and different geographical locations. Wind speed is an important
factor in all emissions detection methodologies including ground-based optical gas imaging; wind
will naturally dissipate any methane that is released and should be considered whenever one
WEB: kairosaerospace.com | EMAIL: info@kairosaerospace.com | PHONE: (650) 386-5785 | LOCATION: Mountain View, CA
Methane Detection Technical White Paper: Revision 1Fassesses methane detection technology. For this reason, we quote our detection probabilities
with reference to wind speed and closely monitor wind and other environmental conditions for
all flights in order to ensure the highest data quality.
Figure 7: Aerial methane imaging probability of detection as a function of methane emission size and wind
speed. The fit shows that the 50% probability of detection after two passes over a methane plume occurs at 4.6
Mscf/day per mph of wind. Data taken on twelve different occasions in three different locations using five
different LeakSurveyor instruments in our fleet.
Figure 8 shows a controlled methane release where methane emissions were simultaneously
monitored using LeakSurveyor from an airplane flying at 3,000 ft. AGL, a FLIR GasFinder 320 IR
camera pointed at the release valve from 50 ft. away, and a Method 21 analyzer held 20 ft. from
the valve.
WEB: kairosaerospace.com | EMAIL: info@kairosaerospace.com | PHONE: (650) 386-5785 | LOCATION: Mountain View, CA
Methane Detection Technical White Paper: Revision 1FFigure 8: Comparison of emissions monitoring technology results during a controlled methane
release. The brightness of the methane plume image reflects differences in the size of the release.
Quantification
Kairos also quantifies the rate of release of methane emissions. The accuracy of the
quantification is demonstrated by comparing the measured methane release rate compared with
known release rates from controlled methane release tests. Figure 9 displays the data from the
same twelve controlled releases shown above in Figure 7, including the four days of blinded
controlled releases performed by Stanford researchers. Figure 9 shows that the best fit line to
this data (blue) is in excellent agreement with the line of perfect agreement (black). This indicates
that, while individual measurements show some scatter, aggregate data across a geographical
area would be expected to be very accurate. It is important also to note that while accurate
quantification relies on accurate measurement of the wind speed, a reasonable estimate of the
leak rate can be determined using publicly available weather databases.
WEB: kairosaerospace.com | EMAIL: info@kairosaerospace.com | PHONE: (650) 386-5785 | LOCATION: Mountain View, CA
Methane Detection Technical White Paper: Revision 1FFigure 9: Quantification of methane release rate shown for controlled release data from twelve different
occasions in three different locations and on five different instruments. The best fit line shows excellent
agreement with the line of perfect agreement.
Kairos Aerospace is committed to continuously improving both our spectrometers and our data
analytics, providing improved data quality and detection thresholds to our customers. This
means that each flight is performed with the most up-to-date hardware and software available.
In addition, we regularly perform additional flight testing and controlled methane releases to
quantify data quality improvements.
Conclusion
The Kairos Aerospace LeakSurveyor detects large methane emissions over expansive
geographical areas cost-effectively. LeakSurveyor has scanned for methane emissions from
more than 136,000 wells and over 42,000 miles of pipeline in North America, resulting in the
elimination of more than 8 billion cubic feet of methane releases between 2017 and 2020.
Kairos Aerospace reports methane emissions as georeferenced images of methane plumes
superimposed on concurrently-collected optical images of an emissions site for accurate
methane source attribution. In this way, Kairos Aerospace LeakSurveyor provides customers
WEB: kairosaerospace.com | EMAIL: info@kairosaerospace.com | PHONE: (650) 386-5785 | LOCATION: Mountain View, CA
Methane Detection Technical White Paper: Revision 1Factionable data on large-scale methane fugitive emissions over a wide geographical area in a
timely and cost-effective service offering.
References
1
Petron, G. et al. (2012). Hydrocarbon emissions characterization in the Colorado Front Range: A pilot study. JGR,
117 (D4). doi: 10.1029/2011JD016360
2
Miller, S. et al. (2013). Anthropogenic emissions of methane in the United States. PNAS, 110 (50), 20018-20022.
doi: 10.1073/pnas.1314392110
3
Brandt, A. et al. (2014). Methane leaks from North American natural gas systems. Science, 343 (6172), 733-735.
doi: 10.1126/science.1247045
4
Zavala-Araiza, D. et al. (2015). Reconciling divergent estimates of oil and gas methane emissions. PNAS, 112 (51),
15597-15602. doi: 10.1073/pnas.1522126112
5
Brandt, A., Heath, G., and Cooley, D. (2016). Methane leaks from natural gas systems follow extreme
distributions. Environ. Sci. Technol., 50 (22), 12512–12520. doi: 10.1021/acs.est.6b04303
6
Frankenberg, C. et al. (2016). Airborne methane remote measurements reveal heavy-tail flux distribution in Four
Corners region. PNAS, 113 (35), 9734–9739. doi: 10.1073/pnas.1605617113.
7
Hendrick, M. et al. (2016). Fugitive methane emissions from leak-prone natural gas distribution infrastructure in
urban environments. Environmental Pollution, 213, 710-716. doi: 10.1016/j.envpol.2016.01.094
8
Rella, C. et al. (2015). Measuring emissions from oil and natural gas producing well pads in the Barnett Shale
region using the novel mobile flux plane technique. Environ. Sci. Technol., 49 (7), 4742– 4748. doi:
10.1021/acs.est.5b00099
9
Yacovitch, T. et al. (2015). Mobile Laboratory Observations of Methane Emissions in the Barnett Shale Region.
Environ. Sci. Technol., 49 (13), 7889-7895. doi: 10.1021/es506352j
10
Brandt, A. et al. (2014). Methane leaks from North American natural gas systems. Science, 343 (6172), 733-735.
doi: 10.1126/science.1247045
11
Sridharan, S., Lazarus, A., Reese, C., Wetherley, E., Bushko, K. and Berman, E., (2020). Long Term, Periodic Aerial
Surveys Cost Effectively Mitigate Methane Emissions. In SPE Annual Technical Conference and Exhibition. Society of
Petroleum Engineers. doi: https://doi.org/10.2118/201312-MS
WEB: kairosaerospace.com | EMAIL: info@kairosaerospace.com | PHONE: (650) 386-5785 | LOCATION: Mountain View, CA
Methane Detection Technical White Paper: Revision 1FYou can also read