FY 2020 RESULTS - MARANELLO 2.2.2021 - Ferrari Corporate

 
CONTINUE READING
FY 2020 RESULTS - MARANELLO 2.2.2021 - Ferrari Corporate
FY 2020
RESULTS

MARANELLO   2.2.2021
FY 2020 RESULTS - MARANELLO 2.2.2021 - Ferrari Corporate
SAFE HARBOR
STATEMENT

This document, and in particular the section entitled “2021 Guidance”, contain forward-looking statements. These statements may include terms such as “may”, “will”,
“expect”, “could”, “should”, “intend”, “estimate”, “anticipate”, “believe”, “continue”, “remain”, “on track”, “successful”, “grow”, “design”, “target”, “objective”, “goal”, “forecast”,
“projection”, “outlook”, “prospects”, “plan”, “guidance” or similar terms. Forward-looking statements are not guarantees of future performance. Rather, they are based
on the Group’s current expectations and projections about future events and, by their nature, are subject to inherent risks and uncertainties. They relate to events and
depend on circumstances that may or may not occur or exist in the future and, as such, undue reliance should not be placed on them.

Actual results may differ materially from those expressed in such statements as a result of a variety of factors, including: the Group’s ability to preserve and enhance
the value of the Ferrari brand; the success of the Group’s Formula 1 racing team and the expenses the Group incurs for its Formula 1 activities, the impact of the
application of the new Formula 1 regulations (both financial and technical) progressively coming into effect from 2021 and 2022, the uncertainty of the sponsorship and
commercial revenues the Group generates from its participation in the Formula 1 World Championship, including as a result of the impact of the Covid-19 pandemic, as
well as the popularity of Formula 1 more broadly; the Group’s ability to keep up with advances in high performance car technology and to make appealing designs for
its new models; Group’s ability to preserve its relationship with the automobile collector and enthusiast community; changes in client preferences and automotive
trends; changes in the general economic environment, including changes in some of the markets in which the Group operates, and changes in demand for luxury
goods, including high performance luxury cars, which is highly volatile; competition in the luxury performance automobile industry; the Group’s ability to successfully
carry out its growth strategy and, particularly, the Group’s ability to grow its presence in growth and emerging market countries; the Group’s low volume strategy;
reliance upon a number of key members of executive management, employees, and the ability of its current management team to operate and manage effectively; the
performance of the Group’s dealer network on which the Group depend for sales and services; increases in costs, disruptions of supply or shortages of components
and raw materials; disruptions at the Group’s manufacturing facilities in Maranello and Modena; the effects of the evolution of and response to the Covid-19 pandemic;
the effects of Brexit; the performance of the Group’s licensees for Ferrari-branded products; the Group’s ability to protect its intellectual property rights and to avoid
infringing on the intellectual property rights of others; the ability of Maserati, the Group’s engine customer, to sell its planned volume of cars; the Group’s continued
compliance with customs regulations of various jurisdictions; the impact of increasingly stringent fuel economy, emission and safety standards, including the cost of
compliance, and any required changes to its products; the challenges and costs of integrating hybrid and electric technology more broadly into Group’s car portfolio
over time; product recalls, liability claims and product warranties; the adequacy of its insurance coverage to protect the Group against potential losses; the Group’s
ability to ensure that its employees, agents and representatives comply with applicable law and regulations; the Group’s ability to maintain the functional and efficient
operation of its information technology systems, including the Group’s ability to defend from the risk of cyberattacks, including on its in-vehicle technology; the Group’s
ability to service and refinance its debt; the Group’s ability to provide or arrange for adequate access to financing for its dealers and clients, and associated risks; labor
relations and collective bargaining agreements; exchange rate fluctuations, interest rate changes, credit risk and other market risks; changes in tax, tariff or fiscal
policies and regulatory, political and labor conditions in the jurisdictions in which the Group operates, including possible future bans of combustion engine cars in cities
and the potential advent of self-driving technology; potential conflicts of interest due to director and officer overlaps with the Group’s largest shareholders and other
factors discussed elsewhere in this document.

The Group expressly disclaims and does not assume any liability in connection with any inaccuracies in any of the forward-looking statements in this document or in
connection with any use by any third party of such forward-looking statements. Any forward-looking statements contained in this document speak only as of the date of
this document and the Company does not undertake any obligation to update or revise publicly forward-looking statements. Further information concerning the Group
and its businesses, including factors that could materially affect the Company’s financial results, is included in the Company’s reports and filings with the U.S. Securities
and Exchange Commission, the AFM and CONSOB.

                                                                                                                                                         February 2, 2021             2
FY 2020 RESULTS - MARANELLO 2.2.2021 - Ferrari Corporate
PROVING RESILIENCE

2020 results exceeded full year
guidance on all metrics driven by
record fourth quarter results:
EBITDA(1) at €1,143M, margin at
33.0% and solid Industrial FCF(1) of
€172M despite Covid-19 pandemic

2021 guidance targeting a
strong rebound

Successful digital unveilings of
Portofino M, SF90 Spider and
488 GT Modificata

Ferrari ranks A- according to
Carbon Disclosure Project

    Note: (1) Refer to notes to the presentation in the Appendix   February 2, 2021   3
FY 2020 RESULTS - MARANELLO 2.2.2021 - Ferrari Corporate
COVID-19 IMPACTS ON 2020

CARS AND                                             BRAND
SPARE PARTS                  FORMULA 1               ACTIVITIES                 ENGINES

7-week production            Racing calendar         Lower royalties            Further reduction in
suspension, partially        reduced to 17 races                                engine supply to
recovered, leading to                                Reduced in-store traffic   Maserati
deliveries down 10% vs. PY   Lower commercial and
                             sponsorship revenues    Lower museum and           Lower rental revenues
Delays in the                vs. 2019                theme parks visitors       from other Formula 1
industrialization phase                                                         racing teams
of SF90 Stradale             New Technical           Execution delays
                             Regulations postponed
Reprioritizing projects      from 2021 to 2022
ensuring long-term
success

                                                                                      February 2, 2021   4
FY 2020 RESULTS - MARANELLO 2.2.2021 - Ferrari Corporate
MODELS PRESENTED IN 2020

                           February 2, 2021   5
FY 2020 RESULTS - MARANELLO 2.2.2021 - Ferrari Corporate
FY 2020 HIGHLIGHTS

SHIPMENTS(2)                                                                                NET REVENUES
(UNITS)                                                                                     (€M)

FY '20                               9,119                                                   FY '20                               3,460
                                                                    -10.0%                                                                        -8.1%
FY '19                                   10,131                                              FY '19                                     3,766

EBITDA(1)                                                                                   EBIT
(€M and margin %)                                                                           (€M and margin %)

FY '20                               1,143        33.0%                                      FY '20                       716   20.7%

                                                                    -10.0%                                                                        -21.9%
FY '19                                      1,269       33.7%                                FY '19                               917     24.4%

ADJ. DILUTED EARNINGS PER SHARE(1)(3)                                                       INDUSTRIAL FREE CASH FLOW(1)
(€)                                                                                         (€M)

FY '20                       2.88                                                            FY '20                 172
                                                                     -22.4%                                                                       -74.6%
FY '19                                      3.71                                             FY '19                                       675

                          Note: (1) (2) (3) Refer to notes to the presentation in the Appendix                                     February 2, 2021    6
FY 2020 RESULTS - MARANELLO 2.2.2021 - Ferrari Corporate
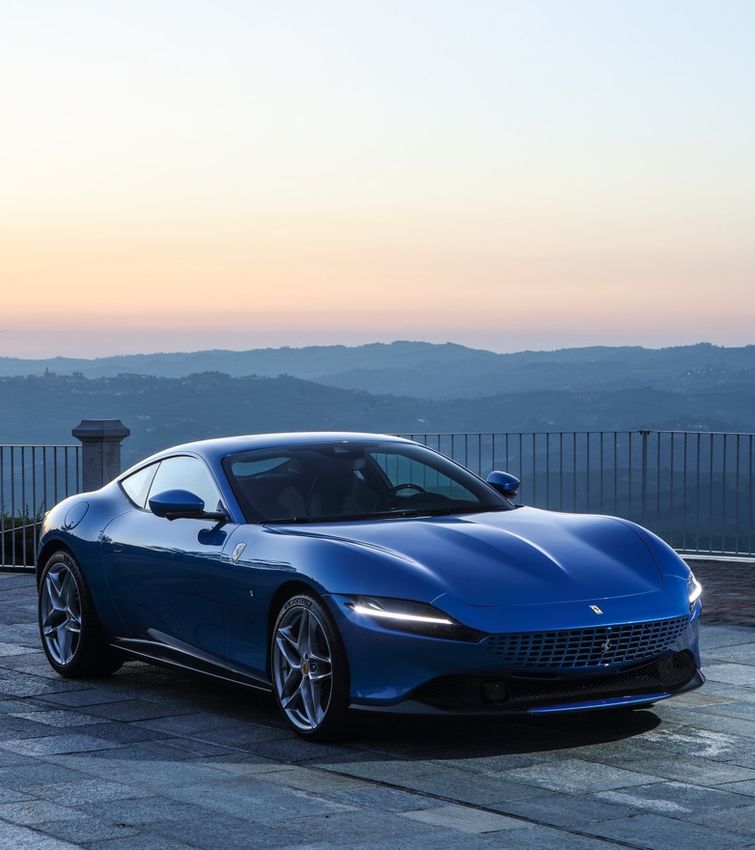
NET REVENUES AND EBITDA(1)
QUARTERLY EVOLUTION

NET REVENUES
(€M)

                                                                                                                            1,069
                                            984
       940         932                                                                         915              927
                                                                                                          888

                                                                 571

              Q1                                        Q2                                           Q3                Q4
                                                                              2019      2020

EBITDA(1)
(€M)
                                                                                                                             372
                   317                      314                                                           330   333
        311                                                                                    311

                                                                 124

              Q1                                        Q2                                           Q3                Q4
                                                                              2019      2020

                         Note: (1) Refer to notes to the presentation in the Appendix                                 February 2, 2021   7
FY 2020 RESULTS - MARANELLO 2.2.2021 - Ferrari Corporate
FY 2020 – SHIPMENTS(2)

SHIPMENTS BY REGION(4)                                                                                             SHIPMENTS BREAKDOWN
(FY 2020 VS. FY 2019)                                               Total shipments decreased 10.0% vs. PY:        (FY 2020)

                        EMEA -1.6%                                                                                             V8
                        (53% vs. 48% PY)                            • Covid-19 pandemic impact with gradual                    76%

                                                                      production catch-up in H2 2020
AMERICAS
-19.8%                                                              • Ferrari Monza SP1 and SP2 delivered as
(25% vs. 29% PY)
                                                                      originally scheduled

                                                                    • F8 family ramp up offset 488 Pista family
                                                                      approaching end of lifecycle

                                                                    • Global distribution of 812 GTS
                                                                                                                                                      V12
                                                                    • Deliveries of SF90 Stradale and Ferrari                                         24%

                                                                      Roma started in Q4 2020

                                                                    • Ferrari Portofino phased out
                                                                                                                                                            SPORT &
                                                                    • Mainland China, Hong Kong and Taiwan                                                  SPECIAL
 REST OF APAC                    MAINLAND                             posted lower shipments due to sales                                                   SERIES
 +1.3%                           CHINA,                                                                                    GT                               74%
 (17% vs. 15% PY)                HONG KONG                            advance in 2019                                      24%

                                 AND TAIWAN
                                 -45.5%                             • Deliberate geographic allocation driven by
                                 (5% vs. 8% PY)                       phase-in pace of individual models
                                                                                                                                     ICONA
                                                                                                                                     2%

                                                               STRONG ORDER BOOK WELL BEYOND 2021

                                           Note: (2) (4) Refer to notes to the presentation in the Appendix                                  February 2, 2021         8
FY 2020 RESULTS - MARANELLO 2.2.2021 - Ferrari Corporate
NET REVENUES BRIDGE
FY 2019 – 2020
(€M)                                                                                                                                                Net revenues reported           -8.1%
                                                                                                                                                  Net revenues at constant
                                                                                                                                                               currency(9)          -8.9%

       3,766                            3,793
                        27
                                                                                                                                               3,455                                3,460
       104                               104                                                                                                                           5
                                                                (122)
                                         541                                            (47)                                                    85                                    84
       538                                                                                                     (150)
                                                                -4.1%                 -24.0%
                                                                                                                             (19)
                                                                                                             -27.8%                             391                                  390
        198                              198                                                                                -18.3%
                                                                                                                                                151                                  151

       2,926                            2,950                                                                                                  2,828                                2,835

                                                                                                (6)                                 (8)
       FY 2019   FX hedges FY 2019   FY 2019 w/o FX        Cars and spare             Engines              Sponsorship,     Other         FY 2020 at constant   Change in FX 2019   FY 2020
                                         hedges                parts (5)                                  commercial and                    currency 2019 (9)     vs. 2020 & FX
                                                                                                                    (7)
                                                                                                              brand                                              hedges FY 2020

                                          Cars and spare parts                 Engines                Sponsorship, commercial and brand         Other

•   Cars and spare parts: lower volumes and their personalizations, but more Ferrari Monza
•   Engines: lower shipments to Maserati and rental revenues from other Formula 1 racing teams
•   Sponsorship, commercial and brand: shortened Formula 1 calendar and lower in-store traffic and museum visitors
•   Other: reduced sports-related activities and Moto GP cancellation at the Mugello racetrack
•   Currency: positive impact, mainly USD

                                      Note: (5) (6) (7) (8) (9) Refer to notes to the presentation in the Appendix                                                   February 2, 2021         9
EBIT BRIDGE
FY 2019 – 2020
(€M)

                      27            944                                      130
       917                                                                                                     6

                                                                                                 (38)

                                                        (126)                                                                     705                11              716
                                                                                                                     (211)

      Margin                       Margin
      24.4%                         24.9%
                                                                                                                                 Margin                             Margin
                                                                                                                                  20.4%                              20.7%

    EBIT FY 2019   FX hedges   EBIT FY 2019 w/o       Volume              Mix / Price      Ind. Costs / R&D   SG&A   Other    EBIT FY 2020 at Change in FX 2019   EBIT FY 2020
                    FY 2019       FX hedges                                                                                  constant currency  vs. 2020 & FX
                                                                                                                                        (9)
                                                                                                                                   2019        hedges FY 2020

    EBITDA(1)                    EBITDA(1)                                                                                      EBITDA(1)                           EBITDA(1)
      1,269                        1,296                                                                                          1,132                               1,143
      33.7%                        34.2%                                                                                          32.8%                              33.0%

•    Volume: decrease in shipments
•    Mix / price: contribution of Ferrari Monza and a richer product mix despite fewer FXX-K EVO, slightly affected by personalizations
•    Industrial costs / R&D: higher D&A, net of the benefit of technology-related incentives; included full costs of employees’ paid days of
     absence during Covid-19 production suspension
•    SG&A: significant cost containment, partly offset by Formula 1 racing activities
•    Other: mainly due to reduced Formula 1 calendar, lower traffic for brand-related activities and engine sales to Maserati

                                      Note: (1) (9) Refer to notes to the presentation in the Appendix                                          February 2, 2021              10
INDUSTRIAL FCF(1) AND NET INDUSTRIAL DEBT(1) BRIDGES
DEC 31, 2019 – DEC 31, 2020
(€M)

                                                                                                                                                                                                                     (543)
                1,116
                                                                                                                                                                                                      (36)

                                   (136)                                                                               (337)            172
                                                    (99)                                                                                                                            (130)

                                                                                     172                                                                          (212)

                                                                   (709)
                 EBITDA          Change in     Cash interest &     Capex (10)   Industrial FCF                                                       (11)(12)             (12)
                                                                                            (11)(12)
               (Industrial        working          Taxes                           FY 2020                         December 31,     Industrial FCF              Dividends        FY 2020 Share   Currency, other   December 31,
             Activities only)     capital,                                                                             2019                                                       repurchases      and IFRS 16         2020
                 FY 2020        provisions &                                                                       Net Industrial                                                                                  Net Industrial
                                   other                                                                                Debt                                                                                            Debt

Change
     vs.         (135)            (312)             (53)             (3)            (503)                                               (503)                      (17)               257               24
    FY '19

•     Positive industrial free cash flow(1) generation
•     Working capital & other: reversal of the Ferrari Monza advances and higher product and raw material inventories to protect supply chain
•     Capex: long-term product development and over €60M land purchase in Maranello
•     Rewarding shareholders with €212M dividend payment and €130M share repurchases
•     Multi-year share repurchase program temporarily suspended

                                                   Note: (1) (10) (11) (12) Refer to notes to the presentation in the Appendix                                                                   February 2, 2021             11
2021 GUIDANCE

Core business sustained by
                                              (€B, unless otherwise stated)                   2019     2020        2021
volume and mix                                                                                ACTUAL   ACTUAL      GUIDANCE(13)

Revenues from Formula 1                        NET REVENUES                                   3.8      3.5          ~4.3
racing activities assuming
announced calendar and                         ADJ. EBITDA                                    1.3      1.1          1.45-1.50
                                               (margin %)                                     33.7%    33.0%        33.7%-34.9%
reflecting lower 2020
ranking                                        ADJ. EBIT                                      0.9      0.7          0.97-1.02
                                               (margin %)                                     24.4%    20.7%        22.6%-23.7%
Brand-related activities
dealing with Covid-19                          ADJ. DILUTED EPS (€)                           3.71     2.88(3)      4.00-4.20(14)
challenges
                                               INDUSTRIAL FCF                                 0.7      0.2          ~0.35
Operational and marketing
costs gradually resuming

                     Note: (3) (13) (14) Refer to notes to the presentation in the Appendix                      February 2, 2021   12
Q&A

      13
APPENDIX

           14
NOTES TO THE
PRESENTATION

1.   Reconciliations to non-GAAP financial measures are provided in the Appendix           10.   Excluding right-of-use assets recognized during the period in accordance with
2.   Excluding the XX Programme, racing cars, Fuori Serie, one-off and pre-owned cars            IFRS 16 – Leases
3.   Net of a tax benefit, with no cash impact on 2020, from the one-off partial step-up   11.   Prior to the first quarter of 2020, we defined Free Cash Flow and Free Cash Flow
     of the trademark’s book value in accordance with the Italian tax regulations                from Industrial Activities without excluding from investments in property, plant and
4.   Shipments geographical breakdown                                                            equipment the right-of-use assets recognized during the period in accordance with
     EMEA includes: Italy, UK, Germany, Switzerland, France, Middle East (includes the           IFRS 16 - Leases. Applying the current definition of Free Cash Flow and Free Cash
     United Arab Emirates, Saudi Arabia, Bahrain, Lebanon, Qatar, Oman and Kuwait)               Flow from Industrial Activities to the three and twelve months ended December 31,
     and Rest of EMEA (includes Africa and the other European markets not separately             2019 would result in an immaterial difference compared to the figures presented.
     identified);                                                                          12.   2020 presented figures include approx. €1M related to withholding taxes, which
     Americas includes: United States of America, Canada, Mexico, the Caribbean and              are expected to be paid
     Central and South America;                                                            13.   Subject to trading conditions unaffected by further Covid-19 pandemic restrictions
     Rest of APAC mainly includes: Japan, Australia, Singapore, Indonesia, South Korea,    14.   Calculated using the weighted average diluted number of common shares as of
     Thailand and Malaysia                                                                       December 31, 2020 (185,379 thousand)
5.   Includes net revenues generated from shipments of our cars, any personalization       15.   Models not included in the total shipments’ figure provided
     net revenues generated on cars, as well as sales of spare parts                       16.   Not including lease liabilities and other debt
6.   Includes net revenues generated from the sale of engines to Maserati for use in       17.   Financial leverage is calculated as the ratio between Net Debt or Net Industrial Debt
     their cars, and the revenues generated from the rental of engines to other Formula          and Adjusted EBITDA or Adjusted EBITDA (Industrial Activities only)
     1 racing teams                                                                        18.   Capitalized as intangible assets
7.   Includes net revenues earned by our Formula 1 racing team through sponsorship         19.   For the three and twelve months ended December 31, 2020 and 2019 the weighted
     agreements and our share of the Formula 1 World Championship commercial                     average number of common shares for diluted earnings per common share was
     revenues, as well as revenues generated through the Ferrari brand, including                increased to take into consideration the theoretical effect of the potential common
     merchandising, licensing and royalty income                                                 shares that would be issued under the equity incentive plans
8.   Primarily relates to financial services activities, management of the Mugello
     racetrack and other sports-related activities
9.   The constant currency presentation eliminates the effects of changes in foreign
     currency (transaction and translation) and of foreign currency hedges

                                                                                                                                                                February 2, 2021         15
STRONG TRACK-RECORD
IN NEW MODELS INTRODUCTION
RANGE MODELS INTRODUCED
Model / year of delivery   2006   2007   2008   2009   2010   2011   2012   2013   2014   2015   2016   2017   2018     2019   2020      2021

SPORT RANGE

599 GTB Fiorano

458 Italia

458 Spider

F12berlinetta

488 GTB

488 Spider

812 Superfast

F8 Tributo

SF90 Stradale

812 GTS

F8 Spider

SF90 Spider

GRAN TURISMO RANGE

612 Scaglietti

California

FF

California 30

California T

GTC4LUSSO

GTC4LUSSO T

Ferrari Portofino

Ferrari Roma

Ferrari Portofino M

                                                                                                                      February 2, 2021      16
STRONG TRACK-RECORD
IN NEW MODELS INTRODUCTION
SPECIAL AND LIMITED EDITION MODELS INTRODUCED
Model / year of delivery   2006   2007       2008       2009        2010        2011        2012   2013   2014   2015   2016   2017   2018     2019   2020      2021

SPECIAL SERIES

Superamerica

F430 Scuderia

Scuderia Spider 16M

599 GTO

SA APERTA

458 Speciale

458 Speciale A

F12tdf

488 Pista

488 Pista Spider

ICONA

Ferrari Monza SP1

Ferrari Monza SP2

HYPERCAR

LaFerrari

LaFerrari Aperta

TRACK CAR

FXX-K(15)

FXX-K EVO(15)

488 GT Modificata(15)

FUORISERIE

F60 America(15)

J50(15)

                                  Note: (15) Refer to notes to the presentation in the Appendix                                              February 2, 2021          17
GROUP SHIPMENTS
BY REGION(2)(4)

                                                                                                    10,131
                                          2,679
                                                                                                     1,500           9,119
            2,376                          406
                                                                                                      836            1,520
             363                           275
             60                                                                                                       456

                                                                                                     2,900
             605                           690                                                                       2,325

            1,348                        1,308                                                       4,895           4,818

           Q4 2019                     Q4 2020                                                     FY 2019         FY 2020

                   EMEA                  Americas                   Mainland China, Hong Kong and Taiwan     Rest of APAC

                   Note: (2) (4) Refer to notes to the presentation in the Appendix                                          February 2, 2021   18
DEBT AND LIQUIDITY POSITION

NET INDUSTRIAL DEBT                                                                                           NET INDUSTRIAL DEBT
(€M)                                                                                                          (€M)

                                                                           At Dec. 31

                                                         2020           2019         2018      2017                                                                                  (543)
Debt                                                     (2,725)        (2,090)     (1,927)    (1,806)
                                                                                                                          (1,363)
Cash and Cash Equivalents (A)                            1,362           898         794        648
                                                                                                                                                (820)
Net Debt                                                 (1,363)        (1,192)     (1,133)    (1,158)
Net Debt of Financial Services Activities                (820)           (855)       (763)     (650)
Net Industrial Debt                                      (543)          (337)        (370)     (508)
                                                                                                                      December 31, 2020   December 31, 2020                  December 31, 2020
Undrawn Committed Credit Lines (B)                        700            350         500        500                       Net Debt        Net Debt of Financial              Net Industrial Debt
                                                                                                                                           Services Activities
Total Available Liquidity (A+B)                          2,062          1,248        1,294     1,148

GROSS DEBT MATURITY PROFILE(16)                                                                               CASH AND MARKETABLE SECURITIES
(€M and Cash Maturities)                                                                                      (€M)

                                                                                                                                                                        At Dec. 31
    835
                                                                                                                                                  2020            2019          2018          2017
       29
                                                                675                                           Euro                                1,203           690            616           435
       306                         550                             25
                                                                                                              US Dollar                            76              63                50        88
                                   165                                                                        Chinese Yuan                         51             110                73        62
                                                                 650
                   200                                                                                        Japanese Yen                         13              12                24        26
       500
                                   385
                                                                                  150         150
                                                66                                                            Other Currencies                     19              23                31        37

                                                                                                              Total (€ equivalent)                1,362           898            794           648
   2021            2022            2023        2024             2025              2029        2031
             Bond / Notes (USPP)    US Securitizations     Other Financial Liabilities

                                               Note: (16) Refer to notes to the presentation in the Appendix
                                               Certain totals in the tables included in this document may not add due to rounding                                       February 2, 2021             19
FINANCIAL LEVERAGE(17)
HISTORICAL TREND

                                                Total available liquidity at €2,062M as of December 31, 2020 (€1,879M as of
                                                September 30, 2020), including undrawn committed credit lines of €700M

Net Debt / Adj. EBITDA(1)                                                                       Net Industrial Debt(1) / Adj. EBITDA(1) (Industrial Activities only)

    1.6x

                                                                   1.2x
                1.1x
                            1.0x
                                               0.9x
                                                                                                     0.8x

                                                                                                                 0.5x                                   0.5x
                                                                                                                              0.3x         0.3x

    2016        2017        2018               2019                2020                             2016         2017         2018         2019         2020

                            Note: (1) (17) Refer to notes to the presentation in the Appendix                                                February 2, 2021      20
CAPEX AND R&D

   Q4 '20       Q4 '19                                   €M, unless otherwise stated                 FY '20           FY '19

    244           253                                       Capital expenditures (10)                 709              706

    98            102                        of which capitalized development costs(18) (A)           320              330

                                                         Research and development
    154           136                                                                                 527              559
                                                             costs expensed (B)

    252           238                             Total research and development (A+B)                847              889

                                                          Amortization of capitalized
    48            46                                                                                  180              140
                                                           development costs (C)

                                           Research and development costs as recognized
    202           182                                                                                 707              699
                                             in the consolidated income statement (B+C)

                Note: (10) (18) Refer to notes to the presentation in the Appendix
                Certain totals in the tables included in this document may not add due to rounding            February 2, 2021   21
NON-GAAP FINANCIAL
MEASURES

Operations are monitored through the use of various non-GAAP financial measures              operational activities.

that may not be comparable to other similarly titled measures of other companies.        •   Adjusted Earnings Before Interest and Taxes (“Adjusted EBIT”) represents EBIT as

Accordingly, investors and analysts should exercise appropriate caution in                   adjusted for certain income and costs which are significant in nature, expected to

comparing these supplemental financial measures to similarly titled financial                occur infrequently, and that management considers not reflective of ongoing

measures reported by other companies.                                                        operational activities.

We believe that these supplemental financial measures provide comparable                 •   Adjusted net profit represents net profit as adjusted for certain income and costs

measures of our financial performance which then facilitate management’s ability to          (net of tax effect) which are significant in nature, expected to occur infrequently,

identify operational trends, as well as make decisions regarding future spending,            and that management considers not reflective of ongoing operational activities.

resource allocations and other operational decisions.                                    •   Adjusted earnings per share diluted represents earnings per share as adjusted for

Reconciliations are only provided to the most directly comparable IFRS financial             certain income and costs (net of tax effect) which are significant in nature,

statement line item for Adjusted EBITDA, Adjusted EBIT and Adjusted EPS diluted for          expected to occur infrequently, and that management considers not reflective of

historical periods, as the income or expense excluded from these non-GAAP financial          ongoing operational activities.

measures in accordance with our policy are, by definition, not predictable and           •   Net Industrial Debt is defined as total Debt less Cash and cash equivalents (Net

uncertain.                                                                                   Debt), further adjusted to exclude the debt and cash and cash equivalents related

                                                                                             to our financial services activities (Net Debt of Financial Services Activities).

NON-GAAP FINANCIAL MEASURES                                                              •   Free Cash Flow is defined as cash flows from operating activities less investments

•   Total Net Revenues, EBITDA, adj. EBITDA, EBIT and adj. EBIT at constant currency         in property, plant and equipment (excluding right-of-use assets recognized during

    eliminate the effects of changes in foreign currency (transaction and translation)       the period in accordance with IFRS 16 - Leases) and intangible assets. Free Cash

    and of foreign currency hedges.                                                          Flow from Industrial Activities is defined as Free Cash Flow adjusted to exclude the

•   EBITDA is defined as net profit before income tax expense, net financial expenses        operating cash flow from our financial services activities (Free Cash Flow from

    and depreciation and amortization. Adjusted EBITDA is defined as EBITDA as               Financial Services Activities).

    adjusted for certain income and costs which are significant in nature, expected to

    occur infrequently, and that management considers not reflective of ongoing

                                                                                                                                                              February 2, 2021      22
KEY PERFORMANCE METRICS AND
RECONCILIATIONS OF NON-GAAP MEASURES

   Q4 '20     Q4 '19                                   €M, unless otherwise stated                 FY '20           FY '19

    1,069       927                                              Net revenues                      3,460             3,766

    372         333                                     EBITDA / Adjusted EBITDA                   1,143             1,269

    364         328                          of which EBITDA (Industrial Activities only)          1,116             1,251

    121         114                                  Amortization and depreciation                  427              352

    251         219                                         EBIT / Adjusted EBIT                    716              917

     11         10                                        Net financial expenses                    49                42

    240        209                                           Profit before taxes                    667              875

    (23)        43                                          Income tax expense                      58               176

    n.m.       21%                                            Effective tax rate                    9%               20%

    263         166                                                Net profit                       609              699

    (75)          -                                              Adjustments                        (75)               -

    188         166                                         Adjusted net profit(3)                  534              699

    1.42       0.90                                              Basic EPS (€)                      3.29             3.73

    1.41       0.90                                             Diluted EPS (€)                     3.28             3.71

    1.01       0.90                                      Adjusted basic EPS (€)(3)                  2.88             3.73

    1.01       0.90                                     Adjusted diluted EPS (€)(3)                 2.88             3.71

              Note: (3) Refer to notes to the presentation in the Appendix
              Certain totals in the tables included in this document may not add due to rounding            February 2, 2021   23
RECONCILIATIONS OF NON-GAAP MEASURES:
TOTAL NET REVENUES AT CONSTANT CURRENCY(9)

             Q4 '20 at constant                                                                                    FY '20 at constant
    Q4 '20                                                  €M, unless otherwise stated                 FY '20
                  currency                                                                                              currency

     870             871                                         Cars and spare parts                   2,835             2,828

      54             54                                                  Engines                         151              151

     125             126                               Sponsorship, commercial and brand                 390              391

      20              21                                                   Other                         84                85

    1,069           1,072                                          Total net revenues                   3,460             3,455

                   Note: (9) Refer to notes to the presentation in the Appendix
                   Certain totals in the tables included in this document may not add due to rounding            February 2, 2021       24
RECONCILIATIONS OF NON-GAAP MEASURES:
ADJUSTED NET PROFIT(3)

   Q4 '20     Q4 '19                                    €M, unless otherwise stated                 FY '20           FY '19

    263          166                                                Net profit                       609              699

    (75)           -                                              Adjustments                        (75)              -

    188          166                                         Adjusted net profit(3)                  534              699

               Note: (3) Refer to notes to the presentation in the Appendix
               Certain totals in the tables included in this document may not add due to rounding            February 2, 2021   25
BASIC AND DILUTED EPS

    Q4 '20     Q4 '19                                         € per common share              FY '20            FY '19

     262         167                       Net profit attributable to owners of the Company    608               696

                                                         Weighted average number
    184,748    185,492                                                                        184,806           186,767
                                                      of common shares (thousand)(19)

     1.42       0.90                                               Basic EPS (€)               3.29              3.73

                                           Weighted average number of common shares for
    185,322    186,260                                                                        185,379           187,535
                                           diluted earnings per common share (thousand)(19)

     1.41       0.90                                              Diluted EPS (€)              3.28              3.71

               Note: (19) Refer to notes to the presentation in the Appendix                            February 2, 2021   26
RECONCILIATIONS OF NON-GAAP MEASURES:
ADJUSTED EPS(3)

   Q4 '20     Q4 '19                                         € per common share                     FY '20           FY '19

    1.42        0.90                                                Basic EPS                        3.29             3.73

    (0.40)         -                                              Adjustments                       (0.40)             -

    1.01        0.90                                         Adjusted basic EPS(3)                   2.88             3.73

    1.41        0.90                                               Diluted EPS                       3.28             3.71

    (0.40)         -                                              Adjustments                       (0.40)             -

    1.01        0.90                                        Adjusted diluted EPS(3)                  2.88             3.71

               Note: (3) Refer to notes to the presentation in the Appendix
               Certain totals in the tables included in this document may not add due to rounding            February 2, 2021   27
RECONCILIATIONS OF NON-GAAP MEASURES:
FREE CASH FLOW AND FREE CASH FLOW FROM INDUSTRIAL ACTIVITIES

    Q4 '20     Q4 '19                                   €M, unless otherwise stated                 FY '20           FY '19

     411         357                                Cash flow from operating activities              839              1,306

                                             Investments in property, plant and equipment
     (244)      (253)                                                                               (709)             (706)
                                                       and intangible assets(11)

     167         104                                             Free Cash Flow                      130              600

     (13)        (12)                      Free Cash Flow from Financial Services Activities         (42)             (75)

     180         116                           Free Cash Flow from Industrial Activities(12)         172              675

               Note: (11) (12) Refer to notes to the presentation in the Appendix
               Certain totals in the tables included in this document may not add due to rounding            February 2, 2021   28
RECONCILIATIONS OF NON-GAAP MEASURES:
NET INDUSTRIAL DEBT

           €M, unless otherwise stated                    December 31, 2020              December 31, 2019             December 31, 2018   December 31, 2017   December 31, 2016

Debt                                                                (2,725)                       (2,090)                     (1,927)           (1,806)             (1.848)

of which: Lease liabilities as per IFRS 16
                                                                       62                            60                          -                 -                   -
(simplified approach)

Cash and Cash Equivalents                                            1,362                          898                        794               648                  458

Net Debt (A)                                                        (1,363)                        (1,192)                    (1,133)           (1,158)             (1,390)

Net Debt of Financial Services Activities                            (820)                          (855)                     (763)              (650)               (700)

Net Industrial Debt (B)                                              (543)                          (337)                     (370)              (508)               (690)

EBITDA / Adj. EBITDA (C)                                             1,143                         1,269                      1,114              1,036               880

EBITDA / Adj. EBITDA (Industrial Activities only) (D)                1,116                         1,251                      1,098              1,020                854

Financial Leverage(17) on Net Industrial Debt (B/D)                   0.5x                          0.3x                       0.3x              0.5x                0.8x

Financial Leverage(17) on Net Debt (A/C)                              1.2x                          0.9x                       1.0x              1.1x                1.6x

                                         Note: (17) Refer to notes to the presentation in the Appendix
                                         Certain totals in the tables included in this document may not add due to rounding                               February 2, 2021    29
You can also read