H1 2018 Interim Results - Christopher Delbrück - CFO 07 August 2018 - Uniper Energy

Page created by Harry Ward
 
CONTINUE READING
H1 2018 Interim Results - Christopher Delbrück - CFO 07 August 2018 - Uniper Energy
H1 2018
Interim Results
Christopher Delbrück – CFO

07 August 2018
H1 2018 Interim Results - Christopher Delbrück - CFO 07 August 2018 - Uniper Energy
Agenda

1. H1 2018 – Highlights

2. H1 2018 – Financial results

3. Appendix
H1 2018 Interim Results - Christopher Delbrück - CFO 07 August 2018 - Uniper Energy
Essentials of H1 2018

              Fortum new major shareholder
Shareholder
              Markus Rauramo to join the Supervisory Board

              Robust tailwind from commodity markets
 Market &
              Uniper actively accompanying coal exit plans in Europe
 Strategy
              Strategy implementation taking form

              Solid H1 Adjusted EBIT at €601m – expected decrease due to lapse of one-off
 Earnings     effects
              Adjusted FFO down 13% to €589m – on track for full year target

              Outlook for FY 2018 confirmed with Adjusted EBIT of €0.8bn to €1.1bn
 Outlook &    Dividend proposal for fiscal year 2018 of €310m and ambition of CAGR 25%
 Dividend     p.a. until 2020 confirmed

                                                        Uniper SE, Presentation H1 2018, 07 Aug 2018   3
H1 2018 Interim Results - Christopher Delbrück - CFO 07 August 2018 - Uniper Energy
Commodity markets – Manifestation of positive
trend
CO2 prices and coal forwards                                Baseload forwards                       Uniper Nordic outright hedges
EUR/t                                  USD/MT EUR/MWh                                               EUR/MWh
20                                         100        45                                             45
                                                      40                                             40   Achieved price                       Hedge ratio
16                                         80
                                                                                                                                  >70%
                                                      35                                              35
12                                         60
                                                      30                                              30                                  >40%
 8                                         40
                                                      25                                              25
 4                                         20         20                                              20
               CO2           Coal (rhs)                              Germany           Nordic
H1 2018 Interim Results - Christopher Delbrück - CFO 07 August 2018 - Uniper Energy
Uniper actively accompanying coal exit plans in
Europe
Germany                                                 France                                          Netherlands
 578 TWh                                                  527 TWh                                           112 TWh

                                       Uniper                                           Uniper                                                    Uniper
                                       21 TWh                                           8 TWh                                                     10 TWh

             Generation mix:               Nuclear           Lignite   Hard coal      Gas          Renewables

Commission just established                             Coal exit immediately ahead                      Coal exit by end of 2029
 One target is to reduce emissions in                   French plans to close all coal-fired            New draft of energy law sets legal
  socially acceptable way                                 power station by the end of 2021 still           framework for closure of all coal-
 Comprehensive view needed to                            not confirmed                                    fired power stations
  reconcile all topics                                   Uncertainties for coal generators and           Maasvlakte 3 power plant would
 Uniper favors concepts with a holistic                  their employees                                  operate until the end of 2029
  approach – e.g. reissue of a safety                    Coal exit plans biting into Uniper’s            Consensual exit expected, other-
  reserve                                                 business case for the French market              wise Uniper needs to defend its
                                                                                                           position legally

              Source: Uniper, Eurostat, Destatis (figures for 2017)                                Uniper SE, Presentation H1 2018, 07 Aug 2018            5
H1 2018 Interim Results - Christopher Delbrück - CFO 07 August 2018 - Uniper Energy
Update from the business

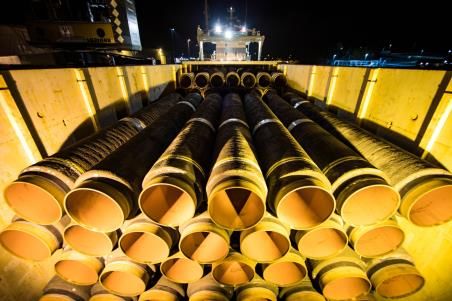
Large asset project –                                 Growth opportunity –                           Growth opportunity –
Nord Stream 2                                         Industrial Solutions                           Russia modernization
                                                                                                      Auction years               Commisioning years

                                                                                                           2018         11 GW           2022-2024

                                                                                                           2019         4 GW               2025

                                                                                                           2020         4 GW               2026
                                                                                                                           …
                                                                                                           2025         4 GW               2031

Project progressing                                   New flagship project signed                     Unipro considers to participate
 Official permissions received from                   Existing site Scholven being                   Draft legislation for modernization
  Germany, Russia, Finland and                          developed to serve industrial cluster           of aging thermal power plants
  Sweden                                                in the Ruhr Area                                published
 Permits from Denmark still pending                   Industrial Solutions entity setup to           39 GW to be tendered via auctions
 Mix of political headwinds and                        market projects supplying process               between 2018 and 2025
  tailwinds continue                                    steam and heat                                 Unipro with pipeline of units eligible
 Works for pipelaying in the Baltic Sea               New long-term contract signed with              for auctions
  started in July                                       basic chemicals company
                                                       Further growth potential onsite

              Source: Nord Stream 2 public photo stock, Uniper                                  Uniper SE, Presentation H1 2018, 07 Aug 2018        6
Agenda

1. H1 2018 – Highlights

2. H1 2018 – Financial results

3. Appendix
Key financials H1 2018

Adj. EBIT(DA)                           Operating cash flow, adj. FFO                 Economic net debt
€bn                                     €bn                                            €bn
         1.3

                          0.9

                                           1.4                                                                           3.3
         0.9                                                                                        2.4
                           0.6                                 0.7        0.6
                                                     0.5

       H1 2017          H1 2018          OCF        OCF      Adj. FFO Adj. FFO                   YE 2017              H1 2018
               EBIT   EBITDA            H1 2017    H1 2018   H1 2017 H1 2018

Adj. EBIT(DA) down                      Op. cash flow significantly down               Net debt significantly up
 Driven by structural effects           Down because of lack of support               Due to low operating cash flow,
 Partly compensated by regulatory        from the working capital side                  margining requirements and
  effects, cost cutting and LNG proxy     compared to H1 2017 level                      IFRS 16 effect
  hedging result
                                        Adj. FFO slightly down
                                         Following EBIT(DA) trend but
                                          mitigated by positive tax effects

                                                                                 Uniper SE, Presentation H1 2018, 07 Aug 2018   8
Adjusted EBIT – H1 2018 earnings reduction
largely due to structural effects
Reconciliation Adj. EBIT H1 2017 to Adj. EBIT H1 2018
 €bn
             Adj. EBIT H1 2017                  0.9

          Structural effects (YR,
         lapse of Berezovskaya
       insurance payments, FX)
         Regulation (Nordic tax,
           capacity markets)

                   Price outright

              Gas optimization
            (incl. phasing effect)

            LNG proxy hedging

                     Cost cutting

                           Other

             Adj. EBIT H1 2018            0.6

                                                        Uniper SE, Presentation H1 2018, 07 Aug 2018   9
Adj. EBIT(DA) to OCF – lower cash conversion
due to working capital smoothing
Reconciliation Adj. EBIT H1 2018 to operating cash flow H1 2018
 €m
                                    116

                339

                                                                                                            23
                          940                 -548
                                                          -57        -3                      -6
   601
                                                                               448                                        465

 Adj. EBIT    Depreci- Adj. EBITDA Non-cash Provision Changes in Payments     OCFbIT        Interest          Tax         OCF
 H1 2018      ation and   H1 2018  effective utilization working related to   H1 2018      payments         refunds      H1 2018
             amortization          EBITDA                capital non-oper.
                                    items                        earnings,
                                                                   others

                                                                               Uniper SE, Presentation H1 2018, 07 Aug 2018        10
Economic net debt increased due to IFRS 16
and margining requirements
Economic net debt
 €bn
                                                                                                                                                3.3
                                                                                                                               0.3
                                                                                                              0.4

                                                                                              0.3                                               0.9
           2.4
                                                                             0.3

                          -0.1                              0.2
           1.0                                                                                                                                  0.8
                                           -0.5

           0.7

                                                                                                                                                1.6

           0.8

       Economic net Divestments            OCF            Capex           Dividend         IFRS 16        Margining          Other       Economic net
       debt YE 2017                                                       payment                                                        debt H1 2018

                                                      AROs1          Pension2         Net financial position3

             1. Includes nuclear and other asset retirement obligations (AROs) as well as receivables from Swedish nuclear waste fund (KAF).
             2. Change in interest for pension obligations by -0.2% in Germany.
             3. Includes cash & cash equivalents, non-current securities, financial receivables from
                consolidated group companies and financial liabilities.                                     Uniper SE, Presentation H1 2018, 07 Aug 2018   11
2018 Outlook reiterated – Further dividend
growth ahead
Adj. EBIT                         Dividend                      Key highlights                                       TBU
€bn                               €bn
                                                                European Generation
      1.1             1.1                           0.31
                                        0.27                     Increasing contribution from UK and French
                  Range                                           capacity payments
                      0.8                                        Final reduction of Swedish nuclear capacity tax
                                                                  and further reduction of hydro property tax
                            0.9                                  Lower achieved outright prices
                                                                 One-off net provision release (new)

                                                                Global Commodities
      2017        2018E             FY2017        FY2018E
                                                                 Improved earnings in power, coal and LNG
                                                                 Lapse of Yuzhno-Russkoye gas upstream
Adjusted EBIT contribution by segment                             earnings
                                                                 Cost savings
Segments                            EBIT 2018E vs 2017
                                                                International Power
European Generation                 Significantly above (new)    Lapse of insurance payments for
                                                                  Berezovskaya 3 power plant

Global Commodities                  Significantly above

International Power                 Significantly below

                                                                      Uniper SE, Presentation H1 2018, 07 Aug 2018         12
Agenda

1. H1 2018 – Highlights

2. H1 2018 – Financial results

3. Appendix
Outright power hedging in Germany and Nordic

Outright position – baseload power price

              >80%                            >75%               >15%

    €/MWh              >85%                          >70%                   >40%

      35

      30

      25

      20

                                                                                 Status: June 2018
      15
                     2018                            2019                      2020

                     Achieved price Germany                 Hedge ratio Germany

                     Achieved price Nordic                  Hedge ratio Nordic

                                                               Uniper SE, Presentation H1 2018, 07 Aug 2018   14
Group EBIT(DA) – Modest earnings
development in H1 2018
Adj. EBIT development by segment in H1 2018                                               Highlights
 €m                                                                                       European Generation
                      88                                                                   (-) Lower outright prices and spreads
                                                                                           (-) Closure of Maasvlakte 1 + 2 and
                                     -76                                                        Oskarshamn 1
        930                                        -335          -6                        (+) Swedish tax relief on hydro and
                                                                             601                nuclear
                                                                                           (+) Capacity market UK and France
  H1 2017       European           Global    International   Admin./Cons.   H1 2018        (+) Positive volume effect hydro
                Generation       Commodities    Power
                                                                                           (+) One-off net provision release
Adj. EBIT(DA) in H1 2018
                                                                                          Global Commodities
                                                          EBITDA                EBIT       (-) Deconsolidation Yuzhno-Russkoye
€m
                                                          H1 2018            H1 2018
                                                                                           (-) Yuzhno-Russkoye hedge result
European Generation                                           604                  372     (+) LNG proxy hedging result
Global Commodities                                            240                  186
                                                                                          International Power
International Power                                           189                  142     (-) Lapse of insurance payment for
Administration / Consolidation                                 -93                 -99          Berezovskaya 3

Total                                                         940                  601

                                                                                         Uniper SE, Presentation H1 2018, 07 Aug 2018   15
European Generation – Positive regulation and
volume effects
Adj. EBIT development by sub-segment in H1 2018                            Main effects
 €m                                                                        Hydro
                                                                            (+) Positive volume effect
                            24                     8                        (+) Reduced hydro property tax
                    87
                                     -30                                    (+) net provision one-off
                                                              372           (-) Lower achieved prices
      284
                                                                           Nuclear
  H1 2017         Hydro   Nuclear   Fossil     Admin/Cons.   H1 2018        (+) Nuclear capacity tax abolished
                                                                            (-) Lower achieved prices
Adj. EBIT(DA) in H1 2018                                                    (-) Closure of Swedish nuclear power
                                                                                 plant Oskarshamn 1 in June 2017
                                             EBITDA              EBIT
€m
                                             H1 2018          H1 2018      Fossil
Hydro                                           273              228        (-) Closure of Dutch coal plants
                                                                                 Maasvlakte 1 + 2 in June 2017
Nuclear                                          99                 69

Fossil                                          251                 96

Other / Consolidation                            -19                -21

Total                                           604              372

                                                                          Uniper SE, Presentation H1 2018, 07 Aug 2018   16
Global Commodities – Lower gas optimization
result
Adj. EBIT development by sub-segment in H1 2018                Main effects                                  TBU
 €m                                                            Gas
                                                                (-) Settlement of Yuzhno-Russkoye
               -33             34          12                        hedging result in Gas
                                                                (+) Improvement of Gas optimization
         262                                                         result in isolated Q2
                       -89
                                                   186
                                                                (-) Lapse of renegotiation result with
                                                                     Gazprom
   H1 2017     Gas     YR     COFL       Power    H1 2018      Yuzhno-Russkoye (YR)
                                                                (-) Deconsolidation of Yuzhno-
Adj. EBIT(DA) in H1 2018                                             Russkoye

 €m
                                     EBITDA          EBIT      COFL
                                     H1 2018      H1 2018
                                                                (+) LNG with positive hedging result
 Gas                                    179           144           of US gas volumes
 YR                                       -1             -1
                                                               Power
 COFL                                    62              49     (+) Stronger power optimization and
 Power                                    1              -5          trading result

 Total                                  240           186

                                                              Uniper SE, Presentation H1 2018, 07 Aug 2018         17
International Power – Lapse of insurance
payment
Adj. EBIT development by sub-segment in H1 2018                  Main effects                                  TBU
 €m                                                              Russia
                                                                  (-) Lapse of Berezovskaya insurance
                                                                       payment
                                                                  (+) Increase of capacity payments
          477                     3                                    thanks to effects of CSA uplift
                                                                  (-) Decreased electricity revenues
                     -339                         142                  due to lower generation volumes
         H1 2017    Russia      Brazil          H1 2018           (-) Negative FX effects

Adj. EBIT(DA) in H1 2018

                                      EBITDA          EBIT
€m
                                      H1 2018      H1 2018
Russia                                   190              142

Brazil                                     0               0

Total                                    189              142

                                                                Uniper SE, Presentation H1 2018, 07 Aug 2018         18
Uniper Group – Adjusted EBIT(DA) by segment

Adj. EBITDA

€m                               H1 2018                H1 2017                    %

European Generation                   604                     507               19.1

Global Commodities                    240                     310               -22.5

International Power                   189                     526               -64.0

Administration / Consolidation         -93                    -90                -3.3

Total                                 940                   1,253               -24.9

Adj. EBIT
€m                               H1 2018                H1 2017                    %

European Generation                   372                     284               31.0

Global Commodities                    186                     262               -29.0

International Power                   142                     477               -70.2

Administration / Consolidation         -99                    -93                -6.5

Total                                 601                     930               -35.4

                                 Uniper SE, Presentation H1 2018, 07 Aug 2018      19
Uniper Group – Adjusted EBIT(DA) by
sub-segment
Adj. EBITDA and EBIT

                                                       H1 2018        H1 2017              H1 2018                   H1 2017
€m
                                                  Adj. EBITDA    Adj. EBITDA              Adj. EBIT                 Adj. EBIT

European Generation              Hydro                    273            169                      228                    141

                                 Nuclear                   99              77                      69                     45

                                 Fossil                   251            288                       96                    125

                                 Other/ Consol.           -19             -27                     -21                     -28

                                 Subtotal                 604            507                      372                    284
Global Commodities               Gas                      179            201                      144                    176
                                 YR                         -1           101                        -1                    87
                                 COFL                      62              21                      49                     16
                                 Power                      1             -13                       -5                    -17
                                 Subtotal                 240            310                      186                    262
International Power              Russia                   190            529                      142                    481
                                 Brazil                     0              -3                       0                      -5
                                 Subtotal                 189            526                      142                    477
Administration / Consolidation                            -95             -90                     -99                     -93

Total                                                     940          1,253                      601                    930

                                                                     Uniper SE, Presentation H1 2018, 07 Aug 2018          20
Uniper Group – Key P&L items at a glance

Key P&L items

€m                                                                                                                           H1 2018                   H1 2017

Sales                                                                                                                          35,968                   37,305
Adjusted EBITDA                                                                                                                   940                    1,253
Economic depreciation and amortization / reversals                                                                               -339                     -323
Adjusted EBIT                                                                                                                     601                     930
Non-operating adjustments                                                                                                       1.344                     -381
EBIT                                                                                                                              -743                   1.311

Net interest income / expense1                                                                                                    -25                       -9
Other financial result1                                                                                                            15                       25
Income taxes                                                                                                                      231                     -270
Net income / loss after income taxes                                                                                              -522                   1.057

Attributable to the shareholders of Uniper SE                                                                                     -546                    967
Attributable to non-controlling interests                                                                                           24                     90

                 1. Result from Swedish Nuclear Waste Fund (KAF) in the amount of €+22m is moved
                    from Economic interest expenses to “Other financial result”, this also is applied
                    retrospectively for 2017 (H1 2017: €+25m).                                          Uniper SE, Presentation H1 2018, 07 Aug 2018        21
1,362
Uniper Group – Adjusted EBITDA to net income

Reconciliation Adj. EBITDA H1 2018 to net income H1 2018
 €m

      940         - 339
                                      601                - 165

                                                                                                                                          -546
                                                                                                                          371

                                                                      -1,057
                                                                                      -270              -26

   Adj.           D&A                Adj.            Economic          MTM             Net             Other          Taxes on              Net
  EBITDA                             EBIT         interest, taxes,   Derivatives   impairments                          non-             Income 1
                                                     minorities                                                       operating
                                                                                                                      earnings,
                                                                                                                      minorities
                                        Underlying earnings2                   Non-operating results

            1.   Net income attributable to Uniper shareholders.
            2.   Includes non-controlling interests                                              Uniper SE, Presentation H1 2018, 07 Aug 2018       22
Uniper Group – Economic interest expense (net)

Economic interest expense of the Uniper Group
€m                                                                                                                                      H1 2018                      H1 2017

Interest from financial assets / liabilities                                                                                                     5                        -9

Interest cost from provisions for pensions and similar provisions                                                                               -9                       -10

Accretion of provisions for retirement and obligation and other provisions                                                                     -43                       -37

Construction period interests1                                                                                                                  16                       20

Other2, 3                                                                                                                                       15                       23

Economic interest expense (net)                                                                                                                -16                       -13

                 1. Borrowing costs that are directly attributable to the acquisition, construction or production of a qualifying asset are capitalized as
                    part of the cost of the asset; borrowing cost are interest costs incurred by an entity in connection with the borrowing of funds.
                 2. Includes e.g. interest due to tax provisions/receivables and adjustments due to changes in interest rates on provisions.
                 3. Result from Swedish Nuclear Waste Fund (KAF) in the amount of €+22m is moved from Economic interest expenses
                    to “Other financial result”. This also is applied retrospectively for 2017 (H1 2017: €+25m).      Uniper SE, Presentation H1 2018, 07 Aug 2018        23
Uniper Group – Non-operating adjustments

Non-operating adjustments

€m                                                                               H1 2018                    H1 2017

Net book gains / losses                                                                 31                        -

Fair value measurement of derivative financial instruments                           1.057                     -446

Restructuring / cost management expenses                                               -55                      13

Non-operating impairment charges / reversals                                           270                      34

Miscellaneous other non-operating earnings                                              41                      18

Non-operating adjustments                                                            1.344                     -381

                                                             Uniper SE, Presentation H1 2018, 07 Aug 2018        24
Uniper Group – Cash effective investments

Investments by segment

€m                                          H1 2018                H1 2017                    %

European Generation                              136                     188               -27,6

Global Commodities                                 11                     13               -15,3

International Power                                83                     66               25,7

Administration / Consolidation                     14                     27               -48,1

Total                                            244                     294               -17,0

Investment split – maintenance and growth
€m                                          H1 2018                H1 2017                    %

Maintenance & replacement                          90                    102               -11,7

Growth                                           154                     192               -19,7

Total                                            244                     294               -17,0

                                            Uniper SE, Presentation H1 2018, 07 Aug 2018      25
Uniper Group – Net financial position

Net financial position of the Uniper Group
€m                                                                30 Jun 2018               31 Dec 2017

Liquid funds                                                                862                   1,027

Non-current securities                                                       92                    104

Financial liabilities                                                    -2,556                  -1,923

Net financial position                                                   -1,602                    -792

Provisions for pensions and similar obligations                            -753                    -676

Asset retirement obligations                                               -939                    -977

Economic net debt                                                        -3,294                  -2,445

                                                  Uniper SE, Presentation H1 2018, 07 Aug 2018       26
Uniper Group – Consolidated balance sheet (1/2)

Balance sheet of the Uniper Group – assets
€m                                                                 30 Jun 2018               31 Dec 2017
Goodwill                                                                  1,861                    1,890
Intangible assets                                                           803                      819
Property, plant and equipment                                            11,092                   11,496
Companies accounted for under the equity method                             448                      448
Other financial assets                                                      760                      814
      Equity investments                                                    668                      710
      Non-current securities                                                 92                      104
Financial receivables and other financial assets                          3,384                    3,308
Operating receivables and other operating assets                          6,422                    3,206
Income tax assets                                                             6                        6
Deferred tax assets                                                       1,184                      890
Non-current assets                                                       25,960                   22,877

Inventories                                                               1,669                    1,659
Financial receivables and other financial assets                          1,592                    1,195
Trade receivables and other operating assets                             18,115                   16,163
Income tax assets                                                           107                      170
Liquid funds                                                                862                    1,027
Assets held for sale                                                          -                       70
Current assets                                                           22,345                   20,284

Total assets                                                             48,305                   43,161

                                                   Uniper SE, Presentation H1 2018, 07 Aug 2018       27
Uniper Group – Consolidated balance sheet (2/2)

Balance sheet of the Uniper Group – equity and liabilities
€m                                                                           30 Jun 2018               31 Dec 2017
Capital stock                                                                         622                      622
Additional paid-in capital                                                         10,825                   10,825
Retained earnings                                                                   2,925                    3,399
Accumulated other comprehensive income                                             -3,346                   -2,699
Equity attributable to the shareholders of Uniper SE                               11,026                   12,147
Attributable to non-controlling interest                                              619                      642
Equity (net assets)                                                                11,645                   12,789

Financial liabilities                                                               1,176                      961
Operating liabilities                                                               7,230                    3,618
Provisions for pensions and similar obligations                                       753                      676
Miscellaneous provisions                                                            5,615                    6,068
Deferred tax liabilities                                                              386                      390
Non-current liabilities                                                            15,160                   11,713
Financial liabilities                                                               1,380                      962
Trade payables and other operating liabilities                                     18,913                   16,277
Income taxes                                                                           12                       55
Miscellaneous provisions                                                            1,195                    1,362
Liabilities associated with assets held for sale                                        -                        3
Current liabilities                                                                21,500                   18,659

Total equity and liabilities                                                       48,305                   43,161

                                                             Uniper SE, Presentation H1 2018, 07 Aug 2018       28
Uniper Group –
Consolidated statement of cash flows
Statement of cash flows of the Uniper Group
€m                                                                                                          H1 2018                    H1 2017
Net income / loss                                                                                                -522                    1,057
Depreciation, amortization and impairment of intangibles / property, plant, equipment                             616                      369
Changes in provisions                                                                                            -433                     -323
Changes in deferred taxes                                                                                        -232                       73
Other non-cash income and expenses                                                                                 63                      -18
Gain / loss on disposals                                                                                          -50                        4
Changes in operating assets and liabilities and in income tax                                                   1,023                      245
Cash provided (used for) by operating activities                                                                  465                    1,407
Proceeds from disposals                                                                                           125                       12
Payments for investments                                                                                         -244                     -294
Payments in context of divestments                                                                                  -                      -66
Proceeds from disposals of securities (>3M) and of financial receivables                                          362                      650
Purchases of securities (>3M) and of financial receivables                                                     -1,166                     -524
Changes in restricted cash and cash equivalents                                                                    15                      -42
Cash provided (used for) by investing activities                                                                 -908                     -264
Payments received / made from changes in capital                                                                    5                       11
Payed dividend to the shareholders of Uniper SE                                                                  -271                     -201
Proceeds from financial liabilities                                                                               375                      612
Repayment of financial liabilities                                                                                -84                     -973
Cash provided (used for) by financing activities                                                                   25                     -551
Net increase / decrease in cash and cash equivalents                                                             -418                      592
Effect from foreign exchange rates on cash and cash equivalents                                                    -5                      -21
Cash and cash equivalents at the beginning of the year                                                            852                      169
Cash and cash equivalents of deconsolidated companies                                                               -                      -62
Cash and cash equivalents at the end of the quarter                                                               429                      678

                                                                                        Uniper SE, Presentation H1 2018, 07 Aug 2018         29
Uniper – Contact your Investor Relations team

 Uniper SE                            Udo Giegerich                               Marc Koebernick
 Investor Relations                   Executive Vice President                    Head of Investor Relations (SVP)
 E.ON-Platz 1                         Group Finance & Investor Relations                            +49 211 4579 4489
 40479 Duesseldorf                          udo.giegerich@uniper.energy                  marc.koebernick@uniper.energy
 Germany

                 +49 211 4579 4400
                   ir@uniper.energy

 Carlo Beck                           Mikhail Prokhorov                           Peter Wirtz
 Manager Investor Relations           Manager Investor Relations                  Manager Investor Relations
                  +49 211 4579 4402                    +49 211 4579 4484                               +49 211 4579 4414
           carlo.beck@uniper.energy      mikhail.prokhorov@uniper.energy                        peter.wirtz@uniper.energy

                                                                           Uniper SE, Presentation H1 2018, 07 Aug 2018     30
Financial calendar & further information

Financial calendar                             Further information
13 November 2018                                  https://ir.uniper.energy
Quarterly Statement January – September 2018
12 March 2019
Annual Report 2018
07 May 2019
Quarterly Statement January – March 2019
08 August 2019
Interim Report January – June 2019
12 November 2019
Quarterly Statement January – September 2019
Disclaimer

This document and the presentation to which it relates contains information relating to Uniper SE, ("Uniper" or the "Company") that must not be relied upon for any purpose and may not be redistributed,
reproduced, published, or passed on to any other person or used in whole or in part for any other purposes. By accessing this document you agree to abide by the limitations set out in this document.
This document is being presented solely for informational purposes and should not be treated as giving investment advice. It is not, and is not intended to be, a prospectus, is not, and should not be
construed as, an offer to sell or the solicitation of an offer to buy any securities, and should not be used as the sole basis of any analysis or other evaluation and investors should not subscribe for or
purchase any shares or other securities in the Company on the basis of or in reliance on the information in this document.
Certain information in this presentation is based on management estimates. Such estimates have been made in good faith and represent the current beliefs of applicable members of management of
Uniper. Those management members believe that such estimates are founded on reasonable grounds. However, by their nature, estimates may not be correct or complete. Accordingly, no
representation or warranty (express or implied) is given that such estimates are correct or complete.
We advise you that some of the information presented herein is based on statements by third parties, and that no representation or warranty, express or implied, is made as to, and no reliance should be
placed on, the fairness, accuracy, completeness or correctness of this information or any other information or opinions contained herein, for any purpose whatsoever. Certain statements contained herein
may be statements of future expectations and other forward-looking statements that are based on the Company’s current views and assumptions and involve known and unknown risks and uncertainties
that may cause actual results, performance or events to differ materially from those expressed or implied in such statements. No one undertakes to publicly update or revise any such forward-looking
statement. Neither Uniper nor any of their respective officers, employees or affiliates nor any other person shall assume or accept any responsibility, obligation or liability whatsoever (in negligence or
otherwise) for any loss howsoever arising from any use of this presentation or the statements contained herein as to unverified third person statements, any statements of future expectations and other
forward-looking statements, or the fairness, accuracy, completeness or correctness of statements contained herein.
In giving this presentation, neither Uniper nor its respective agents undertake any obligation to provide the recipient with access to any additional information or to update this presentation or any
information or to correct any inaccuracies in any such information.
This presentation contains certain financial measures (including forward-looking measures) that are not calculated in accordance with IFRS and are therefore considered as "Non-IFRS financial
measures". The management of Uniper believes that the Non-IFRS financial measures used by Uniper, when considered in conjunction with (but not in lieu of) other measures that are computed in
accordance with IFRS, enhance an understanding of Uniper's results of operations, financial position or cash flows. A number of these Non-IFRS financial measures are also commonly used by securities
analysts, credit rating agencies and investors to evaluate and compare the periodic and future operating performance and value of Uniper and other companies with which Uniper competes. These Non-
IFRS financial measures should not be considered in isolation as a measure of Uniper's profitability or liquidity, and should be considered in addition to, rather than as a substitute for, net income and the
other income or cash flow data prepared in accordance with IFRS. In particular, there are material limitations associated with our use of Non-IFRS financial measures, including the limitations inherent in
our determination of each of the relevant adjustments. The Non-IFRS financial measures used by Uniper may differ from, and not be comparable to, similarly-titled measures used by other companies.
Certain numerical data, financial information and market data (including percentages) in this presentation have been rounded according to established commercial standards. As a result, the aggregate
amounts (sum totals or interim totals or differences or if numbers are put in relation) in this presentation may not correspond in all cases to the amounts contained in the underlying (unrounded) figures
appearing in the consolidated financial statements. Furthermore, in tables and charts, these rounded figures may not add up exactly to the totals contained in the respective tables and charts.
You can also read