Siltronic AG Investor Presentation - May / June, 2019
←
→
Page content transcription
If your browser does not render page correctly, please read the page content below
Siltronic AG
Investor Presentation

May / June, 2019

                        © Siltronic AG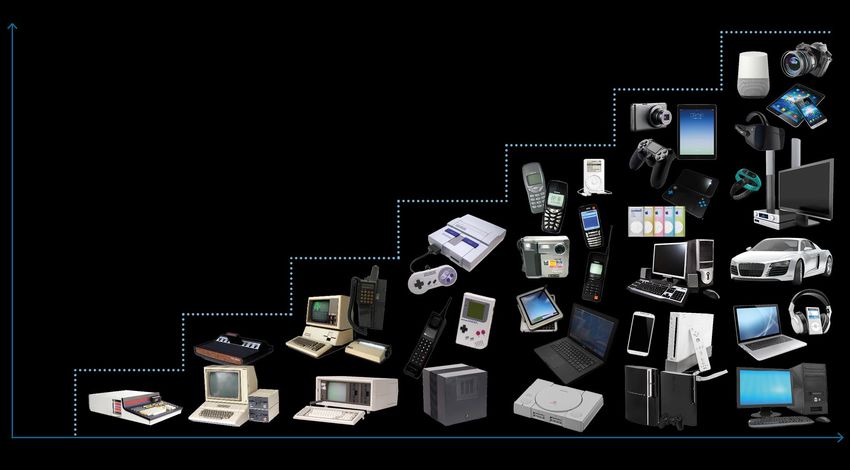
COMPANY OVERVIEW

                   © Siltronic AG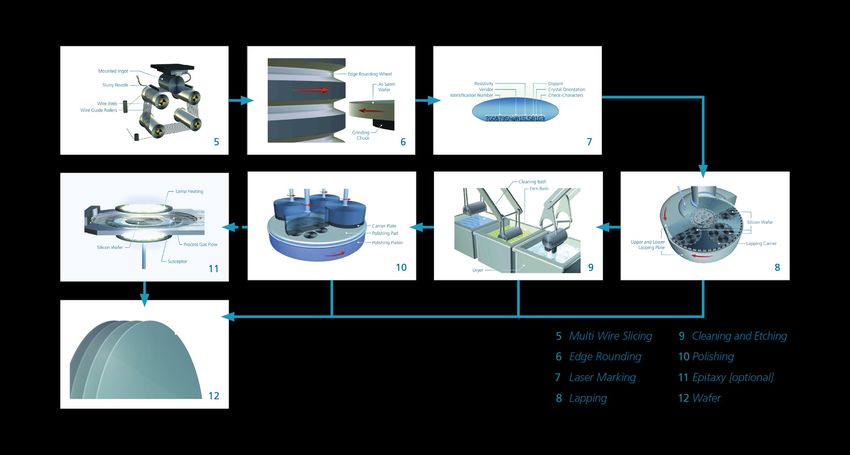
Increasing demand for electronic devices and new applications
drive semiconductor growth, which in turn fuels silicon demand.

Electronics Value Chain 2018

                  Electronics
               USD 1,622 bn

                      Semiconductors
                               USD 456 bn

           Semiconductor silicon wafers
                                            USD 11.4 bn

                   Silicon for electronic applications
                                                               USD 1.2 bn
                                               Source: Electronics (IC Insights), Semiconductors (WSTS, only silicon-based), Silicon wafers (SEMI SMG), Electronic applications (estimate)

           Siltronic AG – Investor Presentation May / June, 2019
                                                                                                                                                                                3 of 31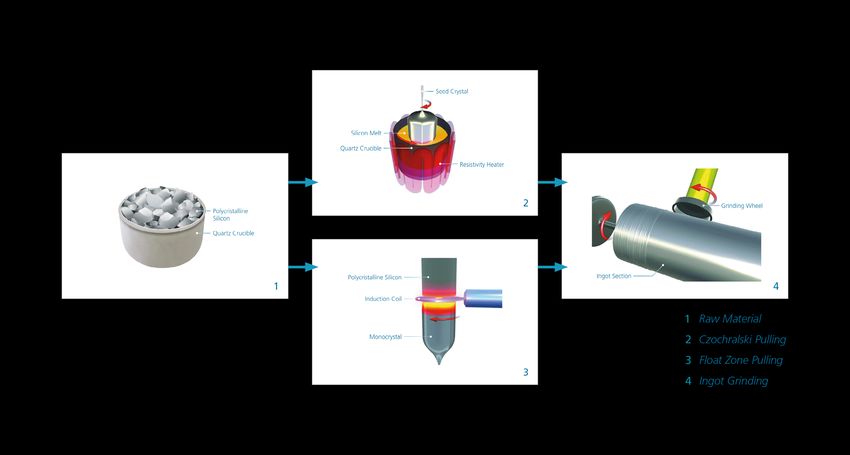
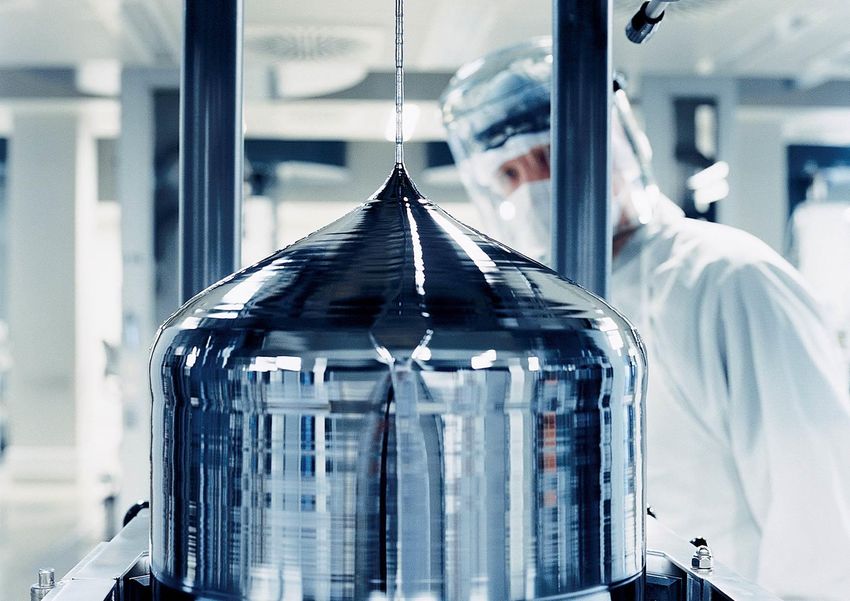
Production process - ingot growing

       Siltronic AG – Investor Presentation May / June, 2019
                                                               4 of 31
Production process - wafering

       Siltronic AG – Investor Presentation May / June, 2019
                                                               5 of 31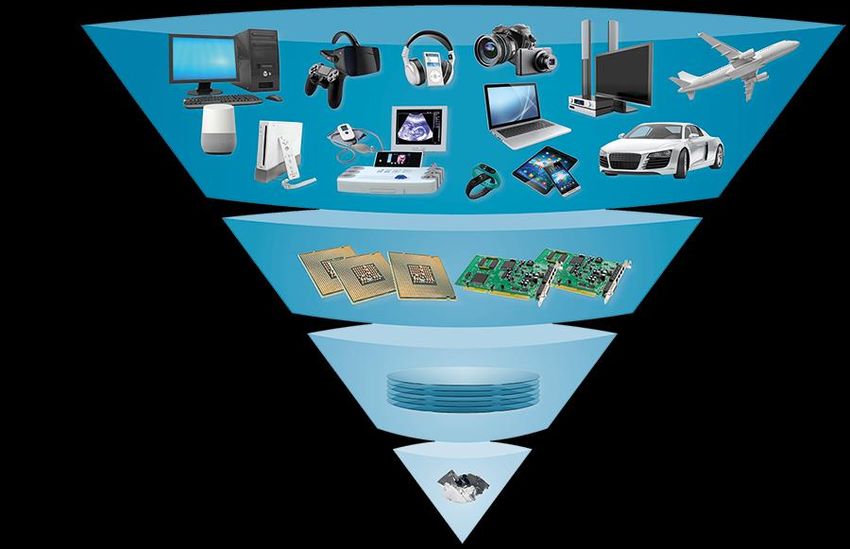
Ever new applications for electronic devices and the
infrastructure to support them continue to drive silicon demand

Electronic equipment contains multiple devices built on tailormade Si substrates

   Current growth drivers include:

   Data explosion: connected devices, data transport and storage, big data, logic/AI

   Power: renewable energy, smart grid, battery chargers

   Automotive: ADAS, infotainment, electro mobility

        1972                                                                           Today

               Siltronic AG – Investor Presentation May / June, 2019
                                                                                        6 of 31
Siltronic is focused on growing 300 mm and attractive 200 mm
business.
Development of Total Wafer Demand per Diameter, in mn 300 mm equivalents per month

                                                                                               Strong
7                                                                                              demand
        300 mm        200 mm             SD (pol/epi)                                             &
6                                                                                              growth

5

4

3                                                                                              Stable &
                                                                                               attractive
2

1                                                                                              Mid-term
                                                                                               decline
0
 2010   2011      2012         2013         2014         2015      2016   2017   2018   2019
                                                                                                Source: SEMI up to Mar 2019

           Siltronic AG – Investor Presentation May / June, 2019
                                                                                                                  7 of 31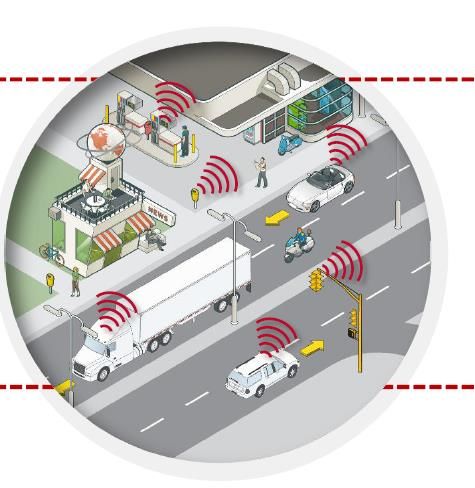
Siltronic is a strong wafer supplier with leading-edge technology

Top 5 wafer producers serve more than 90% of market across all diameters

                                                      17%           11%

                                                                                15%

                                              27%

                                                                       30%

                                        SK Siltron     Siltronic   Shin Etsu   Sumco   GlobalWafers

                                                                                           Sources: reported company revenues Q1-Q3 2018, converted to USD million

          Siltronic AG – Investor Presentation May / June, 2019
                                                                                                                                                         8 of 31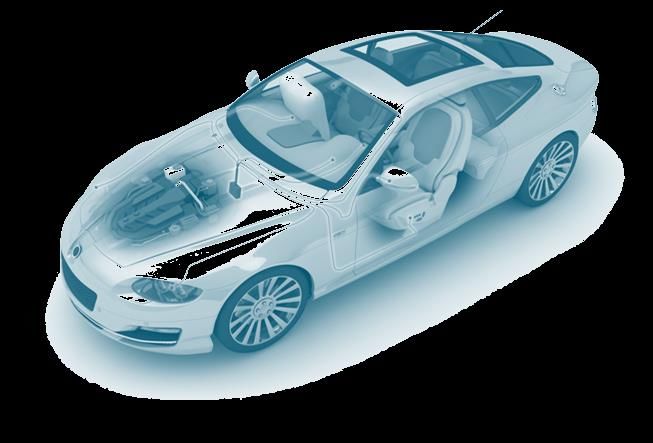
Customer base well diversified across all major semiconductor
silicon wafer consumers.

Siltronic is a supplier to all top 20 Silicon wafer consumers

         Siltronic well positioned at all                           Top 10 customers represent ~75%
         major Silicon consumers                                    of 2018 revenues

                                                                                      Source: Company Information, Siltronic

            Siltronic AG – Investor Presentation May / June, 2019
                                                                                                                  9 of 31
International manufacturing network supports
market leadership and business focus

                                                                                         Freiberg         CP*   300 mm

                                                                             Germany
                  Portland                  200 mm

United States

                                                                                         Burghausen       CP*   300 mm     SD*

►   Central R&D hub in Burghausen

►   High volume facilities for 300 mm
    in Germany and Singapore

►   Among world’s newest & largest                                                       SSW        CP*    300 mm    SSP     200 mm
    fabs in Singapore
                                                                             Singapore

*CP = Crystal Pulling | *SD = 150 mm and smaller

                     Siltronic AG – Investor Presentation May / June, 2019
                                                                                                                                 10 of 31
Continuous improvement of key ingot and wafer properties to
meet customers‘ requirements
Ingot Wafer
doping level
mechanical stability edge flatness
flatness
purity uniformity
resistivity
surface cleanliness
oxygen content shape
homogeneity
Siltronic AG – Investor Presentation May / June, 2019
11 of 31Financials improved strongly over the last years
Adjusted financial figures (EUR
million)
2015 2016 2017 2018
Sales 931.3 933.4 1,177.3 1,457.7
EBIT 2.7 27.0 235.7 497.7
EBIT margin in % 0.3 2.9 20.0 34.2
EBITDA 124.0 146.0 353.1 589.3
EBITDA margin in % 13.3 15.6 30.0 40.5
Earnings per share (0.50) 0.40 6.18 12.44
CapEx 75.0 88.8 123.2 256.9
Free cash flow 1 37.4 19.0 169.6 -
Net cash flow 1 - 39.6 124.8 240.4
.
1 In 2018, Siltronic started reporting the key figure „net cash flow“ instead of „free cash flow“. Net cash flow represents free cash flow without the time shifts created
by inflow and return of customer prepayments which, due to the size, impairs the meaningfulness of free cash flow.
Siltronic AG – Investor Presentation May / June, 2019
12 of 31Siltronic Outlook 2019 (as of April 10, 2019)
EBITDA margin between 33% and 37% (prior: slightly below prior year)
EBIT
significantly below 2018 (prior: a good 10% below 2018)
clearly positive, approx. EUR 150m (prior: EUR 100m) below 2018, with a
Net cash flow
subsequent significant increase again in 2020
Sales depending on timing of market recovery and on FX effects around 5% to 10% below 2018
(prior: in the region of the previous year)
Cost position
negative effect due to tariff increases and EUR 20m higher electricity costs in Germany
FX effects
negligible vs. 2018 assuming EUR/USD rate of 1.15 and EUR/JPY rate of 130
Depreciation
around EUR 110m
Tax rate
between 15% and 20%
Financial result
better than the previous year
Capex
about EUR 350m in capacity, automation and capabilities; significantly lower in 2020
Earnings per share
significantly (prior: slightly) below 2018
Siltronic AG – Investor Presentation May / June, 2019
13 of 31300mm demand impacted by smartphone and server softness;
Overall 200mm will depend on industry and automotive.
Si consumption demand drivers Si consumption share per selected end market
Volume Content Inventory Total effect in % of total surface in 2018
effects
Smart-
phones
34%
19%
4%
4%
PCs 5%
1%
21%
27%
25%
Servers
14%
5% 18% 20%
Industry
6%
300 mm 200 mm SD
Automotive Industrial
Cars SSD PC/Servers
Smartphone
Source: Data based on IHS Markit, Technology Group, Semiconductor Silicon Demand Forecast Tool, Q1 2019. Results are not an endorsement of Siltronic. Any reliance on these results is at the third party’s
own risk. Visit technology.ihs.com for more details. Other source: Siltronic Marketing
Siltronic AG – Investor Presentation May / June, 2019
14 of 31Siltronic strategy - capitalize on market opportunities while focusing
on 300 mm & technological leadership
Optimize returns,
stay ahead in technology and
grow with the market
Strategic Focus
Grow Ensure Improve Execute
with the market technology & financial performance cost reduction
quality leadership & cash flow roadmaps &
debottlenecking
concepts
We continuously increase the value for our stakeholders by providing best-in-class wafers
at competitive costs.
Siltronic AG – Investor Presentation May / June, 2019
15 of 31APPENDIX
© Siltronic AGSlow start into 2019 due to weaker wafer area demand
Sales, in EUR million Cost of Sales, in EUR million
354.4
361.3 379.8 388.1
327.4
202.5 209.3 204.8 208.1 209.9
Q1 2018 Q2 2018 Q3 2018 Q4 2018 Q1 2019 Q1 2018 Q2 2018 Q3 2018 Q4 2018 Q1 2019
Gross profit, in EUR million / Gross margin, in % Comments
Sales in Q1 down vs. Q4 2018 as expected
46.1 46.4 due to lower wafer area sold
42.1 40.8
38.1 COGS per cm2 only slightly up despite
significantly higher energy costs
Gross margin up y-o-y but down q-o-q
152.0 175.0 180.0 144.5
124.9
Q1 2018 Q2 2018 Q3 2018 Q4 2018 Q1 2019
Siltronic AG – Investor Presentation May / June, 2019
17 of 31Profitability affected by higher costs
EBITDA, in EUR million / EBITDA margin, in % Depreciation, in EUR million
37.4 40.4 42.2 41.4
35.9
122.3 146.0 160.2 160.8 127.2
25.7 21.9 22.2 21.9 23.8
Q1 2018 Q2 2018 Q3 2018 Q4 2018 Q1 2019 Q1 2018 Q2 2018 Q3 2018 Q4 2018 Q1 2019
EBIT, in EUR million / EBIT margin, in % Comments
34.4 36.3 35.8
Depreciation in FY 2019 up due to new crystal
29.5 29.2
pulling hall and new equipment
EBITDA margin impacted by COLA and higher
energy costs
138.0 138.9 EBIT margin FY 2019 additionally impacted by
96.6 124.1 103.4 higher depreciation
Q1 2018 Q2 2018 Q3 2018 Q4 2018 Q1 2019
Siltronic AG – Investor Presentation May / June, 2019
18 of 31Shareholders to participate in continued value creation
Net profit attributable to shareholders, EPS, in EUR
in EUR million
97.5 2.62 3.04 3.53 3.25 2.68
78.6 91.3 105.8 80.3
Q1 2018 Q2 2018 Q3 2018 Q4 2018 Q1 2019 Q1 2018 Q2 2018 Q3 2018 Q4 2018 Q1 2019
Dividend payment, in EUR million Comments
Net profit EUR 80.3m in Q1
General dividend policy: pay-out ratio of approx.
40% of net income attributable to shareholders
150 Proposal to AGM on May 7, 2019: increased
dividend of EUR 5.00 per share
75
0 (prior year: EUR 2.50)
FY 2017 FY 2018 FY 2019e
Siltronic AG – Investor Presentation May / June, 2019
19 of 31Strong equity ratio and solid net financial assets
Equity, in EUR million Pension provision, Net financial assets,
Equity ratio, in % in EUR million in EUR million
49.9 50.4
48.4 48.4
46.6
Interest rates IFRS
USA 3.81% 3.99% 4.02% 4.08% 3.69%
Germany 2.02% 2.00% 2.04% 1.98% 1.66%
720 842 916 968 603 714 691 762
707 491
381 389 374 362 422
Mar Jun Sep Dec Mar Q1 Q2 Q3 Q4 Q1 Mar Jun Sep Dec Mar
18 18 18 18 19 2018 2018 2018 2019 2019 18 18 18 18 19
Siltronic AG – Investor Presentation May / June, 2019
20 of 31Strong net cash flow despite high payments for capex
Operating cash flow (OCF), in EUR million Customer prepayments net (PP), in EUR million
231.2
174.6 165.4 115.7
131.1
80.7
37.2 18.7 4.4
Q1 2018 Q2 2018 Q3 2018 Q4 2018 Q1 2019 -16.8
Q1 2018 Q2 2018 Q3 2018 Q4 2018 Q1 2019
CF Capex, in EUR million Net cash flow (NCF), in EUR million
112.4 93.0
67.1 80.8
-25.0 -48.3 -53.7 -67.1 -32.2
-108.5
Q1 2018 Q2 2018 Q3 2018 Q4 2018 Q1 2019
Q1 2018 Q2 2018 Q3 2018 Q4 2018 Q1 2019 NCF= OCF-PP-CF Capex
Siltronic AG – Investor Presentation May / June, 2019
21 of 31Siltronic – More than 50 years of experience in the semiconductor
industry
Highlights of the history of Siltronic AG
1984 1999
First 200 mm wafers Fab in Singapore 2014
at Wacker- kicks off production Take-over of
Chemitronic majority stake
(78%) in Siltronic
1968 1995 Silicon Wafer Pte. 2017
Wacker-Chemitronic Acquisition of Freiberger Ltd. in Singapore Wacker executes a
Gesellschaft für 2004
Elektronikwerkstoffe Company second placement
Elektronik-Grundstoffe Produktions- und and holds a
mbH (“Wacker- name changed
Vertriebsgesellschaft to Siltronic AG minority of 30.8%
Chemitronic”) founded mbH, Freiberg
1978 1997 2006
2018
Foundation of Wacker Siltronic Joint venture Siltronic
Ground-breaking
Wacker Siltronic Singapore Pte. Ltd. Samsung Wafer Pte.
for the crystal
Corporation in founded Ltd. (now: Siltronic
pulling hall of the
Portland, Oregon Silicon Wafer Pte. Ltd.)
latest generation in
(USA) with Samsung.
1990 2004 2015 Singapore
1962 First research 300 mm silicon Siltronic
Development of and development wafer fab launches executes
the first silicon projects for production in successful
wafers 300mm wafers Freiberg IPO
Siltronic AG – Investor Presentation May / June, 2019
22 of 31Outstanding cost reduction and efficiency improvement track
record
Number of employees Variable costs of 300 mm wafer 300 mm Productivity1 (Germany)
(Germany),
in EUR / Wafer 200
6,953
>40%
3,914 >100%
from 7 to 4 Sites
100
2002 2018
2018 2010 2015
2018 2009 2015
2018
Successful restructuring More than 40% reduction of Almost 100% increase of
including Germany the variable unit costs in employee productivity in 300
300 mm wafer mm wafer
1 Delivered wafer / paid hours (2009 = 100)
Siltronic AG – Investor Presentation May / June, 2019
23 of 31Clear commitment to sustainability
Sustainability at Siltronic AG
Claim: We understand sustainability as responsible action for society and
want to generate competitive advantages through sustainable action.
Strategy: We plan resource-saving right from the start, based on product and
production safety as well as health and environmental protection.
Voluntary commitments: We follow the principles of the Sustainable
Development Goals, the United Nations Global Compact, and the Responsible
Care and Responsible Business Alliance initiative.
Goal: We want to reconcile the effects of our business activities with the
expectations and needs of society.
Investor-Rating: Since 2018, we have been analyzed by ISS-oekom, one of the
world's leading rating agencies for sustainable investments, and assessed with
regard to the ESG criteria (Environment, Social, Governance). Right from the start,
we were awarded ‘Prime’ status for our sustainability activities.
Siltronic AG – Investor Presentation May / June, 2019
24 of 31Creating value for key stakeholders
… its customers and suppliers … its shareholders
Quality & innovation Long-term value enhancement
Product safety Attractive returns
Process reliability On-going cost reduction
Siltronic
offers ...
... its employees … society
Occupational safety & health protection Conservation of resources & recycling
Personnel development & satisfaction Compliance & human rights
Diversity & equality Social commitment
Siltronic AG – Investor Presentation May / June, 2019
25 of 31Shareholder structure
Identified free float by region
(State: December 31, 2018)
42.2 % 29% 26%
69.2 %
100 % 19% 26%
USA UK Germany Other
57.8 %
Significant notifications of voting rights
(State: March 31, 2019)
30.8 %
BlackRock, Inc. 4.59 %
State of Norway 4.93 %
pre-IPO post IPO since March 15, Morgan Stanley 3.20 %
2018
J.P.Morgan 3.27 %
Wacker Chemie AG Free Float
Siltronic AG – Investor Presentation May / June, 2019
26 of 31Data storage, networking and digitalization
Security Infotainment
Cloud
Networking
Engine
Comfort
Electronic
Chassis
systems
Second camera 7 billion networked devices will collect around 60
ZB of data in 2021
Front camera 160
Flash NAND 120
Zeta-byte
Zetabyte
Zetabyte
(256 GB)
80
Broadband
processor 40
0
2010 2013 2016 2019 2022 2025
Source: CISCO VNI Forecast, IDC Data Age 2025; Siltronic estimates
Siltronic AG – Investor Presentation May / June, 2019
27 of 31Industrial semiconductor segment comprises a wide range of
applications
Medical Building & Home Manufacturing
diagnostics and control built in climate control manufacturing equipment
imaging equipment lighting robotics
laboratory test safety & security equipment process control equipment
patient monitoring measurement instruments
motor controls
Aerospace & Military
Power & Energy aircraft systems Other Industrial
radar, sonar, avionics
equipment for energy missile guidance power tools
production and distribution military grade computers ATMs
industrial power supplies ships, golf cars, electric bikes
energy meters and trains
Source: appliedmaterials.com
Siltronic AG – Investor Presentation May / June, 2019
28 of 31Contact and Additional Information
Issuer and Contact Additional Information
Siltronic AG ISIN: DE000WAF3001
Hanns-Seidel-Platz 4 WKN: WAF300
D-81737 München Deutsche Börse: WAF
Listing: Frankfurt Stock Exchange
Investor Relations:
Prime Standard
Petra Mueller
Email: petra.mueller@siltronic.com
Tel. +49 89 8564-3133
Financial Calendar
Half Year Report July 25, 2019
Q3 Quarterly Statement October 24, 2019
Siltronic AG – Investor Presentation May / June, 2019
29 of 31Disclaimer
The information contained in this presentation is for background purposes only and is subject to
amendment, revision and updating. Certain statements contained in this presentation may be
statements of future expectations, future financial performance and other forward-looking statements
that are based on management's current views and assumptions and involve known and unknown risks
and uncertainties. In addition to statements which are forward-looking by reason of context, including
without limitation, statements referring to risk limitations, operational profitability, financial strength,
performance targets, profitable growth opportunities and risk adequate pricing, words such as "may”,
“will”, “should”, “expects”, “plans”, “intends”, “anticipates”, “believes”, “estimates”, “predicts”, “continue”,
“projects” or “seeks”, “potential”, “future”, or “further” and similar expressions may identify forward-
looking statements. By their nature, forward-looking statements involve a number of risks, uncertainties
and assumptions which could cause actual results or events to differ materially from those expressed or
implied by the forward-looking statements. These include, among other factors, changing business or
other market conditions, currency and interest fluctuations, introduction of competitive products, poor
acceptance of new products and services, change of the corporate strategy and the prospects for
growth anticipated by the management. These and other factors could adversely affect the outcome and
financial effects of the plans and events described herein. Statements contained in this presentation
regarding past trends or activities should not be taken as a representation that such trends or activities
will continue in the future. Siltronic AG does not undertake and does not intent to undertake any
obligation to update or revise any statements contained in this presentation, whether as a result of new
information, future events or otherwise. In particular, you should not place any reliance on forward-
looking statements which speak only as of the date of this presentation.
Siltronic AG – Investor Presentation May / June, 2019
30 of 31SILTRONIC AG | Hanns-Seidel-Platz 4
81737 Munich
Germany
© Siltronic AGYou can also read