Investor Presentation - May 2015 - Cnova

Page created by Tyler Lawrence
 
CONTINUE READING
Investor Presentation - May 2015 - Cnova
Investor Presentation
May 2015
Investor Presentation - May 2015 - Cnova
AGENDA

    1 - Our markets, a significant opportunity

    2 – Cnova is built on two strong companies: Cdiscount and Cnova Brasil

    3 - The development of marketplaces: a key element of our business model

    4 – Synergies with Parent Companies

    5 – 1Q15 Financial Results

2
Investor Presentation - May 2015 - Cnova
OUR MARKETS: A SIGNIFICANT OPPORTUNITY

3
Investor Presentation - May 2015 - Cnova
OUR MARKETS : A SIGNIFICANT OPPORTUNITY

Brazil and France are large underpenetrated markets

     E-commerce penetration is low in France and Brazil                                          Brazil E-commerce market growth
    E-commerce market as % of total retail market, consumer goods                E-commerce market sales excl. taxes (BRL Bn)
    (excl. Services), 2013
                                                                                                                                                       57
         South Korea
                                                                                                                             13-18 CAGR: +20%
                                                                         12,9%                                                                   47
      United Kingdom                                             10,4%                                                                   39
                                                                                                                                    33
            Denmark                                           9,2%                       08-13 CAGR: +18%                      28
                                                                                                                        23
                                                                                                         17     20
             Finland                                   7,8%                                       15
                                                                                   10     12
              Ireland                                  7,7%
                USA                                   7,4%               1.9x     2008    2009    2010   2011   2012   2013 2014E 2015E 2016E 2017E 2018E
             Norway                                   7,3%
                                                                                 Penetration Rate                      3.1%                           4.9%
            Germany                            6,0%
               China                           5,6%          2.4x                                France E-commerce market growth
             France
            France                             5,5%
                                                                                 E-commerce market sales excl. taxes (€ Bn)
             Belgium                    4,0%
              Brazil
             Brazil                3,1%                                                                                       13-18 CAGR: +15%         47
                                                                                                                                                 41
               Chile             2,3%                                                                                                    36
                                                                                                                                    30
             Ecuador        1,5%                                                         08-13 CAGR: +19%                      26
                                                                                                                       23
                                                                                                         18     20
            Thailand       1,0%                                                                   15
                                                                                   10      12
            Colombia      0,9%
             Vietnam     0,5%
                                                                                  2008    2009    2010   2011   2012   2013 2014E 2015E 2016E 2017E 2018E
             Growth potential in France and Brazil                               Penetration Rate                      5.5%                           9.6%

4
Investor Presentation - May 2015 - Cnova
CNOVA: BUILT ON TWO STRONG COMPANIES

5
Investor Presentation - May 2015 - Cnova
CDISCOUNT: ACCELERATED GMV GROWTH

        Net Sales - €m                                                                               GMV - €m                                                     Active customers - millions

      1800                                                                                 2500                                                                       7
                                                                                                                                                          2 312
                                                                      1 606                                                                                                                    6,26
      1600
                                                                                                                                                                      6
                                                             1 420                                                                                                                      5,46
                                                                                           2000                                                   1 900
      1400
                                                    1 284
                                                                                                                                                                      5          4,79
      1200
                                                                                                                                          1 624
                                           1 110
                                                                                           1500                                                                           3,97
      1000                         966                                                                                            1 335                               4
                          870
                                                                                                                          1 155
                 788
        800                                                                                                   1 041
                                                                                                      942                                                             3
                                                                                           1000
        600
                                                                                                                                                                      2
        400
                                                                                             500
                                                                                                                                                                      1
        200

           0                                                                                    0                                                                     0
                2008 2009 2010 2011 2012 2013 2014                                                   2008 2009 2010 2011 2012 2013 2014                                   2011   2012   2013   2014

    Note
    See Definitions section of this presentation for additional information regarding certain metrics used in this page
6
Investor Presentation - May 2015 - Cnova
CDISCOUNT: A MARKET LEADER WITH A PROVEN TRACK RECORD OF GROWTH

A leading marketshare position in France based on pricing leadership, click and collect and
financing options
                                                                                                                                                                        35,3%

                                                                                                                                     Large Home
    Online market share in France in Technical                                           Goods(1)(2)                                 Appliances(1)

                                                                                                                                                                         2014

                                                                                                                                                                        26,6%
                                                                                                                                     Small Home
                                      +230 bps                    27,6%
                                                                                                                                     Appliances(1)

                                                                                                                                                                         2014
                                        26,5%
                                                                                                                                                                                o.w. 44,2%
                                                                                                                                                                        27,7%     in TVs
               25,3%                                                                                                                 Consumer
                                                                                                                                    Electronics(1)

                                                                                                                                                                         2014

                                                                                                                                                                        22,8%
                                                                                                                                    IT Products(1)
               2011                      2013                     2014

                                                                                                                                                                         2014
     Notes
     1. Source: GfK. GfK Technical Product Categories: Home appliances = small and large household appliances; Consumer Electronics= TV-Video, camera, sound, phones;
        IT Products = computers, laptops, printers, tablets, components
     2. Internet market – annual average in 2011-14
7
Investor Presentation - May 2015 - Cnova
CDISCOUNT: A PROVEN TRACK RECORD OF GROWTH AS A LEADER

Click-and-Collect: major advantage over competition in France

      Outsourced locations for large products
      Group Casino locations for large products

                                                  • Extensive network of pick-up points at end of 1Q15:
                                                    c. 19,100, of which 593 for large goods,

                                                  • Close to 70% of Net Sales delivered through Click-
                                                    and-Collect in in 1Q15 vs. 44% in 2010

                                                  • Customer advantage:
                                                    faster, free of charge and convenient

                                                  • On average, 40% lower cost to the company
                                                    compared to home delivery

8
CDISCOUNT: A BROADER CUSTOMER BASE IN HIGHER MARGIN CATEGORIES

New specialty sites: addressing a broader customer base

    •   Expansion into higher growth and higher margin product categories, targeting a higher income customer
        base
    •   Launch of new sites: a quick and industrialized process requiring limited investment, leveraging Cnova’s
        infrastructure and experience

Health and beauty             Apparel             Do It Yourself      Garden / outdoor
         August 2010         February 2013         December 2014           April 2015
                                                                                             Specialty websites
              ²                    ²                     ²                     ²
                                                                                                  Premium brands

                                                                                                  Premium customers

                                                                                                  Advice and editorial
        Home Décor         Baby products        Children Universe                                 content
                             December 2014           April 2015
         January 2013
                                                                              3
                                   ²                     ²
              ²                                                      Additional² specialty
                                                                       websites to be
                                                                     opened by 2015 year
                                                                             end

9
CDISCOUNT: A PROVEN TRACK RECORD OF GROWTH AS A LEADER

Mobile contribution to traffic and GMV increasing at a fast pace
                                                        Traffic: evolution of Mobile contribution
                                                                                                                                                  44,9%
                                                                                                                                          39,9%
                                                                                                                                  37,5%
                                                                                                                          35,5%
                                                                                                              31,1%
                                                                                                 26,8%
                                                                                     23,5%
                                                                        19,4%
                                                           16,9%

                                                            Q1 13 Q2 13 Q3 13 Q4 13 Q1 14 Q2 14 Q3 14 Q4 14 Q1 15

                                                         GMV(1): evolution of Mobile contribution
                                                                                                                                                  23,1%
                                                                                                                                          21,6%
                                                                                                                                  20,5%

                                                                                                            16,4% 17,0%
                                                                                               14,0%
                                                                                   12,5%
                                                                      10,2%
                                                           7,1%

                                                          Q1 13 Q2 13 Q3 13 Q4 13 Q1 14 Q2 14 Q3 14 Q4 14 Q1 15
     Note
10   See Definitions section of this presentation for additional information regarding certain of the metrics used in this page
CNOVA BRASIL: A SUCCESSFULL CHALLENGER WITH SUPERIOR GROWTH PROFILE

     Net Sales - €m                                                                         GMV - €m                                                       Active customers - millions

     2000                                                                                 2500                                                                   8
                                                                   1 868
                                                                                                                                                                                          7,29
                                                                                                                                                   2 204
     1800
                                                                                                                                                                 7

     1600                                                                                 2000
                                                          1 478
                                                                                                                                                                 6
                                        1 373 1 365                                                                                        1 664                                   5,54
     1400
                                                                                                                           1 493   1 501                         5
     1200                                                                                 1500
                               1 019                                                                                                                                        4,15
     1000                                                                                                              1 140                                     4   3,57
     800                                                                                  1000
                                                                                                                                                                 3

     600
                                                                                                                                                                 2
                        375                                                                 500                448
     400

              181                                                                                    243                                                         1
     200

         0                                                                                     0                                                                 0
              2008 2009 2010 2011 2012 2013 2014                                                    2008 2009 2010 2011 2012 2013 2014                               2011 2012 2013 2014

     Note
     See Definitions section of this presentation for additional information regarding certain metrics used in this page
11
CNOVA BRASIL : A SUCCESSFULL CHALLENGER WITH SUPERIOR GROWTH PROFILE

 Click-and-Collect: a unique advantage in Brazil

                                                   Roll-out planned in Brazil

                                                   • 210 pick-up locations as of end of Q1 2015,
                                                     representing double the number of pick-up
                                                     points compared to the end of 4Q14

                                                   • Opportunity to expand to approximately
                                                     1,200 pick-up points based on existing
                                                     GPA/Viavarejo store network

                                                   • On average, 40% lower cost to the company
                                                     compared to home delivery

12
CNOVA BRASIL : A SUCCESSFULL CHALLENGER WITH SUPERIOR GROWTH PROFILE

 Mobile contribution to traffic and GMV increasing at a fast pace
                                            Traffic: evolution of Mobile E-commerce contribution

                                                                                                                                        25,1%
                                                                                                                          21,7%
                                                                                                              19,8% 20,5%

                                                                                      13,8% 15,0%

                                                                          7,1%
                                                 3,4% 3,8%

                                                 Q1 13 Q2 13 Q3 13 Q4 13 Q1 14 Q2 14 Q3 14 Q4 14 Q1 15

                                             GMV : evolution of Mobile E-commerce contribution

                                                                                                                                        15,0%

                                                                                                                           9,8% 10,5%
                                                                                                              7,8%
                                                                                                 6,7%
                                                         4,0% 4,3%
                                               2,9% 3,2%

                                               Q1 13 Q2 13 Q3 13 Q4 13 Q1 14 Q2 14 Q3 14 Q4 14 Q1 15
     Note
     See Definitions section of this presentation for additional information regarding certain metrics used in this page
13
CNOVA BRASIL : A SUCCESSFULL CHALLENGER WITH SUPERIOR GROWTH PROFILE

 Consumer financing in Brazil

     • Similar to off line retailers, Cnova Brasil offers interest-free payments through installments
        o 70% to 80% of sales
        o Average ticket around 450 BRL (Approx 140 €)
        o Average maturity: around 3.5 months

     • Receivables fully discounted with full transfer of collection risk to third parties:
       banks and credit card companies

     • Cost of funding actively managed and represents around 3.5% of sales

      Note
      Figures as of end of 2014
14
CNOVA = CDISCOUNT + CNOVA BRASIL

     Proven success in both mature and emerging markets
                                                                                                        Launch of
                                                                               Foundation of            Casasbahia.com.br
                                                                               Pontofrio.com
       First sales of                                                          as a standalone                    Creation of Nova     Launch of Extra
       Pontofrio.com                                                           company                            Pontocom             Marketplace

                                                                                                                                             2,2
                                              1st French website to
                                              exceed revenues of €1bn
                                              Launch of French Marketplace                                                           1,7
                        Casino                                                                                                1,5
        Cdiscount
                        investment
        founded
                        in Cdiscount                                                                                  1,5
                                                                                                           1,1

                                                                                                 0,4                                         2,3
                                                                                        0,2                                          1,9
                                                                                                                              1,6
                                                                                                           1,2        1,3
                                                                                        0,9      1,0
                                                                                                                       2008-14 CAGR: 25%
        1998    1999    2000   2001    2002   2003    2004     2005     2006   2007     2008     2009      2010      2011     2012   2013   2014

15
MARKETPLACES: A KEY ELEMENT OF OUR BUSINESS MODEL

16
MARKETPLACES : A KEY ELEMENT OF OUR BUSINESS MODEL

Cdiscount’s marketplace model has been successful since its launch in 2011
Brazil: replicating French marketplace success
                            Number of sellers (thousands)                                                                       Cdiscount Marketplace as % of total GMV
                                                                                              8,7
                                                                                       7,1
                                                                                5,9                                                                            22%                 25%
                                                                        4,9
                                                                 4,1                                                                                     13%
                                                          3,2
                                                  2,4
                                           1,9
                             1,2                                                                                                          6%
                     0,5 0,7                                                                                                    1%

                                                                                                                                Dec. 2011 Dec. 2012 Dec. 2013 Dec. 2014 March 2015

                          Number of product offerings (m)                                                                     Cnova Brazil Marketplace as % of total GMV
                                                                                               16

                                                                                12      12                                                                       6.3%
                                                                         10
                                                                  8
                                                           6
                                                    5                                                                                    2.1%
                                            4
                              1      2
                      1

                                                                                                                                     End of March 2014         End of March 2015

       Note
       See Definitions section of this presentation for additional information regarding certain of the metrics used in this page
17
MARKETPLACES : A KEY ELEMENT OF OUR BUSINESS MODEL

      Value proposition to sellers                                  Fast ramp-up of marketplace in France and Brazil                             Key benefits for Cnova

                                                                              Product Offerings (MM)
                                                                                                                                          16
            Access to Cnova’s traffic                                                                                                             Increases profitability
                                                                                                                 12
                                                                                                                                                  • Commission-based
                                                                                                                                                    business model
                                                                                       6
            Opportunity to access
            Cnova fulfillment and
            delivery capabilities :
            distribution centers and                                                Dec-13                    Dec-14                    Mar-15
                                                                                                                                                  Extends product
            Click & Collect
                                                                                                                                                  assortment
                                                                                                                                                  • Added 10M product
            Option to pay in                                                                                                                        offerings to Cnova’s
            installments                                                                                                                            websites over last fifteen
                                                                                            15% of                                   25% of         months
                                                                                           Cdiscount                                Cdiscount
                                                                                             GMV                                      GMV
            Integration capabilities                                                         1Q14                                     1Q15
            and marketplace                                                                                                                       Drives traffic (SEO, Direct
            operational tools                                                                                                                     Visit)
                                                                                            2% of                                  6% of
                                                                                         Cnova Brazil                           Cnova Brazil
                                                                                            GMV                                    GMV
                                                                                             1Q14                                     1Q15

       Note
       See Definitions section of this presentation for additional information regarding certain of the metrics used in this page
18
SYNERGIES WITH PARENT COMPANIES

19
SYNERGIES WITH PARENT COMPANIES ENABLING CNOVA TO BENEFIT
     FROM PURCHASING POWER AND EXCLUSIVE ACCESS TO PICK-UP POINTS

                         Areas of partnerships & selected examples

                                • Purchasing synergies with Viavarejo
           Purchasing
                                • Purchasing synergies with Casino Group since 2008

                                • Over 400 pick-up points for large parcels within Casino stores
            Click &
            Collect             • Ongoing expansion of pick-up points in Brazil

                                • Shared distribution centers in France and Brazil
           Fulfillment

            Brands              • 20-year agreement with parent companies

20
1Q15 Financial Results

21
1Q15 Key Highlights

                                                                                                                                                                YoY change
                                                  Cnova                                      1Q 2014                  1Q 2015
                                                                                                                                                 YoY
                                                                                                                                                                 (excl. new
                                              in € millions                                                                                     change
                                                                                                                                                                 countries)
                           GMV                                                                  973.7                  1 248.2                  +28.2%             +27.2%
                           Net sales                                                            777.4                   915.5                   +17.8%             +16.6%
                           Gross profit                                                          96.2                   113.2                   +17.6%             +18.3%
                           As a % of net sales                                                  12.4%                    12.4%                       (-)          +18bps
                           Adjusted EBITDA                                                       -1.4                    -18.2                      n/a             n/a
                           As a % of net sales                                                   -0.2%                   -2.0%                   -180bps          -127bps
                           Net financial expense                                                -15.0                    -5.4                    -64.3%             n/a
                           Adjusted EPS                                                        -0.04€                   -0.06€                     n/a              n/a
                           FCF (LTM)                                                            -47.1                    27.6                     +74.7             n/a
                           Net cash (net financial debt)                                       -135.2                    70.8                    +205.9             n/a

                      Strong GMV growth of +28.2% and Net sales growth of +17.8%:
                          Direct sales increase of +17.8%, including +18.3% for Cnova Brazil (in local currency) and +16.4% for Cdiscount
                          Marketplace GMV increase of +132.3%, with higher penetration rate of 15.4% of total GMV in 1Q15 compared to 8.5% in
                          1Q14
                      Gross profit margin improvement excl. new countries of +18bps year-over-year
                      Impact on SG&A costs from increased investments for future growth: +175bps increase in operating expenses as a % of total
                      Net sales, leading to a decrease in Adjusted EBITDA
                      Improvement in Net financial expense
                      Free Cash flow of +28 M€ over the last twelve months, representing an improvement of +75 M€ year-over-year. Excluding the
                      impact of exchange rate, the improvement represents +92 M€ (+25.4 M€ at the end of 1Q15 vs -66.8 M€ at the end of 1Q14)
                      Strong cash increase of +206 M€, with a net cash position of +71 M€ at the end of 1Q15 vs -135 M€ at the end of 1Q14

     Note
22
     See Definitions and Non-GAAP Reconciliations sections of this presentation for additional information regarding certain of the metrics used in this page
Strong commercial dynamics

              Strong growth of Net sales and GMV                                                                                        Traffic increase of +42.2% yoy
                                               (€ million)                                                                                               (million)

                                                                          +28.2%
                       +17.8%                                                                                                                            +42.2%
                777.                                                                   1248.2
                                    915.5                                                                                                                                   436
                 4                                             973.7
                                                                                                                                               307

               1Q14                 1Q15                       1Q14                     1Q15                                                  1Q14                         1Q15
                      Net sales                                         GMV

                Strong growth of active customers
                                                                                                                                   Accelerated growth in marketplaces
                                               (million)

                                                                                                                                                         +132%             15.4%
                                               +27.6%
                                                                        14.8
                               11.6                                                                                                            8.5%

                                                                                                                                               1Q14                        1Q15
                                                                                                                                  Marketplace share of GMV           Marketplace GMV growth
                       March 31, 2014                           March 31, 2015                                                    Extended assortment : 16 million product offerings, +88%
                                                                                                                                  More sellers : +110%, reaching 8,650 sellers

     Note
     See Definitions section of this presentation for additional information regarding certain of the metrics used in this page
23
Improving quality of key commercial indicators

            Increase in number of orders per customer                                                                                Increase in mobile share of traffic
                                                    (million)

                                                                            Higher number of
                                +38.2%                                      orders per unique                                                                   +1 193bps
                                                9.3
                                                                            customer :                                                                                            34.0%
                        6.8                                                 +11.9% in France
                                                                            +5.4% in Brazil                                                       22.0%

                      1Q14                    1Q15                                                                                                 1Q14                           1Q15

                      Increase in number of items sold                                                                      Mobile share of traffic now represents almost 45% in
                                                    (million)                                                               France (+ 1385 bps) and 25% in Brazil (+1019 bps)
                                                                                                                           …with successful implementation of new mobile capabilities
                                                                            Higher number of
                                +38.9%                                      items per unique                                       Responsive
                                                                            customer :                                                                          • Improved presentation
                                               16.0                                                                                  design
                                                                             +4.2%
                       11.5                                                                                                                                     • Fingerprint payment
                                                                                                                                   Fingerprint
                                                                                                                                                                  authorization for iOS
                                                                                                                                                                • Mobile dashboard for
                                                                                                                                   Seller shop
                                                                                                                                                                  marketplace vendors
                      1Q14                    1Q15                                                                                   Speech
                                                                                                                                                                • Speech recognition for Android
                                                                                                                                   recognition

     Note
24   See Definitions and Non-GAAP Reconciliations sections of this presentation for additional information regarding certain of the metrics used in this page
Gross margin improvement

                                                                                                                                                                Gross Margin
                           Gross margin improvement
                                                                                                                                              (excl. new countries, % of net sales)

                      Stable price positioning
                         In Brazil since the end of 3Q14, after                                                                                                    + 18bps
                         price investments were implemented
                         over the 1Q-to-3Q14 period                                                                                                                          12.6%
                                                                                                                                                       12.4%
                         In France since the end of 1Q14

                      Marketplace growth
                        Increased marketplace contribution
                        Stable commission rates in both
                        countries                                                                                                                      1Q14                  1Q15

                                                                                                                                     Gross margin improvement excluding new
                      International purchasing synergies                                                                             countries : +18bps vs. 1Q14
                          Well on track to deliver international                                                                           Including significant gross margin expansion
                          purchasing synergies, expected to be                                                                             in France year-over-year
                          realized in 2H15

     Note
25
     See Definitions and Non-GAAP Reconciliations sections of this presentation for additional information regarding certain of the metrics used in this page
Increased investment to enhance future growth:
     1. Infrastructure improvement to enhance customer service

                        France                                                                     Brazil
                              End of 2014 : 228k sqm                                                      End of 2014 : 297k sqm
                              1Q15 expansion:                                                             1Q15 evolution:
                              • Opening of St Mard                                                        • Consolidation of
                                 (48k sqm)                                                                   Cajamar & Tamboré
                              • Extension of Andrézieux/                                                     DCs to Jundiaí DC with
                                 St Bonnet (33k sqm)                                                         increase of +38k sqm
                              In preparation:                                                    1 DC     In preparation:
                              • Opening of another                                                        • Opening of 3 DCs in the
                                                                                                1 DC
                                 warehouse in St Mard of                            4 DCs                    Mid-West, Southern and
                                 40k sqm : early Q4               North     Northeast       Middle West      Northeast regions (+30k
                                                                     South East         South                sqm)

                   Capacity Increase                                                     Capacity Increase
      Implemented in 1Q15: +81k sqm i.e. c.+35% of               Implemented in 1Q15: +38k sqm i.e. c.+13% of
      total                                                      total
      In preparation: +40k sqm                                   In preparation: +30k sqm

           Total increase of +53% in 2015                                 Total increase of +23% in 2015

               Shorter delivery time                       Higher capacity for extended product assortment

               Increased fulfillment efficiency                    Reduced transportation costs

26
Increased investment to enhance future growth:
     2. Increased physical presence

                     Accelerated roll-out of the click and collect network

           France:
             Expansion of click-and-collect network to 19,100 points (+10% vs. 1Q14)

             593 pick-up points for large items (+34% vs. 1Q14)

           Brazil:
             Doubling of pick-up points compared to the end of 4Q14, reaching 210 at the end of 1Q15

             Launch of immediate availability currently tested in select Casas Bahia and Pontofrio stores

           Advantage for customers:
             Faster

             Convenient

             Free of charge

           On average, 40% lower cost for the Company compared to home delivery

27
Increased investment to enhance future growth:
     3. Key IT developments

                           Key strategic investments in IT systems

           France:
             New warehouse management system (Manhattan) which manages inventories across several
             warehouses and will provide same day delivery
             New search engine (Solr) which manages an extended product offering and improves navigation
             capability
             New software (Responsive Design) to better present products on mobile devices
             Single registration for sellers for multiple marketplace sites

           Brazil:
             Accelerated investment in a new ERP system, in conjunction with a new warehouse
             management system and a new customer service system
             Launch of a new recommendation tool

           Advantage for customers:
             Reduced delivery time
             Improved ability to offer customers their desired products

28
SG&A evolution reflecting the impact of
     increased investments for future growth

                                                                    Operating Expenses
             Accelerated Investments
                                                     (excl. new countries and Other Expenses, % of net sales)

         Impact of very strong GMV growth on
         fulfillment costs and SG&A

                                                                                      15.1%
         Infrastructure improvement
             -95bps in fulfillment costs                         13.3%

         Accelerated strategic IT investment
            -53bps in Tech&Content costs

         Stable marketing costs : +2bps                           1Q14                1Q15
            Selective investment in customer
            acquisition in Brazil
            Offset by the reduction in Cdiscount’s
            marketing costs
                                                       As a % of net sales and excl. new countries,
                                                       SG&A increased by -175bps in 1Q15 vs 1Q14
         G&A costs up -30bps                           As a % of GMV and excl. new countries, SG&A
           Related to higher holding and corporate     increased by 40 bps from -10.6% to -11.0%
           development expense

29
Fast growing development in new countries

30
Strong reduction in net financial expense

                                                               Net Financial Expense
     Strong reduction in net financial expense
                                                                        (€ million)

         Strong balance sheet, including IPO
         proceeds
                                                                15.0     - 64.3%
            From net debt of 135 M€ at the end of
            1Q14 to net cash of 71 M€ at the end of
            1Q15, representing +206 M€

                                                                                      5.4

         Financial expense management                           1Q14                  1Q15
            Reduction of average number of
            installments in Cnova Brazil sales (from
            9.2 in 1Q14 to 7.7 in 1Q15)
                                                       Strong reduction in net financial expense
                                                          Improvement of 17% to 12.5 M€, when
                                                          excluding 7.1 M€ in non-recurring accrued
                                                          interest on tax credit

31
Adjusted EPS reflecting increased investments

                                                                  Adjusted Net Earnings and Adjusted EPS

                                                                                                                              1Q 2014                       1Q 2015

                                            Adjusted Net Earnings
                                                                                                                                 -18.3                          -25.1
                                            (€ million, attributable to equity holders)

                                            Adjusted EPS (€)                                                                     -0.04                          -0.06

                                      In spite of increased gross margin excluding New Countries and
                                      considering higher SG&A costs to accelerate development, Adjusted Net
                                      Earnings decreased from -18.3 M€ in 1Q14 to -25.1 M€ in 1Q15.

     Note
32
     See Definitions and Non-GAAP Reconciliations sections of this presentation for additional information regarding certain of the metrics used in this page
Strong free cash flow generation leading to
         a net cash position of 71M€ at the end of 1Q15

                        Net cash / (net financial debt) position                                                                                  Operating working capital
                                                  (in € million)                                                                                                     (in € million)

                                                                                                                                                                                       38
                                                 +206 M€
                                                                                                                                                                21
                                                                                                                                                                                      386.1
                                                                   71

                                        1Q14
                                                                                                                                                           183.5
                                        1Q14                     1Q15

                                        -135                                                                                                               1Q14                       1Q15

                                                                                                                                        In number of days of sales

                  Net cash position increased by 206 M€ to 71 M€ at the                                                           Strong contribution to cash from effective
                  end of March 2015, vs. a net debt position of                                                                   management of working capital
                  -135 M€ at the end of 1Q14, mainly due to:
                                                                                                                                  Improvement of +17 days in number of days of sales
                      LTM Free cash flow of 28 M€ (vs -47 M€ in 1Q14)
                                At constant exchange rates, LTM Free Cash
                                Flow of 25 M€ at end of 1Q15 vs -67 M€ at the
                                end of 1Q14, representing an improvement of
                                + 92 M€
                      IPO proceeds of 125 M€
                      Reorganization benefit of 95 M€ in 2014
                      Other, including foreign exchange impact of -30 M€
                  1Q15 capex of 22 M€

     Note
33
     See Definitions and Non-GAAP Reconciliations sections of this presentation for additional information regarding certain of the metrics used in this page
2015 Outlook

       Cnova will continue to focus on delivering strong top-line growth while gradually
       improving profitability excluding new countries.
       Cnova’s 2015 priorities remain to:
         Continue the fast development of our marketplaces, leveraging Cnova’s traffic and direct
         sales
         Continue to leverage our low-cost business model to maintain our attractive price positioning
         Strengthen Cnova’s competitive advantages, including the click-and-collect network and
         strong m-commerce position
         Continue to broaden product assortment, particularly in the higher margin home products
         category
         Accelerate the development of specialty sites with four new sites to be launched in 2Q15
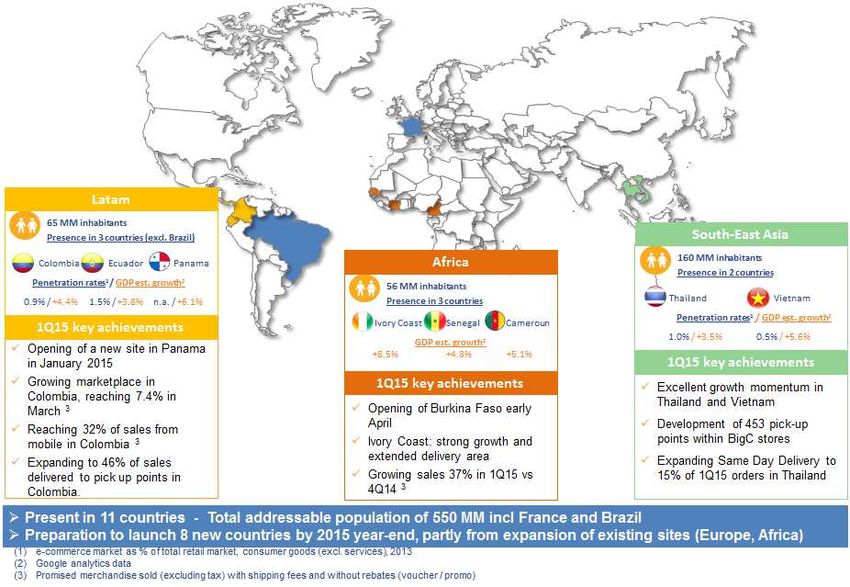
         Expand the international footprint, in eight new countries by year-end 2015, and
         Continue to generate strong free cash flow through effective working capital management

34
2015 Perspective

           Guidance :
                For the next 9M15 (April to December), Cnova net sales are expected to grow by 19%
                compared with the same period of 2014, within a plus or minus [150bps] deviation,
                assuming constant currency1.

     Note 1. This guidance is in a consolidated basis (Cdiscount Group + Cnova Brazil) and in “constant currency basis” i.e. assuming 2014 exchange rate.
35   (Euro/BRL exchange rate in 2Q14=3.06; 3Q14= 3.01 and 4Q14=3.18)
APPENDIX

     1. Definitions

     2. Non-GAAP Reconciliations

36
1. DEFINITIONS 1/2

       •   Active Customers – customers who have made at least one purchase through Cnova’s sites during the relevant 12-month
           measurement period ; provided that, because we operate multiple sites, each with unique systems of identifying users, we calculate
           active customers on a website-by-website basis, which may result in an individual being counted more than once.

       •   Adjusted EBITDA – calculated as Operating Profit (Loss) Before Other Expenses and before depreciation and amortization expense
           and share based payments. See “Non-GAAP Reconciliations” section for additional information.

       •   Adjusted EBITDA excluding expansion to new countries - calculated as Adjusted EBITDA excluding the impact related to countries
           with operations starting after January 1, 2014. See “Non-GAAP Reconciliations” section for additional information.

       •   Adjusted Net Profit – calculated as Net Profit (Loss) attributable to equity holders of Cnova before Other Expenses and the related tax
           impacts. See “Non-GAAP Reconciliations” section for additional information.

       •   Adjusted EPS or Adjusted Net Profit Per Share – calculated as Adjusted Net Profit divided by the weighted average number of
           ordinary shares outstanding during the applicable period. See “Non-GAAP Reconciliations” section for additional information.

       •   Free Cash Flow – net cash from operating activities less financial expenses paid in relation to factoring activities and less purchase of
           property and equipment and intangible assets. See “Non-GAAP Reconciliations” section for additional information.

       •   Gross Profit – net sales less cost of sales. See “Non-GAAP Reconciliations” section for additional information.

       •   Gross Margin – gross profit as a percentage of net sales. See “Non-GAAP Reconciliations” section for additional information.

       •   Gross Margin excluding expansion to new countries – calculated as Gross Margin excluding the impact related to countries with
           operations starting after January 1, 2014. See “Non-GAAP Reconciliations” section for additional information.

       •   Gross Merchandise Volume or “GMV” - comprised of our products sales, other revenues and marketplaces business volumes, after
           returns, including taxes.

37
1. DEFINITIONS 2/2

          •   Marketplace Share – marketplace business volumes as a percentage of total GMV over the quarter. For France, Marketplace Share of
              www.cdiscount.com GMV only. For Brazil, Marketplace Share of total Cnova Brazil GMV.

          •   Mobile Share of Traffic – share of traffic on mobile devices excluding specialty and international websites.

          •   Net Cash / (Net Financial Debt) – calculated as the sum of (i) cash and cash equivalents and (ii) the current account provided by
              Cnova or its subsidiaries to Casino pursuant to cash pool arrangements, less financial debt. See “Non-GAAP Reconciliations”section for
              additional information.

          •   Operating Profit Before Other Expenses – calculated as operating profit (loss) before restructuring, initial public offering expenses,
              litigation, gain/(loss) from disposal of non-current assets and impairment of assets.

          •   Operating Profit Before Other Expenses excluding expansion to New Countries – calculated as Operating Profit Before Other
              Expenses excluding the impact related to countries with operations starting after January 1, 2014. See “Non-GAAP Reconciliations”
              section for additional information.

          •   Other Expenses – calculated as the sum of restructuring, initial public offering expenses, litigation, gain/(loss) from disposal of non-
              current assets and impairment of assets.

          •   Operating Working Capital – calculated as trade payables less net trade receivables less net inventories.

          •   Placed Orders – total number of orders placed before cancellation due to fraud detection or lack of payment by customers.

          •   Product Offerings – total number of products offered to our customers across all of our sites, including all products offered by us
              directly and through our marketplaces.

          •   Unique Customer – customer who have purchased a least once over the considered period but counted as a single customer
              irrespective of the number of orders placed by that customer over the considered period.

38
2. NON-GAAP RECONCILIATIONS 1/7

       Gross Profit
       Gross Margin
       Gross Profit excluding expansion to new countries
       Gross Margin excluding expansion to new countries
       Gross Profit Post-Marketing Expenses

       Gross Profit is calculated as net sales less cost of sales. Gross Margin is gross profit as a percentage of net sales. Gross Profit and Gross
       Margin are included in this presentation because they are performance measures used by our management and board of directors to
       determine the commercial performance of our business. We have also included Gross Profit Excluding Expansion to New Countries and
       Gross Margin Excluding Expansion to New countries, which further excludes the net sales and costs of sales related to countries with
       operations starting after January 1, 2014. In addition, we provide Gross Profit Post-Marketing Expenses because it indicates that our growth
       in sales has been achieved with only limited marketing expenses.
       The following tables present a computation of Gross Profit, Gross Margin, Gross Profit Excluding Expansion to New countries, Gross Margin
       Excluding Expansion to New countries and Gross Profit Post-Marketing Expenses for each of the periods indicated:
                                                                                                         Q1           Q1
                                                                                                        March       March
                                               € thousands                                             31, 2014     31, 2015

                                               Net sales                                                777,396     915,470

                                                 Less Cost of sales                                    (681,166) (802,307)

                                               Gross Profit                                              96,230     113,163
                                                 Gross Margin                                             12.4%       12.4%

                                                 Less Net sales from Expansion to New Countries                 -    (8,696)
                                                 Plus costs of sales from Expansion to New Countries           -       9,400

                                               Gross Profit Excluding Expansion to New Countries         96,230     113,867
                                                 Gross Margin Excluding Expansion to New Countries        12.4%       12.6%
                                                                                                          Q1          Q1
                                                                                                        March       March
                                               € thousands                                             31, 2014     31, 2015

                                               Gross Profit                                              96,230     113,163

                                                 Less Marketing expenses                                (16,905)    (20,747)

                                               Gross Profit post-marketing expenses                      79,325      92,416

39
2. NON-GAAP RECONCILIATIONS 2/7

        Adjusted EBITDA
        Adjusted EBITDA excluding expansion to new countries

        Adjusted EBITDA is calculated as operating profit (loss) before restructuring, initial public offering expenses, litigation, gain/(loss) from
        disposal of non current assets and impairment of assets and before depreciation and amortization expense and share based payment. We
        have also included Adjusted EBITDA Excluding Expansion to New Countries, which further excludes the adjusted EBITDA related to
        countries with operations starting after January 1, 2014. We have provided a reconciliation below of these measures to operating profit (loss)
        before restructuring, initial public offering expenses, litigation, gain/(loss) from disposal of non current assets and impairment of assets, the
        most directly comparable GAAP financial measure.
        We have included Adjusted EBITDA and Adjusted EBITDA Excluding Expansion to New Countries in this presentation because they are key
        measures used by our management and board of directors to evaluate our operating performance, generate future operating plans and
        make strategic decisions regarding the allocation of capital. In particular, the exclusion of certain expenses in calculating Adjusted EBITDA
        facilitates operating performance comparisons on a period to period basis. In the case of exclusion of the impact of stock based
        compensation, it excludes an item that we do not consider to be indicative of our core operating performance. In the case of exclusion of
        expansion to new countries, it excludes activities that are still in an early development stage since having only launched in 2014.
        The following table reflects the reconciliation of operating profit (loss) before restructuring litigation, initial public offering expenses,
        gain/(loss) from disposal of non currents assets and impairment of assets to Adjusted EBITDA and Adjusted EBITDA Excluding Expansion
        to New Countries for each of the periods indicated:                                                       Q1        Q1
                                                                                                                                       March       March
                                                                                                                                        31,         31,
                              € thousands                                                                                              2014        2015
                              Operating profit before restructuring, litigation, gain/(loss) from disposal of non-current assets and
                                                                                                                                       (7,409)     (28,020)
                              impairment of assets

                                Excluding Share based payment expenses                                                                    127          196
                                Excluding Depreciation and amortization                                                                 5,836        9,662

                              Adjusted EBITDA                                                                                          (1,446)     (18,162)

                                Excluding Expansion to New Countries                                                                           -     4,963

                              Adjusting EBITDA Excluding Expansion to New Countries                                                    (1,446)     (13,199)

40
2. NON-GAAP RECONCILIATIONS 3/7

       Operating Profit Before Other Expenses excluding expansion to new countries
       Operating Profit Before Other Expenses Excluding Expansion to New Countries and Net of Factoring Costs

       Operating Profit Before Other Expenses Excluding Expansion to New Countries is calculated as operating profit (loss) before restructuring,
       initial public offering expenses, litigation, gain/(loss) from disposal of non current assets and impairment of assets and excluding the impact
       related to countries with operations starting after January 1, 2014. Operating Profit Before Other Expenses Excluding Expansion to New
       Countries and Net of Factoring Costs further excludes the factoring costs incurred by the Company in discounting sales receivable. We
       have provided a reconciliation below of these two measures to operating profit (loss) before restructuring, initial public offering expenses,
       litigation, gain/(loss) from disposal of non current assets and impairment of assets, the most directly comparable GAAP financial measure.
       These non-GAAP measures are used by Cnova’s management and board of directors to gain a better understanding of the profitability of
       Cnova before the impact of expansion to new countries, which are still in their early stages of development, and before factoring costs,
       which are financial expenses specific to the discount of receivables related to sales.
       The following table reflects the reconciliation of operating profit (loss) before restructuring litigation, initial public offering expenses,
       gain/(loss) from disposal of non currents assets and impairment of assets to Operating Profit Before Other Expenses Excluding Expansion to
       New Countries and to Operating Profit Before Other Expenses Excluding Expansion to New Countries and Net of Factoring Costs for each
       of the periods indicated:
                                                                                                                                         Q1         Q1
                                                                                                                                       March       March
                                                                                                                                        31,         31,
                              € thousands                                                                                              2014        2015
                              Operating profit before restructuring, litigation, gain/(loss) from disposal of non-current assets and
                                                                                                                                        (7,409) (28,020)
                              impairment of assets

                                Excluding Expansion from new countries                                                                         -    5,141

                              Operating profit before other expenses and excluding expansion from new countries                         (7,409) (22,879)

                                Less financial expenses in relation to factoring activities                                            (12,777) (16,630)

                              Operating profit before other expenses and net of factoring costs excluding expansion from new
                              countries                                                                                                (20,187) (39,509)

41
2. NON-GAAP RECONCILIATIONS 4/7

        Adjusted Net Profit/(Loss) Attributable to Equity Holders of Cnova
        Adjusted EPS

        Adjusted Net Profit/(Loss) Attributable to Equity Holders of Cnova is calculated as net profit/(loss) attributable to equity holders of Cnova
        before restructuring, initial public offering expenses, litigation, gain/(loss) from disposal of non current assets and impairment of assets and
        the related tax impacts. Adjusted EPS is calculated as Adjusted Net Profit/(Loss) Attributable to Equity Holders of Cnova divided by the
        weighted average number of outstanding ordinary shares of Cnova during the applicable period. We have provided a reconciliation below of
        Adjusted Net Profit/(Loss) Attributable to Equity Holders of Cnova to net profit/(loss) attributable to equity holders of Cnova, the most directly
        comparable GAAP financial measure.

        Adjusted Net Profit/(Loss) Attributable to Equity Holders of Cnova is a financial measure used by Cnova’s management and board of
        directors to evaluate the overall financial performance of the business. In particular, the exclusion of certain expenses in calculating
        Adjusted Net Profit/(Loss) Attributable to Equity Holders of Cnova facilitates the comparison of income on a period-to-period basis.

        The following table reflects the reconciliation of net profit/(loss) attributable to equity holders of Cnova to Adjusted Net Profit/(Loss)
        Attributable to Equity Holders of Cnova and presents the computation of Adjusted EPS for each of the periods indicated.
                                                                                                                    Q1             Q1
                                                                                                                   March         March
                                          € thousands                                                             31, 2014       31, 2015

                                          Net Profit (Loss) (attributable to equity holders of Cnova)               (18,339)      (37,610)

                                              Excluding restructuring expenses                                             16        4,314
                                              Excluding litigation expenses                                                  -          590
                                              Excluding initial public offering expenses                                     -       3,535
                                              Excluding gain / (loss) from disposal of non-current assets                    -          277
                                              Excluding impairment of assets charges                                         -       5,425
                                              Excluding income tax effect on above adjustments                           (6)       (1,109)
                                              Excluding recognition of previously unrecognized tax losses                    -              -
                                              Excluding minority interest effect on above adjustments                        0       (563)

                                          Adjusted Net Profit (Loss) (attributable to equity holders of Cnova)      (18,328)      (25,141)
                                          Weighted average number of ordinary shares                             411,455,569 441,297,846
                                          Adjusted EPS (€)                                                            (0.04)        (0.06)

42
2. NON-GAAP RECONCILIATIONS 5/7

        Free Cash Flow

        Free Cash Flow is calculated as net cash provided (used) by operating activities as presented in our cash flow statement less capital
        expenditures (purchases of intangible assets and property and equipment) and less the financial expense paid in relation to factoring
        activities.
        We have provided below a reconciliation of free cash flow to net cash (used in) from operating activities, the most directly comparable GAAP
        financial measure.
        The following table presents a computation of Free Cash Flow for each of the periods indicated:

                                                                                                           Q1         Q1
                                                                                                         March      March
                                                                                                         31, 2014   31, 2015

                                   Net cash flow from operating activities                              (286,505) (393,630)
                                   Less financial expenses paid in relation to factoring activities      (12,777)   (16,630)
                                   Less purchase of property and equipment and intangibles assets        (12,808)   (22,464)
                                   Free cash flow                                                       (312,089) (432,724)

        The following table presents a computation of Free Cash Flow for each of the twelve months periods ended at the indicated dates:

                                                                                                         March      March
                                                                                                         31, 2014   31, 2015

                                   Net cash flow from operating activities                                55,107    177,874
                                   Less financial expenses paid in relation to factoring activities      (48,268)   (63,937)
                                   Less purchase of property and equipment and intangibles assets        (53,907)   (86,297)
                                   Free cash flow (last twelve months)                                   (47,067)    27,639

43
2. NON-GAAP RECONCILIATIONS 6/7

       Net Cash/(Net Financial Debt)

       Net Cash/(Net Financial Debt) is calculated as the sum of (i) cash and cash equivalents and (ii) cash pool balances held in arrangements
       with Casino Group and presented in other current assets, less financial debt.
       Net Cash/(Net Financial Debt) is a measure that provides useful information to management and investors to evaluate our cash and cash
       equivalents and debt levels and our current account position, taking into consideration the cash pool arrangements in place among certain
       members of the Casino Group, and therefore assists investors and others in understanding our cash position and liquidity.
       The following table presents a computation of Net Cash/(Net Financial Debt) for each of the periods indicated:

                                                                                                            Q1         Q1
                                                                                                          March      March

                                                                                                         31, 2014    31, 2015
                                 € thousands
                                   Cash and cash equivalents                                               33,603    344,809
                                   Cash pool balances with Casino presented in other current assets         5,094            -
                                   Less current financial debt                                           (167,676) (264,414)
                                   Less non-current financial debt                                         (6,182)    (9,640)

                                 Net Cash (Net Financial Debt)                                           (135,162)    70,755

44
2. NON-GAAP RECONCILIATIONS 7/7

       Operating Working Capital

       Operating Working Capital is calculated as trade payables less net trade receivables less net inventories. We have provided a reconciliation
       below of Operating Working Capital to trade payables, net trade receivables and net inventories, the most directly comparable GAAP
       financial measures.
       Operating Working Capital is a financial measure used by Cnova’s management and board of directors to evaluate the cash generation of
       the business. In particular, the comparison of the Operating Working Capital on a period-to-period basis takes into account our business
       seasonality.
       The following table reflects the reconciliation of Operating Working Capital for each of the periods indicated.

                                                                                                                           Q1          Q1
                                                                                                                          March      March
                              € thousands                                                                                31, 2014    31, 2015

                                Trade payables                                                                            623,323 1,023,027
                                Trade receivables, net                                                                    (75,552) (153,383)
                                Inventories, net                                                                         (364,264) (483,522)

                              Operating Working Capital                                                                   183,506    386,122
                                In days of Net Sales (calculated over 1Q14 and 1Q15 Net Sales and 90 days per quarter)          21          38

45
DISCLAIMER

 IMPORTANT:

 This document, the oral presentation of the information in this document by Cnova N.V. (the “Company”) or any person on behalf of the Company, and any question-and-
 answer session that follows the oral presentation (collectively, the “Information”) contain forward-looking statements. All statements other than statements of historical fact
 included in the Information are forward-looking statements. Forward-looking statements give the Company’s current expectations and projections relating to its financial
 condition, results of operations, plans, objectives, future performance and business. These statements may include, without limitation, any statements preceded by, followed
 by or including words such as “target,” “believe,” “expect,” “aim,” “intend,” “may,” “anticipate,” “estimate,” “plan,” “project,” “will,” “can have,” “likely,” “should,” “would,” “could”
 and other words and terms of similar meaning or the negative thereof. Such forward-looking statements involve known and unknown risks, uncertainties and other important
 factors beyond the Company’s control that could cause the Company’s actual results, performance or achievements to be materially different from the expected results,
 performance or achievements expressed or implied by such forward-looking statements. Such forward-looking statements are based on numerous assumptions regarding
 the Company’s present and future business strategies and the environment in which it will operate in the future.

 This document contains a discussion of various non-GAAP measures, including Gross Margin, Gross Margin Post-Marketing Expenses, Adjusted EBITDA, Free Cash Flow
 and Net Financial Debt. These measures as calculated by the Company and as presented in this document may differ materially from similarly titled measures reported by
 other companies due to differences in the way these measures are calculated. These measures have important limitations as analytical tools and should not be considered
 in isolation from, or as a substitute for an analysis of, the Company’s operating results as reported under IFRS. A reconciliation of non-GAAP measures to GAAP financial
 measures is included as an appendix to this presentation.
You can also read