Investor Presentation - Technology for Everyone - Npg
←
→
Page content transcription
If your browser does not render page correctly, please read the page content below

Technology for Everyone
                                            v13

                          Investor Presentation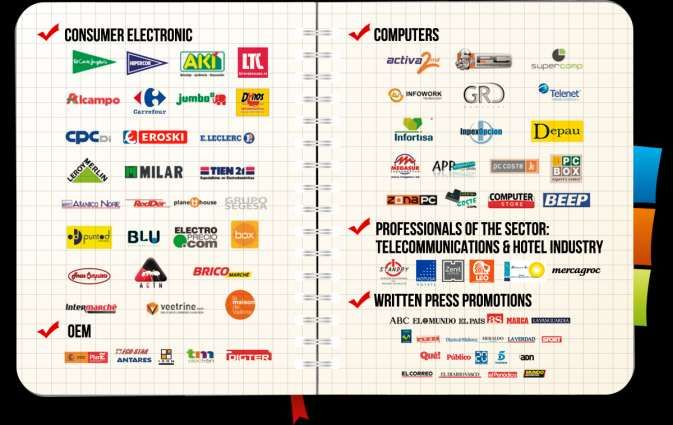
About Us
•   Mr. Enrique Cosío is a Technical Communications Engineer with 35 years’ experience in the world of electronics.
•   1989: He started the import and distribution of electronic components of American and Asian brands (currently,
    market leaders) in Spain. This earned him many contacts and technological alliances, which are still kept today
    and which were key in the development of the telecommunications sector in Spain and Latin America.
•   1996: Mr. Cosío set up NPG and together with an American-Chinese multinational, they have been opening offices
    in Spain, France, Portugal, Germany and Italy and have become the main shareholder in Europe.
•   1997 y 1998: NPG led the Telecommunications Sector (Modem Fax), being number 1 in sales in Spain,
    Portugal and number 3 in France.

•   1998: Together with Telefónica, as hardware provider (modem), NPG played an important role in the development
    of ADSL and Terra.
•   2002: Mr. Cosío began his solo journey heading NPG.
•   2009 - 2011: Number 1 in DTT receivers sales in Spain.
•   NPG was the major supplier for the DTT receivers sold to the Public Administration.
•   2011: NPG entered the world of LCD and LED television by opening its assembly plant in Torrejón de Ardoz
    (Madrid).
•   2012: NPG started up a new production plant and R+D Department in China.
•   Currently, NPG’s sales network operates in Europe, Latin America and China, with headquarters in Spain,
    Colombia and Canton.
•   152 people work permanently and up to 300 people occasionally in the NPG Group.

                                                                                                                  Page 1
                                                                                 Technology for everyone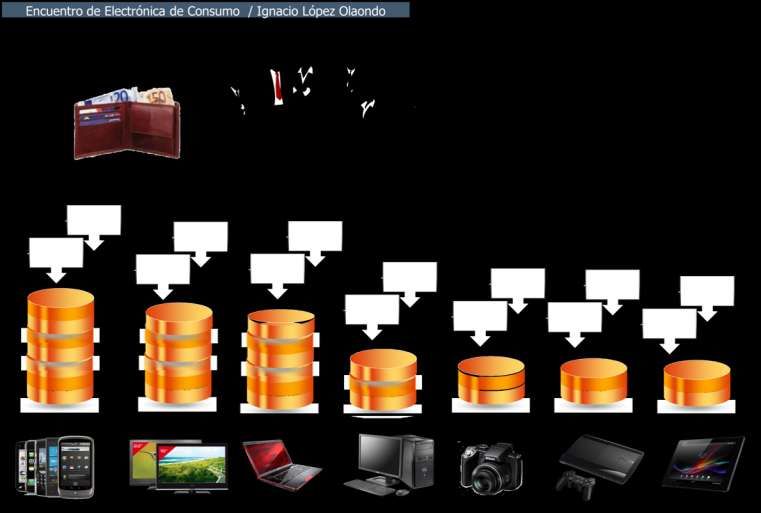
Alliances

Technological Alliances
We keep strong alliances with the main Chipset and Software Multinationals

Licences
                                                                              DOLBY
                                                                                (in process)
                                               (Previously Philips)

Standards and Respect for the environment
We comply with all international standards and certification requirements

                                                                                               Page 2
                                                                      Technology for everyone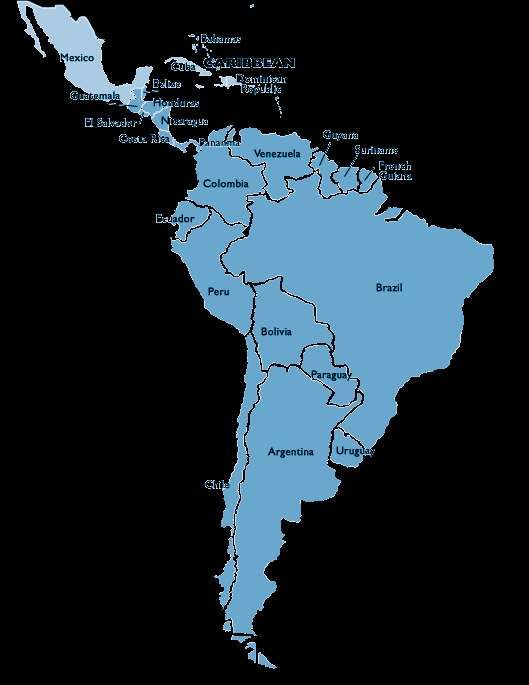
NPG Shareholding Structure

          Before Investment                                              After Investment
                                                                           (* Approximate Values)

                                                                         25%

                                                                                                          38%
      49%
                                    51%

                                                                               37%

        DFC Group      Inversiones Norcen                             DFC Group      Inversiones Norcen    MAB

•   Both DFC Group BVBA and Inversiones Norcen S.L. are 100% controlled by Mr. Enrique Cosío

                                                                                                                 Page 3
                                                                                  Technology for everyone
Competitive Advantages

•   NPG, leader and first manufacturer of Smart TV powered by Android
•   The NPG Smart TV is customizable and adaptable to any customer and market
•   Thousands of Android free apps for your TV
•   Smart TV is being the trend for the next years
•   The only Spanish manufacturer with its own R+D Department and 15 engineers (over 10% of the
    staff)
•   The only Spanish company with its own factories in China (Zhongshan) and Spain (Madrid),
    designed according to the Japanese standards and production control.
•   Local representation and after-sales service

                              With the NPG Smart TV you will have:

          The best of TV          The best of Internet

                                                                                                  Page 4
                                                                     Technology for everyone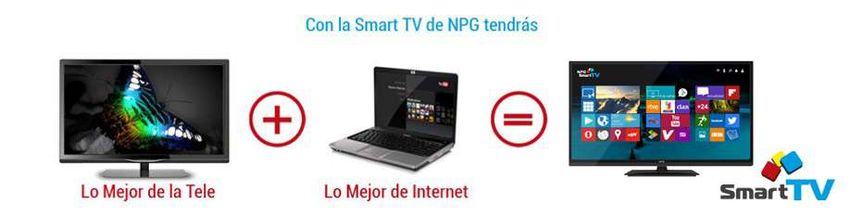
Where We Are?
DFC Portugal DFC France
Commercial Branch Commercial Branch
NPG China (Asia)
Marketing and Sales
Engineering (R+D)
Factory
Total surface 1,810m2
Production capacity 120,000 units/month
Employees: 100
In the pipeline:
NPG Spain Headquarters (Europe) Assembly line SMT with two state of the art
Marketing and Sales lines
Engineering (R+D) Start-up of the TFT LED Panels assembly
Technical Department and Call Centre line, based on OPEN CELL
Factory
Total surface 6,690m2
Production capacity 90,000 units/month
Employees 60 – 110
Stocking capacity 1,330 pallets
Page 5
Technology for everyone
We Deal Mainly with Highly Demanded Products

LED TV / Smart TV /             Smart TV Box                      Tablets and
    Plasma TV                                                     Smartphones

                                                                      Sound and
DTT Players            Portable DVD            Multimedia            Home Cinema
                          and TV

                                                                                   Page 6
                                                            Technology for everyone
Low Concentration and a Diversified Portfolio of Clients

                                                                                      Top 10 Ranking Clients 2011-13
                                                                                              Nombre              %
                                                                                   El Corte Inglés, S.A.         18,85
                                                                                   Ticnova Quality Team S.L.     10,95
                                                                                   Alcampo S.A.                   9,85
                                                                                   Telecor S.A.                   5,56
                                                                                   Alcampo Portugal               3,60
                                                                                   Bricodis S.A. (AKI)            2,55
                                                                                   Informática Megasur, S. L.     1,60
                                                                                   Carrefour S.A                  1,52
                                                                                   Bcm-bricolage S.A.             1,31
                                                                                   Leroy Merlin S.L.U.            1,23

                                                                                    Evolución Cartera Clientes 2011-13
                                                                                     Año        Cartera Clientes
                                                                                    2010           243 Clients
                                                                                    2011           292 Clients
                                                                                    2012           271 Clients
                                                                                    2013           284 Clients

  • Average payment period – 45 days from date of invoice
  • Overdue payment 0% - credit sales are guaranteed. If the riks is not covered by the insurance company,
    sales are pre-paid.

                                                                                                                 Page 7
                                                                            Technology for everyone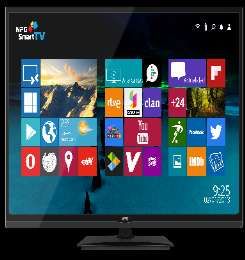
NPG in Mass Media

Press Promotions                                                                 Other Media
Average of daily readers: more than 250.000                                 Computers Magazines
people see our adverts
We have the leadership in promotions that Spanish                            Computers Journals
written press launches for its readers.
Reasons:
     Competitive price.
                                                             Telecommunications Sector Magazines
     Quality. It’s critical for the newspaper thereby it’s
     way of build loyalty and not a way of making money
     (the low quality products and services generates
     complaints).                                                   Consumer Electronics Journals
     Spanish publishing groups are potential distributors
     of NPG products in Latin America

                                                                                              Page 8
                                                                 Technology for everyone
We were leaders of the Spanish Analog Switchover – Sales Evolution
20
18
DTT sales evolution of the main manufacturers 2008 2009
16 (M€) (Total/DTT) (Total/DTT)
Personal Grand Technology (NPG) 6.98 5.6 19 17.5
14 Engel Axill 37.44 9.3 56 16.7
12 Philips Ibérica (Consumption and Lifestyle) 445 15.3 254 15.2
Gigaset Communications Iberia (Siemens-Gigaset) 34 15.4 42 12.8
10 Worldwide Sales Corporation (Best Buy) 16.32 6.14 27 12.11
Afax Suns (Sunstech) 28.15 5.6 26 8.1
8 Analog
Switchover Blusens Global Corporation 70 10.5 100 5.9
Million €
6 in Spain Lineas Omenex Metronic (Metronic) 7.07 5.2 9 4.2
Nevir 19.8 1.56 20 3.76
4
Fagor Electrónica 56 2.8 50 2.5
2 Infinity Sistem (Airis) 250 1.46 250 1.67
Televés (Consumption Devision) 105.63 1.68 95.7 1.5
0
Sanyo 45 2.9 11.3 0.7
2005 2006 2007 2008 2009 2010 2011 2012
Hauppauge 4.2 0.5 4 0.5
Grupo ETCO (Fersey) 7.5 0.3 7.8 0.3
Dexxon Spain 4 0.2 3.5 0.17
Page 9
Technology for everyoneSales Mix Evolution
Our company’s breakthrough was made
possible by taking advantage of the
100% Analog switchover in Spain.
We enter the TV segment immediately.
The result:
% over the sales in €
50% Doubled turnover comparing to 2008.
Entered a larger market segment and
more stable in the medium and long term.
We repeated our commercial strategy
successfully during the Analog switchover
0%
in Portugal.
2009 2010 2011 2012
OTHERS 16" - 24" TV 26" - 40" TV Portable TV DTT Receivers
Page 10
Technology for everyoneOur Commercial Strategy – We Have Successfully
Implemented It in Portugal
The Analog switchover started on April of 2009 and was
completed on April of 2012.
We entered the market with DTT receivers and TVs,
simultaneously.
In 2012 we changed
2,5
the sales mix and
experienced a sales
2
Sales in MM €
growth of 8%
1,5
* There is an important difference
1 between Portugal and Spain: in Portugal
the pay television covers a 30% of the
0,5 market and it keeps on continuously
growing. It is more similar to Latin
0 America than Spain.
2011 2012
DTT Receivers TV Others
Page 11
Technology for everyoneProfitability by Sector – Products
EBITDA Sectors 2011-2013 Margin by Product Range
GROSS
NAME MARGIN
14,00% Smart-multimedia 18.09%
12,00% 12.17% TABLET PC 21.54%
10,00%
SOUND BAR 13.29%
8,00% 8.54% TV (16" - 24“) 13.75%
7.23%
TV (29" - 40“) 12.89%
6,00%
SMART TV 17.97%
4,00%
PORTABLE TV 20.55%
2,00%
DTT – SD 18.10%
0,00%
Consumer DTT - HD 9.79%
Press Computers
Electronics Promotions MULTIMEDIA 20.02%
Page 12
Technology for everyoneOur Competitors
They aren’t the big brands
In Spain, LG, Samsung, Sony and Panasonic share a 73,3% of the TV
market
Besides them, there are plenty of competitors (Nevir, Thompson, Grundig,
Blaupunkt, Haier, I-Joy, Hisense, Toshiba…) who, at the most, cover a 2%
of the market. NPG is competing with them, successfully: we are growing
in a shrinking market.
Market validation in Spain, considering that it reached the bottom and it
rounds about 1.300 millions of euros and 3,3 millions of devices.
Evolución del mercado de TV en España (millones de €) Evolución ventas TV de NPG (miles de €)
3.000 10.000
2.500 9.000
8.000
2.000
7.000
1.500 6.000
5.000
1.000
4.000
500 3.000
2.000
0
1.000
0
Fuente: Gfk Forecast Diciembre 2013 2009 2010 2011 2012
CRT LCD PDP
Page 13
Technology for everyoneGlobal Market Data
100% Technological Expense in Spain,
2013:
• 82% Hardware (TV, Phones, Computers, etc.
2012 23% • 18% Software
13% 13%
2013 33%
14% 13% 6% 4% 4% 4%
8% 7% 4% 3%
Source: Gfk Forecast December 2013
Page 14
Technology for everyonePTV/FLAT LCD Units PTV/FLAT LCD Sales Units %
Brands segmentation 18-23,9”
TV SALES IN 2013 TV 18" – 24’’ SALES IN 2013
LG NPG OKI PANASONIC LG NPG OKI PHILIPS SAMSUNG OTHERS
PHILIPS SAMSUNG SONY OTHERS
27.10%
17.90%
30.60% 28.30%
4.10%
3.70%
1.00%
4.10%
5.20%
29.50% 27.40% 8.30%
4.80%
8.00%
Actors have been disappearing off: NPG gets to hold a larger market share - 1%. The small local brands hold a 25% of the small inches market (18’’-
There is a real possibility of reaching a 5% depending on the liquidity and 24”) from which, NPG has a 3,7%.
considering that we count on,
• Real market demand
• Innovating product with emerging perspectives
• New customers input (Worten, Darty Group, Mediamarkt, etc.)
Adapted charts based on Gfk Forecast Diecember 2013
Page 15
Technology for everyonePTV/FLAT Spain December 2013 PTV/FLAT Spain December 2013
Smart TV Sales Units % Smart TV Sales Units %
SMART TV SALES IN 2013 IT CHANNEL
SMART TV SALES IN 2013 LG NPG SAMSUNG OTHERS
LG NPG SAMSUNG SONY PHILIPS PANASONIC OTHERS
2.40%
11.70%
8.19%
39.60%
4.80%
21.40%
7.00%
54.20%
32.30% 16.21%
2.20%
With Smart TV, NPG places itself among the first five brands holding a 2,2% of share market and operating a very strong penetration (16%)
on the IT channel.
Adapted charts based on Gfk Forecast Diecember 2013
Page 16
Technology for everyonePTV/FLAT Smart TV December 2013
18”-23,9” Sales Units %
SMART TV SALES EVOLUTION OF SMART TV
18" - 24" SALES IN 2013 18" - 24" IN 2013
SAMSUNG NPG OKI PHILIPS OTHERS SAMSUNG NPG OTHERS
5.30% 9.10% 2.90% 1.00% 4.90% 3.20%
3.00% 2.50%
60.70% 55.70% 24.50% 29.10%
22.00%
90.90%
70.60% 67.70%
36.40% 43.30%
67.20%
JAN-AGO 13 SEPT 13 OCT 13 NOV 13 DEC 13
Smart technology is gaining ground on the market (33.2%). Small inch NPG launched onto the Smart TV market in September, 2013. The fourth trimester of
Smart TV represents a 4%, shared by Samsung and NPG, where NPG holds the year, looses it temporarily , due to the stand-by produced by the flotation on the
a 22%. MAB, foreseen for December. The first trimester of 2014, NPG regains the lost market.
Adapted charts based on Gfk Forecast Diecember 2013
Page 17
Technology for everyoneSET-TOP-BOXES BRANDS SEGMENTATION December 2013
Sales Value %
SET TOP BOXES SALES IN 2013
AXIL NPG ENERGY SIST BEST BUY NEVIR SUNSTECH ENGEL OTHERS
9.90%
11.10%
35.40%
7.70%
22.60%
2.60%
4.90% 5.80%
NPG helds an 11% market share within a stable replacement market of 1 million devices.
Adapted charts based on Gfk Forecast Diecember 2013
Page 18
Technology for everyoneDevelopment Project
Page 19
Technology for everyoneGeneral Information of Interest
The entire Latin America is currently in process to switchover to digital
technology for TV within the next few years by Government imperative.
As indicated in the attached table, in 2017, about 95 million households will THE ANALOG
SWITCHOVER IN LATIN
have access to DTT and will have switched over to digital TV.
AMERICA
The sale of consumer electronics products in the emergent countries (China,
2015 Mexico, Uruguay
India and Latin America) went from 37% of the world total to 46%, in 2012.
(Gfk for CES 2012). 2016 Brasil
The receivers market will be very important because the DTT target market 2017 Chile
in Latin America is a segment of population, mainly out of the consumer credit 2018 El Salvador
system and whose incomes barely cover their basic expenses (Source: Horacio 2019 Colombia, Venezuela
Gennari; CEO Business Bureau; 2012). Argentina, Peru,
2020
According to GFK, HD televisions are the second most popular electronic Bolivia, Ecuador
product. 2021 Panama, Honduras
Latin America Spain Portugal1
Population 577 45 11
Households nº 156 16 4
NPG sales with the analog switchover ? 38 7
Sales / Households nº ? 2,375 1,75
Figures in millions
1 Sales in Portugal include forecast from 2013
Switchover year + previous and next
Page 20
Technology for everybodyAnalog Switchover – a Business Opportunity
Comparative chart among implementation periods in Spain and LATAM
Press DDT press = 1,155,000 units (NPG share = 70 %) * Spain population 46 M/Inhab.
DDT sales through all channels = 17,780,000 units (NPG share = 13%)
PRESS NPG SHARE RETAIL ANALOG
SWITCHOVER
Thousands
5500
MAY 2010
5,570,000
5000
4500
4,200,000
4000 MEXICO 2015
ECUADOR 2017 URUGUAY 2015
CHILE 2017
3500
PUERTO RICO 2017
3000 VENEZUELA 2020 BRASIL 2016
PERU 2020
COLOMBIA 2019 2,450,000
2500 ARGENTINA 2019
COSTA RICA 2018 2,050,000
2000
1,545,000
1500
800,000 22%
1000
12.4
5.9% 435,00 %
500 5.5% 200,000 16
150,000 5% % 200,000 180,000
0
Year Spain
2005 2006 2007 2008 2009 2010
Page 21
Technology for everyoneLATAM: Operations Structure and
Head Office in Colombia
Assembly and
distribution of the
PURCHASE and final product
elements
assembly
R+D
• Concept
• Provider
selection
Why choose Colombia?
Strategic position in the continent.
Key element in the Pacific Pact
Stable economy and costs-competitive
Page 22
Technology for everybodyLATAM: Implementation Plan in Colombia
Flotation on MAB and Capital increase, funds release.
Right after, the machinery orders are confirmed to the Chinese supplier and
the implementation of the Factory in Colombia, city of Calí, is put into
operation
The pre-contracts agreed with GDA are signed.
The production belonging to GDA initial promotions is started.
Three months later, once the Factory setup is finished, the assembly line
workers are hired, for their training.
Within less than 4 months the factory and the business in LATAM is
completely settled and fully functioning.
Page 23
Technology for everybodyColombia Factory Setup
Gantt diagram – Colombia NPG factory
Page 24
Technology for everyoneBusiness Plan – Guidance Notes
An estimation of the potential market has been made
considering what the NPG structure is able to take over. NPG GROUP PROFIT AND LOSS ACOUNT
(in thousands of €)
We will operate a light market penetration in countries
where there is no Factory. Turnover 2014 2015 2016
NPG Europe 19,150 22,901 25,653
We estimate there are three kinds of countries depending
NPG Colombia / Latam 22,581 39,696 56,473
on their interest/difficulty/risks/position.
NPG China 4,000 4,200 4,410
China is considered almost residual, and reserved to
The Group turnover 45,731 66,797 86,536
future stages of growth.
EBITDA 4,465 7,580 10,298
LATAM business is shaped by three families of products,
Financial Costs -1,174 -1,654 -2,097
targeting the 2nd , 3rd and 4th sections of the middle Depreciation -508 € -574 -619
class. BAI 2,783 5,352 7,582
There are two main sales channels: Taxes -1,047 -2,144 -3,100
1. GDA (media groups). There are already pre-sales in Net Result 1,737 3,208 4,482
process.
2. Larges shopping areas and retail chains.
Page 25
Technology for everybodyBusiness Plan – Guidance Notes
The financial plan considers that:
a) The capital increase through the MAB will provide to Colombia business, current assets
and OPEX.
b) The current assents are structured by days of sales and days of purchasing. There is
bank financing only for 30 days of sailings and 30 days of purchasing.
c) We intend to be cautious and work with an operating cash-flow for about 10-13 days of
payments.
d) We estimate that the needs for CAPEX and OPEX, will be properly covered.
Page 26
Technology for everyoneLATAM Sales Prospects
In order to support its sales objective, NPG has signed pre-agreements with the Group Editorial
GDA for at least 4 from the 8 technology advertising projects on the main newspapers from
Colombia, Ecuador, Peru and Chile, with a total amount of between 17 and 22 Millions of USD
We already have a commercial office in Colombia for all the Latin America from which we are
contacting with the main local groups of large shopping areas (Éxito Group, Alkosto, Fallabella, etc.)
and also with large distribution platforms in Colombia and the rest of Latin American countries.
A Market Survey has been done (by the Royal Media Group) during a university event in Bogota –
163 surveys – and in Cajica (20km from Bogota) - 995 surveys – about the Smart TV from NPG
(according to social status: 2, 3 y 4). The result:
• 54% of the families would buy our television and agree with the established price.
• 87% % of the students would buy our television although, as imagined, young people would pay a
little less.
• When it comes of purchasing a TV set, the brand affects the final decision in only 35% of cases.
And now, we detail the origin of the funds and the forecast of the current assets cycle.
Page 27
Technology for everyoneProspects Consolidated Sales
LATAM EUROPE - CHINA CONSOLIDATED
2. CURRENT ASSETS 2. CURRENT ASSETS 2. CURRENT ASSETS
1. FUNDS ORIGIN CYCLE 1. FUNDS ORIGIN CYCLE 1. FUNDS ORIGIN CYCLE
Cap. Increase 5.5 MM € Figures in thousands of € Exsitencias 5.5 MM € Figures in thousands of € Exsitencias 5.5 MM € Figures in thousands of €
Extern. financ. 0.75 MM € Gross margin 15% Extern. financ. 1.00 MM € Gross margin 15% Cap. Increase 5.5 MM € Gross margin 15%
Total Funds 6.25 MM € Net margin 3.8% Total Funds 6.50 MM € Net margin 3.8% Extern. financ. 1.75 MM € Net margin 3.8%
Total Funds 12.75 MM €
Out China To the Sale to Out China To the Sale to Out China To the Sale to
stock New PO 30% 70% Factory customer stock New PO 30% 70% Factory customer stock New PO 30% 70% Factory customer
Q1 6,250 1,875 6,500 1,950 12,750 3,825
Jan.
Q2
Q1
Feb.
Q2 4,375 4,550 8,925
Q1
Mar.
Q2
Q1 6,488 1,946 7,188 6,747 2,024 7,475 13,235 3,970 14,663
Apr.
Q2
Q1
May.
Q2 4,541 4,723 9,264
Q1
Jun.
Q2
Q1 6,734 2,020 7,461 7,003 2,101 7,759 13,737 4,121 15,220
Jul.
Q2
Q1
Ago.
Q2 4,714 4,902 9,616
Q1
Sep.
Q2
Q1 6,990 2,097 7,744 7,270 2,181 8,054 14,259 4,278 15,798
Oct.
Q2
Q1
Nov.
Q2 4,893 5,089 9,982
Q1
Dic.
Q2
TOTAL SALES LATAM 22,392 TOTAL SALES IN EUROPE-CHINA 23,288 TOTAL CONSOLIDATED SALES 45,680
TOTAL SALES 45.68 Millions of €
Page 28
Technology for everyoneThe Factory in China
FIRST STAGE:
Competitive Advantages:
Embracing the manufacture of main boards and panels Open-Cell, brings a savings of 8%:
3% for the investment depreciation
5% net savings, charged to the income statement of the Group.
SECOND STAGE:
Commercial expansion: 1º
It will be done in two stages (2015).
We will position on the market as
an European brand. 4º
3º
5º
2º
Page 29
Technology for everyoneAnnual Accounts 2009 - 2013
Overall balance sheet: 2009 - 2013 Profit and loss: 2009 - 2013
DEFINITION TAX YEAR DEFINITION TAX YEAR
ASSETS 2009 2010 2011 2012 2013
PROFIT AND LOSS ACCOUNT 2009 2010 2011 2012 2013
A) NON CURRENT ASSETS 712 1,846 2,423 4,050 5,624
Fixed assets 674 1,816 2,363 2,753 4,515 Turnover 19,039 12,169 14,363 14,415 13,575
Intangible assets and other assets* 38 30 59 1,296 1,109
Purchases 15,182 8,717 9,505 9,431 9,389
B) CURRENT ASSETS 4,478 5,143 7,212 7,167 7,496
Inventories 1,462 2,943 4,061 2,944 5,286 Personnel expenses 518 559 640 776 1,092
Operating expenses (Advertising and
Trade and other receivables 2,592 1,886 2,736 3,917 2,164
other operating expenses) 1,903 2,230 3,025 2,950 1,729
Cash and other equivalent liquid assets 424 314 414 306 46
TOTAL ASSETS (A+B) 5,190 6,989 9,634 11,217 13,120 Depreciation of fixed assets 54 70 157 222 189
OPERATING PROFIT 1,382 593 1,036 1,035 1,176
NET WORTH AND LIABILITES 2009 2010 2011 2012 2013 Financial expenses 165 155 397 442 528
A) Net Worth 1,534 1,411 1,797 3,213 3,631
Foreign exchange loss -200 -29 88 90 20
Capital 210 210 210 429 429
Issue premium and reserves 327 874 1,201 2,405 2,771 FINANCIAL RESULT 35 -126 -485 -533 -548
Result of the year 998 327 386 379 431 PRE-TAX PROFIT 1,417 467 551 502 628
B) NON CURRENT LIABILITES 343 1,189 1,320 1,772 2,815
Profits tax 419 141 165 124 197
Long-term debt 324 1,172 1,166 1,607 2,650
Deferred tax liabilities 18 17 154 165 165 RESULT OF THE YEAR 998 327 386 379 431
C) CURRENT LIABILITIES 3,318 4,389 6,517 6,232 6,674
Short-term debt 1,365 2,726 2,844 3,247 3,683
Trade and other payables 1,953 1,663 3,673 2,985 2,991
TOTAL NET WORTH AND LIABILITES (A+B+C) 5,195 6,989 9,634 11,217 13,120
*2012 increase due to the fusion with DFC Group BVBA Figures In thousands of Euros
Figures In thousands of Euros
Page 30
Technology for everyoneCharity Project / Sports Events
PRODIS Fundation
It is a non-profit institution which aims to improve the
home, school, social and labour integration of the
children and young adults mentally disabled.
Promentor Project
Job placement for people with intellectual disabilities.
Sports sponsorship
INLADE Fundation NPG dressage team
National and international horse
It is a special non-profit work centre with
competitions sponsorship.
the stated goal of improving the quality of
life of people with intellectual disabilities
(DI) from Torrejón de Ardoz and its region,
through their work integration.
Projects NPG has been involved:
Integration by work of people mentally
disabled.
Page 31
Technology for everyoneTechnology for everyone
www.npgtech.comYou can also read