Tempur Sealy International, Inc - (TPX) "Success is strengthening our Iconic Brands while driving higher ROIC through focused execution" - Tempur ...
←
→
Page content transcription
If your browser does not render page correctly, please read the page content below

Tempur Sealy
 International, Inc.
             (TPX)
“Success is strengthening
       our Iconic Brands
     while driving higher
             ROIC through
     focused execution”

                            1   © 2018 Tempur Sealy International, Inc.
Tempur Sealy                                                                  • Strong global brands serving all price points
              International, Inc.                                                               • Omni-channel distribution balanced between wholesale
                                                                                                  and direct to consumer
                          (TPX)                                                                 • Global manufacturing footprint
         “Success is strengthening                                                              • Structural growth industry, with high ROIC and robust
                our Iconic Brands                                                                 free cash flow
              while driving higher                                                              • Industry is relatively concentrated in US and fragmented
                      ROIC through                                                                globally

              focused execution”

Forward-Looking Statements: This investor presentation contains “forward-looking statements” within the meaning
of federal securities laws. Please review carefully the cautionary statements and other information included in the
appendix under “Forward looking Statements”. Non-GAAP Financial Information: This presentation includes non-
GAAP financial measures. Please refer to the footnotes and the explanations about such non-GAAP financial          2                         © 2018 Tempur Sealy International, Inc.
measures, including reconciliations to the corresponding GAAP financial measures, in the appendix at the end of
this presentation. Footnotes: Please refer to the footnotes at the end of this presentation.
Focus on long-term initiatives:
                    • Develop the most innovative bedding products in all
       Delivering     the markets we serve
                    • Invest significant marketing dollars to promote our
Shareholder Value     worldwide brands
                    • Optimize worldwide distribution to be where
                      consumers want to shop
                    • Drive increases in EBITDA(1)

                        3                                  © 2018 Tempur Sealy International, Inc.
• US mattress sales grew at a 7% CAGR and Non-US mattress
                                                        sales grew at a 4% CAGR since 2009, driven by consumer
 Growing Global                                         shift to higher priced mattresses and population growth
                                                      • Tempur Sealy is at the center of global trend toward higher
Mattress Industry                                       quality and more innovation, driving average selling prices
                                                      • Tempur Sealy is a market leader in North America but
                                                        relatively low market share Internationally

        US WHOLESALE MATTRESSES(2)                                 WHOLESALE MARKET SIZE
                7% CAGR
                                                                          $32 B(4)
                                $6.7 $7.1
                 $5.5 $5.7 $6.2
            $5.0
  $4.4 $4.6

                                                                                     North
  2009 2010 2011 2012 2013 2014 2015 2016                                           America
                                                                                     $10 B

                                                                    International
                                                                        $22 B
    NON-US WHOLESALE MATTRESSES(3)
              4% CAGR
                $16.5 $16.7 $17.4 $18.2 $17.1 $17.6
  $13.2 $14.6

  2009 2010 2011 2012 2013 2014 2015 2016              4                                      © 2018 Tempur Sealy International, Inc.
BRANDS AND PRODUCTS

               5
Tempur Sealy Has
                    • Brands are complementary and fully cover the market
 Well Established   • Tempur-Pedic is the premium market leader
   Global Brands

                        6                               © 2018 Tempur Sealy International, Inc.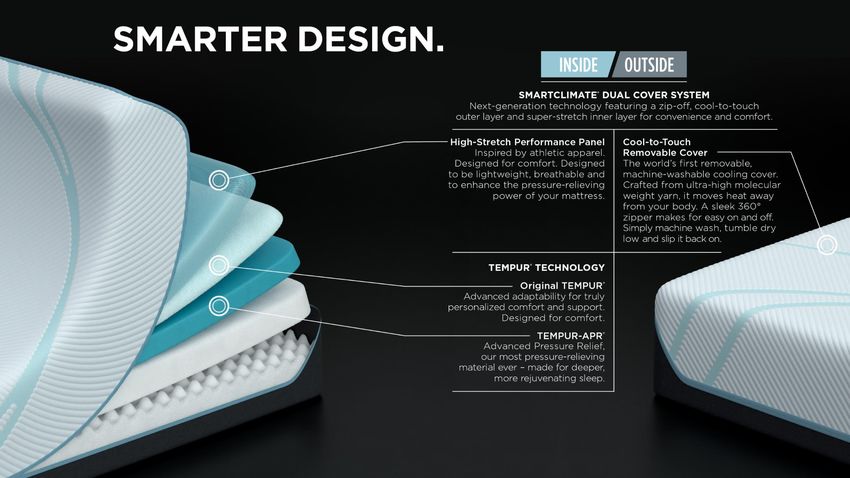
Complementary Brands
                             Percentage of Revenue(4)

                                  Tempur-Pedic
                                  Nothing precisely adapts, supports
                           50%    and aligns like Tempur-Pedic for life-
                                  changing sleep

                                  Stearns & Foster
                                  Finest beds made with exceptional
                           20%    materials and unparalleled
                                  craftsmanship

                                  Sealy
                                  Featuring Posturepedic Technology™
                                  providing support that’s right for you
                           30%    Cocoon by Sealy (Bed in a Box)
                                  Your bed, your way

                       7                  © 2018 Tempur Sealy International, Inc.
Complete Portfolio of Products
TEMPUR MATERIAL              HYBRID                    INNERSPRING                MEMORY FOAM

   TEMPUR BREEZE®           SEALY HYBRID®                                             SEALY CONFORM®
                                                       STEARNS & FOSTER®

                                                                                  COCOON BY
                                                                                    SEALY
                                                                                (BED IN A BOX)
   TEMPUR ADAPT™         STEARNS & FOSTER®              SEALY RESPONSE®

                                            OTHER SPECIALTY

                                                                      PILLOWS
                        ADJUSTABLE BASES

                                                   8                                © 2018 Tempur Sealy International, Inc.
TEMPUR-PEDIC 2018

The most integrated product             …to improve SKU productivity
offering in the brand’s history…       and increase unit market share
                                   9            © 2018 Tempur Sealy International, Inc.
10 © 2018 Tempur Sealy International, Inc.
SEALY HYBRID 2018

Leveraging the Best of                Sealy’s coolest hybrid utilizing the latest
Both Worlds.                                      in Posturepedic Technology.
                                 11                      © 2018 Tempur Sealy International, Inc.
Bedding System • Pillows with Premium Knit Covers with New Cooling
Technology
New Adjustable Bases and • Streamlined, upgraded range of Adjustable Bases
Pillows: Supporting Tempur-Pedic, Stearns & Foster, and Sealy
TEMPUR-Adapt™ Tempur Sealy Adjustable Bases
Pillows
TEMPUR-PEDIC
ERGO EXTEND
TEMPUR-PEDIC
ERGO
EASE
12 © 2018 Tempur Sealy International, Inc.Global Manufacturing Foot Print
35
International
Facilities
23
North American
Facilities
Wholly owned and Joint Venture
Tempur-Pedic Facility
Joint Venture
Licensee
13 © 2018 Tempur Sealy International, Inc.COST OF GOODS SOLD
Fixed ~15%
~10% of total costs
Flexible Operating
Model with a Variable Variable ~85%
Cost Structure (4) ~55% of total costs
• Tempur Sealy’s total cost structure is highly
variable; approximately 75% in total
OPERATING EXPENSES
• Tempur Sealy cost structure can be quickly
aligned with sales trends
Fixed ~45%
~15% of total costs
Variable ~55%
~20% of total costs
14 © 2018 Tempur Sealy International, Inc.• North American and International operating
Global models support demand
• Driving for operational improvements on
Manufacturing key metrics such as product quality and on-
time delivery
Foot Print • Adjusted Gross Margins consistent with
prior year despite significant volume
deleverage
CONSOLIDATED NET SALES &
ADJUSTED GROSS MARGIN(5)
42.0% $800
41.3% 41.3%
41.0% $721
40.4% $722 $700
40.0%
$648
39.0% $600
1Q 2016 1Q 2017 1Q 2018
$ in millions
15 © 2018 Tempur Sealy International, Inc.
Please Note: GAAP gross margin in Q1 2016, Q1 2017, and Q1 2018 was 40.4%, 39.7%, and 41.3%, respectivelyLATEST RESULTS 16
First Quarter 2018                          • Total Net Sales Increased 3% Excluding Mattress Firm
                                            • North American Direct Sales Increased Approximately 30%
        Highlights
             Three MONTHS ENDED March 31
                                                                          %Change
                                       2018         2017      %Change     Constant
                                                                         Currency(6)

     Net Sales                        $648.0        $722.1      -10.3%    -12.2%

     Net Income                        23.1          33.9       -31.9%    -39.5%

     EPS                               0.42          0.62       -32.3%    -40.3%

     EBITDA(1)                         83.2          86.8       -4.1%      -8.9%

     Adjusted Net Income(6)            $23.1        $52.2       -55.7%    -60.7%

     Adjusted EPS(6)                   0.42          0.96       -56.3%    -61.5%

     Adjusted EBITDA(1)                83.2         121.1       -31.3%    -34.7%

      (in millions, except percentages and per common share amounts)
                                               17                                  © 2018 Tempur Sealy International, Inc.
Worldwide Direct Business
NORTH AMERICA DIRECT CHANNEL
E-commerce & Call Center Company-Owned Stores
$30
$-
1Q17 1Q18
$ in millions
INTERNATIONAL North America Direct Channel grew
NORTH AMERICAN
approximately 30% in the first quarter 2018
SALES CHANNEL SALES CHANNEL
18 © 2018 Tempur Sealy International, Inc.
Direct Wholesale Direct WholesaleUS Company • 31 Stores Currently Open
• Average Sales per Store in 2017 of Approximately $2.2M
Owned Stores • New Stores have a payback of approximately 6 to 9
months(4)
19 © 2018 Tempur Sealy International, Inc.
Please Note: average sales per store includes stores open from Jan 1, 2017 through Dec 31, 2017.• We expect to pay down debt to enter a normalized range for
leverage
• Then consider share repurchase program / acquisition
Debt Structure • Leverage ratio target(7): 3.5x with a range of 3.0x to 4.0x
• Fixed rate debt represent ~60% of total debt; capital structure
contains long dated maturities
• About $227 million remaining on share repurchase
authorization
LEVERAGE(6) MANDATORY MATURITY PROFILE(8)
4.34x $600
3.46x 3.50x
3.18x $435 $450
$87
$53
$30
1Q 16 1Q 17 1Q 18 Target 2018 2019 2020 2021 2022 2023 2024 2025 2026
Term Loan A 5.625% Senior Notes 5.500% Senior Notes
Rating Agency Ratings
• S&P: BB as of February 2018
© 2017 Tempur Sealy International, Inc. 20 • Moody’s: Ba3 as of September 2017NEAR TERM OUTLOOK
Growth strategy, key recapture methods:
                      •        Increased velocity of our products in our current
Growing Revenues               customers
                      •        Increased balance of share with current customers
 in North America     •        Increased presence of new retailers in markets that
                               are currently underpenetrated
                      •        Capture fair share of direct-to-consumer business
                               on the internet and a relatively limited number of
                               company-owned stores

                          22                                    © 2018 Tempur Sealy International, Inc.
Long-Term Goals
• Develop the most innovative bedding products in all
the markets we serve
2018 Targets and • Invest significant marketing dollars to promote our
worldwide brands
Near Term Priorities • Optimize worldwide distribution to be where
consumers want to shop
• Drive increases in EBITDA(1)
(7)
2018 Financial Targets and Assumptions
Adjusted EBITDA(1) $450 to $500 M
Capital Expenditures $65 to $75 M
Depreciation & Amortization $110 to $120 M
Interest Expense $90 to $95 M
U.S. Federal Tax Rate Range 26% to 28%
Share Count 55 M
Target Debt to EBITDA(1) 3.5x
23 © 2018 Tempur Sealy International, Inc.Thank you for
your interest in
Tempur Sealy
International
For more information please email: investor.relations@tempursealy.com 24 © 2018 Tempur Sealy International, Inc.APPENDIX
25Aspirational Plan (9)
➢ On August 7, 2017, the Company implemented a new Aspirational Program in the form of performance
restricted stock units tied to challenging performance targets. This Aspirational Program builds on the
challenging goals and the structure established in our original Aspirational Program adopted in 2015, with
slightly revised performance goals and new performance periods, as we align the management team around
our new aspirational targets following the termination with our largest customer
• Performance restricted stock units (“PRSUs”) for approximately 1.5 million shares of the Company’s
common stock have been granted to over 150 employees
• PRSUs will vest based on adjusted EBITDA(1) performance measured on a rolling 4 quarter basis during
two performance periods -- 2018 and 2019 (“Period 1”) and 2020 (“Period 2”)
• If the minimum performance target is met for the applicable period, awards become payable shortly
after the applicable Period. If an officer or employee leaves for any reason prior to vesting, all of his or
her PRSUs will be forfeited, subject to certain limited exceptions
~15% of total costs
Achievement Schedule
% of Total Grant of PRSUs That Will Vest
Adjusted EBITDA January 1, 2018 – December 31, 2019 (Period 1)
≥ $650 100%
$600 66% ~20% of total costs
< $600 0%
▪ Measured quarterly on a trailing four quarter period
▪ If an award is earned in Period 1 the program ends, subject to a change of control provision
▪ If an award is not earned in Period 1, then ½ of the award lapses and ½ of the award remains available for vesting based on performance in Period 2
▪ Prorated based on performance between $600 & $650, but is only payable at the end of the respective period
(adjusted EBITDA target $ in millions) 26
For more information please refer to the Company’s Form 8-K filed on August 7, 2017Forward-Looking Statements
This investor presentation contains "forward-looking statements," within the meaning of the federal securities laws, which include information concerning one or more of the Company's plans,
objectives, goals, strategies, and other information that is not historical information. When used in this presentation, the words "estimates," "expects," "guidance," "anticipates," "projects,"
"plans," "proposed," "intends," "believes," and variations of such words or similar expressions are intended to identify forward-looking statements. These forward-looking statements include,
without limitation, statements relating to the Company’s expectations regarding adjusted EBITDA, capital expenditures, depreciation and amortization, interest expense, tax rate and share count
for 2018 and performance generally for 2018 and subsequent periods, expectations regarding the Company’s plans in 2018 with respect to product launches, price increases and expansion of its
omnichannel strategy including store opening and the Company’s strategy to recapture market share in the U.S., and expectations regarding the Company’s target leverage ratio, share
repurchase program and the capital allocation strategy and expectations regarding the ability to reduce costs in a reduced sales or recession scenario. All forward-looking statements are based
upon current expectations and beliefs and various assumptions. There can be no assurance that the Company will realize these expectations or that these beliefs will prove correct.
Numerous factors, many of which are beyond the Company's control, could cause actual results to differ materially from those expressed as forward-looking statements. These risk factors
include risks associated with the Company's capital structure and debt level; general economic, financial and industry conditions, particularly in the retail sector, as well as consumer confidence
and the availability of consumer financing; changes in product and channel mix and the impact on the Company's gross margin; changes in interest rates; the impact of the macroeconomic
environment in both the U.S. and internationally on the Company's business segments; uncertainties arising from global events; the effects of changes in foreign exchange rates on the
Company's reported earnings; consumer acceptance of the Company's products; industry competition; the efficiency and effectiveness of the Company's advertising campaigns and other
marketing programs; the Company's ability to increase sales productivity within existing retail accounts and to further penetrate the Company's retail channel, including the timing of opening or
expanding within large retail accounts and the timing and success of product launches; the effects of consolidation of retailers on revenues and costs; changes in demand for the Company's
products by significant retailer customers; the Company's ability to expand brand awareness; the Company’s ability to expand distribution either through third parties or through direct sales; the
Company's ability to continuously improve and expand its product line and successfully roll out new products, maintain efficient, timely and cost-effective production and delivery of its products,
and manage its growth; the effects of strategic investments on the Company's operations; changes in foreign tax rates and changes in tax laws generally, including the ability to utilize tax loss
carry forwards; the outcome of various pending tax audits or other tax, regulatory or investigation proceedings and outstanding litigation; changing commodity costs; the effect of future
legislative or regulatory changes; and disruptions to the implementation of the Company's strategic priorities and business plan caused by abrupt changes in the Company's senior management
team and Board of Directors.
There are a number of risks, uncertainties and other important factors, many of which are beyond the Company’s control, that could cause its actual results to differ materially from those
expressed as forward-looking statements in this investor presentation, including the risk factors discussed under the heading "Risk Factors" under ITEM 1A of Part 1 of the Company’s Annual
Reports on Form 10-K for the years ended December 31, 2017 There may be other factors that may cause the Company's actual results to differ materially from the forward-looking statements.
The Company undertakes no obligation to update any forward-looking statement to reflect events or circumstances after the date on which such statement is made.
Note Regarding Historical Financial Information:
In this investor presentation we provide or refer to certain historical information for the Company. For a more detailed discussion of the Company’s financial performance, please refer to the
Company’s SEC filings.
Note Regarding Trademarks, Trade Names and Service Marks:
TEMPUR®, Tempur-Pedic®, the TEMPUR-PEDIC & Reclining Figure Design®, TEMPUR-Cloud®, TEMPUR-Choice®, TEMPUR-Weightless®, TEMPUR-Contour™, TEMPUR-Rhapsody™, TEMPUR-Flex®,
THE GRANDBED BY TEMPUR-PEDIC®, TEMPUR-Simplicity®, TEMPUR-Ergo®, TEMPUR-UP™, TEMPUR-Neck™, TEMPUR-Symphony™, TEMPUR-Comfort™, TEMPUR-Traditional™, TEMPUR-Home™,
SEALY®, SEALY POSTUREPEDIC®, STEARNS & FOSTER®, COCOON by Sealy™ and OPTIMUM® are trademarks, trade names or service marks of Tempur Sealy International, Inc. and/or its subsidiaries.
All other trademarks, trade names and service marks in this presentation are the property of the respective owners.
Limitations on Guidance: The guidance included herein is from the Company’s press release and related earnings call on May 3, 2018. The Company is neither reconfirming this guidance as of
the date of this investor presentation nor assuming any obligation to update or revise such guidance. See above.
27Footnotes
1. EBITDA and adjusted EBITDA are a non-GAAP financial measures. Please refer to the "Use of Non-GAAP Financial Measures and Constant Currency Information"
beginning on slide 29 for more information regarding the definitions of EBITDA and adjusted EBITDA, including the adjustments from the corresponding GAAP
information. Amounts shown for 2018 financial targets on slide 23 represents management estimates of adjusted EBITDA performance based on the Company’s
guidance provided on February 22, 2018. Please refer to “Forward-Looking Statements” and “Limitations on Guidance” on slide 27. The Company notes that it is
unable to reconcile this forward-looking non-GAAP financial measure to GAAP net income, its most directly comparable forward-looking GAAP financial measure,
without unreasonable efforts, because the Company is currently unable to predict with a reasonable degree of certainty the type and extent of certain items that
would be expected to impact GAAP net income in 2018 but would not impact adjusted EBITDA. These items that impact comparability may include restructuring
activities, the impact of the termination of contracts with Mattress Firm, foreign currency exchange rates, income taxes, and other items. The unavailable information
could have a significant impact on the Company's full year 2018 GAAP financial results.
2. According to 2016 Mattress Industry Report of Sales & Trends provided by the International Sleep Products Association (“ISPA”).
3. CSIL World Mattress Report, 2016 (Top 44 Markets Mattress Consumption).
4. Management estimates.
5. Adjusted gross margin is a non-GAAP financial measure. Please refer to the “Use of Non-GAAP Financial Measures and Constant Currency Information” beginning on
slide 29 for more information regarding the definition of these non-GAAP financial measures, including the adjustments from the corresponding GAAP information.
6. Adjusted net income, adjusted EPS, adjusted gross margin, leverage, leverage ratio, and constant currency are non-GAAP financial measures. Please refer to the “Use
of Non-GAAP Financial Measures and Constant Currency Information” beginning on slide 29 for more information regarding the definition of these non-GAAP financial
measures, including the adjustments from the corresponding GAAP information.
7. Based on the Company’s 2018 financial targets provided in the press release dated May 3, 2018 and the related earnings call on May 3, 2018. Please refer to
“Forward-Looking Statements” and “Limitations on Guidance”.
8. Based on debt outstanding at December 31, 2017. For more information please refer to the Company’s annual report on Form 10-K for the year ended December 31,
2017.
9. For more information about the aspirational plan and the terms of the aspirational PRSUs, please refer to the Company’s SEC filings. In addition, please refer to
“Forward Looking Statements”.
28Use of Non-GAAP Financial Measures and Constant Currency Information
In this investor presentation and certain of its press releases and SEC filings, the Company provides information regarding adjusted net income, adjusted gross margin, adjusted EPS, EBITDA,
adjusted EBITDA, and consolidated funded debt less qualified cash and leverage ratio which are not recognized terms under U.S. GAAP and do not purport to be alternatives to net income
and earnings per share as a measure of operating performance or an alternative to total debt. The Company believes these non-GAAP measures provide investors with performance
measures that better reflect the Company's underlying operations and trends, including trends in changes in margin and operating expenses, providing a perspective not immediately
apparent from net income and operating income. The adjustments management makes to derive the non-GAAP measures include adjustments to exclude items that may cause short-term
fluctuations in the nearest GAAP measure, but which management does not consider to be the fundamental attributes or primary drivers of the Company's business, including costs
associated with the termination of Mattress Firm in 2017, costs associated with a Latin American subsidiary, legal settlements and other costs.
The Company believes that exclusion of these items assists in providing a more complete understanding of the Company's underlying results from continuing operations and trends, and
management uses these measures along with the corresponding GAAP financial measures to manage the Company's business, to evaluate its consolidated and business segment
performance compared to prior periods and the marketplace, to establish operational goals and management incentive goals, and to provide continuity to investors for comparability
purposes. Limitations associated with the use of these non-GAAP measures include that these measures do not present all of the amounts associated with the Company’s results as
determined in accordance with GAAP and these non-GAAP measures should be considered supplemental in nature and should not be construed as more significant than comparable
measures defined by GAAP. Because not all companies use identical calculations, these presentations may not be comparable to other similarly titled measures of other companies. For more
information regarding the use of these non-GAAP financial measures, please refer to the Company’s SEC filings.
Constant Currency Information
In this presentation the Company refers to, and in other communications with investors the Company may refer to, net sales or earnings or other historical financial information on a
"constant currency basis," which is a non-GAAP financial measure. These references to constant currency basis do not include operational impacts that could result from fluctuations in
foreign currency rates. To provide information on a constant currency basis, the applicable financial results are adjusted based on a simple mathematical model that translates current period
results in local currency using the comparable prior corresponding period's currency conversion rate. This approach is used for countries where the functional currency is the local country
currency. This information is provided so that certain financial results can be viewed without the impact of fluctuations in foreign currency rates, thereby facilitating period-to-period
comparisons of business performance.
Gross Margin
A reconciliation of GAAP gross profit and gross margin to adjusted gross profit and gross margin, respectively, is provided on slide 33. Management believes that the use of these non-GAAP
financial measures provides investors with additional useful information with respect to the impact of various adjustments as described in the footnotes provided.
EBITDA and Adjusted EBITDA
A reconciliation of the Company's GAAP net income to EBITDA and adjusted EBITDA is provided on slide 30. Management believes that the use of EBITDA and adjusted EBITDA provides
investors with useful information with respect to the Company’s operating performance and comparisons from period to period.
Leverage
Consolidated funded debt less qualified cash to adjusted EBITDA, which the Company may refer to as leverage, is provided on slide 31 and is calculated by dividing consolidated funded debt
less qualified cash, as defined by the Company’s senior secured credit facility, by adjusted EBITDA. The Company provides this as supplemental information to investors regarding the
Company’s operating performance and comparisons from period to period, as well as general information about the Company's progress in reducing its leverage.
Adjusted Net Income and Adjusted EPS
A reconciliation of the Company's GAAP net income to adjusted net income and a calculation of adjusted EPS are provided on slide 32. Management believes that the use of adjusted net
income and adjusted EPS also provides investors with useful information with respect to the Company’s operating performance and comparisons from period to period.
29Adjusted EBITDA Reconciliation
30Leverage Reconciliation
31Adjusted Net Income and Adjusted EPS
32Adjusted Gross Margin
1Q 2018 1Q 2017 1Q 2016
Consolidated Margin Consolidated Margin Consolidated Margin
Net sales 648.0 722.1 721.0
Gross profit 267.9 41.3% 286.6 39.7% 291.0 40.4%
(1)
Adjustments - 11.5 0.2
Adjusted gross profit 267.9 41.3% 298.1 41.3% 291.2 40.4%
Adjustments include $11.5 million of charges related to the write-off of customer-unique inventory and
product obligations in Q1 2017 and $.2 million of integration costs, which include compensation costs,
professional fees and other charges related to the transition of manufacturing facilities, and other costs to
support the continued alignment of the North America business segment in 1Q 2016 related to the Sealy
acquisition.
For additional information regarding the calculations above please refer to the Company's quarterly report on
Form 10-Q for the period ended March 31, 2018.
33You can also read