INVESTOR PRESENTATION - February 9, 2021 - Investor Relations | Corsair ...
←
→
Page content transcription
If your browser does not render page correctly, please read the page content below

INVESTOR PRESENTATION
      February 9, 2021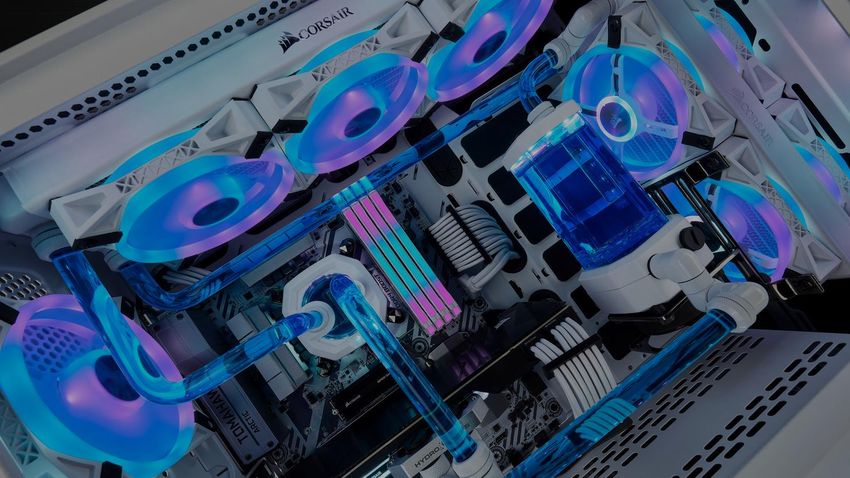
DISCLAIMER
Forward Looking Statements

This presentation contains forward looking statements that involve risks, uncertainties and assumptions. If the risks or uncertainties ever materialize or the assumptions prove incorrect, the Company's results may differ materially from those
expressed or implied by such forward-looking statements. All statements other than statements of historical fact could be deemed forward-looking statements, including, but not limited to: information or predictions concerning the
Company's future financial performance, business plans and objectives, potential growth opportunities, financing plans, competitive position, technological, industry or market trends and potential market opportunities. These statements are
based on estimates and information available to the Company at the time of this presentation and are not guarantees of future performance. Actual results could differ materially from the Company's current expectations as a result of many
factors, including, but not limited to: the Company’s ability to build and maintain the strength of its brand among gaming and streaming enthusiasts and its ability to continuously develop and successfully market new gear and improvements
to existing gear; the introduction and success of new third-party high-performance computer hardware, particularly graphics processing units and central processing units, as well as sophisticated new video games; fluctuations in operating
results; the risk that the Company is not able to compete with competitors and/or that the gaming industry, including streaming and eSports, does not grow as expected or declines; the loss or inability to attract and retain key management;
delays or disruptions at manufacturing and distribution facilities of the Company or third parties; currency exchange rate fluctuations or international trade disputes resulting in the Company’s gear becoming relatively more expensive to its
overseas customers or resulting in an increase in the Company’s manufacturing costs; the impact of the coronavirus on the Company’s business; and general economic conditions that adversely effect, among other things, the financial
markets and consumer confidence and spending. The Company assumes no obligation, and does not intend, to update these forward-looking statements, except as required by law. Investors are urged to review in detail the risks and
uncertainties outlined in Corsair’s Securities and Exchange Commission filings, including but not limited to Corsair’s Annual Report on Form 10-K for the year ended December 31, 2020 (once available) as well as the Risk Factors
contained therein. You may get these documents for free by visiting EDGAR on the SEC website at http://www.sec.gov.

Non-GAAP Financial Measures

Included in this presentation are certain non-GAAP financial measures, such as adjusted EBITDA, which are not recognized under the generally accepted accounting principles (“GAAP”) in the United States and designed to complement
the financial information presented in accordance with GAAP in the United States because management believes such measures are useful to investors. The non-GAAP measures have limitations as analytical tools and you should not
consider them in isolation of, or as an alternative to, measures prepared in accordance with U.S. GAAP. The non-GAAP measures used by the Company may differ from the non-GAAP measures used by other companies. The Company
urges you to review the reconciliation of its non-GAAP financial measures to the most directly comparable U.S. GAAP financial measures set forth in the Appendix to this presentation, and not to rely on any single financial measure to
evaluate the Company's business.

Market & Industry Data

This presentation also contains estimates and other statistical data made by independent parties and by the Company relating to the Company’s industry, the Company’s business and the market for the Company’s products and its future
growth. This data involves a number of assumptions and limitations, and you are cautioned not to give undue weight to such estimates. In addition, projections, assumptions, and estimates of the Company’s future performance and the
future performance of the market for its products are necessarily subject to a high degree of uncertainty and risk.

Unless otherwise specified, all figures are as of December 31, 2020.

                                                                                                                                                                                                                                                     2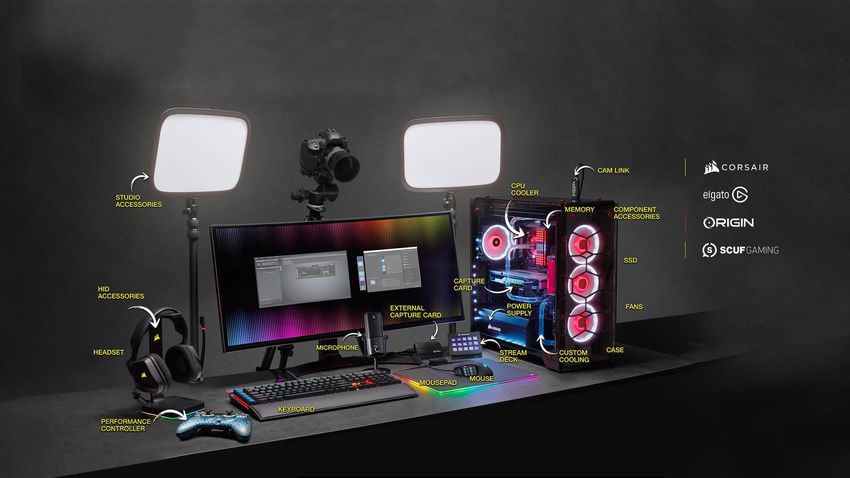
CORSAIR MAKES SPECIALIZED GEAR FOR
      GAMERS AND STREAMERS

                                     33
GAMING AND STREAMING GEAR AT SCALE
                                                                                                                                                                                                                     23
    Founded in
                                                 2,000+                                           $1.7bn                                                 25.7%                                        Primary Product
                                                                                                                                                    2017 – 2020 (1)                                   Lines, Many with
        1994                                     Employees                                   Revenue               2020 (1)
                                                                                                                                                   Revenue CAGR                                        Leading Market
                                                                                                                                                                                                           Share

                    GAMER AND CREATOR PERIPHERALS                                                                                           GAMING COMPONENTS AND SYSTEMS

KEYBOARDS               MICE             GAMING                 PERFORMANCE                  STREAMING GEAR                      HIGH                       COMPUTER                POWER               COOLING                 COMPLETE
                                        HEADSETS                CONTROLLERS                                                  PERFORMANCE                      CASES                 SUPPLY             SOLUTIONS                SYSTEMS
                                                                                                                               MEMORY                                                UNITS

 1 Reflects preliminary and unaudited estimates for the year ended December 31, 2020 based on currently available information. This is not a comprehensive statement of our financials results and is subject to completion of our closing process.
 Actual results may differ materially from these estimates. Estimates should not be viewed as a substitute for our full annual financial statements, and are not necessarily indicative of the results to be expected for any future period.
                                                                                                                                                                                                                                          4
THE COMPLETE PRODUCT SUITE FOR
     GAMING AND STREAMING

                                 5
OUR OPPORTUNITY
Gaming, eSports, Streaming

                             6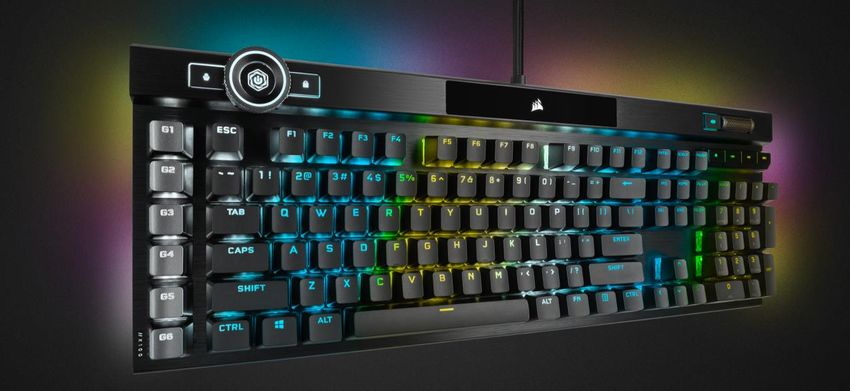
GAMING HAS RAPIDLY GROWN AND BECOME MAINSTREAM

                        ‘70s          ‘80s          ‘90s              ‘00s                ‘10s – ’20s
                         Arcade       Consoles      Local PC        Online PC,               eSports and
                        (1 Player)     (2 Player)   Network        Console and            Competitive Gaming
                                                    (2+ Player)   Mobile Networks           (Millions of Players
                                                                  (Millions of Players)      and Spectators)

     Then                                                                                      Now
  Potential
 Competitors            Yourself     One Friend     Multiple         Players                    2.6
                                                    Friends         Worldwide                  Billion
                                                                                           Global Gamers
  Gamers &
  Market Size
                                                                                              $149
                                                                                          Billion Globally
Source: Newzoo (2020)

                                                                                                                   7
ESPORTS AND
    STREAMING POWER
    AN INVESTMENT AND                                                                 2.6B                                                                                 12B
                                                                                        Gamers                                                                         Streaming Hours
                                                                                                                          MORE                              MORE
    SPENDING                                                                            Globally
                                                                                        In 2019                   PLAYERS                                  VIEWERS
                                                                                                                                                                       Watched in 20191

    FLYWHEEL IN
    GAMING                                                                             11%                              NEW
                                                                                                                                      ESPORTS &
                                                                                                                                                           INCREASED
                                                                                                                                                                          71%
                                                                                    Leisure Time                     CUSTOMERS        STREAMING              FOCUS     Millennial Gamers
                                                                                      in U.S. is                                                                        In U.S. Watch
                                                                                      Spent on                                                                          Gaming Video
                                                                                       Gaming                                                                              Content on
                                                                                                                                                                           Streaming
                                                                                                                                                                            Platforms
                                                                                                                                          MORE
                                                                                                                                       INVESTMENT
                                                                                                                                          Publishers,
                                                                                                                                          Sponsors,
                                                                                                                                       Advertisers, Team
                                                                                                                                       Owners, Leagues

                                                                                                                                 $951 Million
                                                                                                                                 eSports Revenue in 2019
Source: Newzoo (2020), StreamLabs, Activate Technology & Media Outlook 2020 and Nielsen
1 Hours watched across Twitch, YouTube Gaming, Facebook Gaming and Mixer; does not include Chinese streaming platforms.

                                                                                                                                                                                  8
GAMERS AND STREAMERS NEED HIGH PERFORMANCE GEAR

                                                          GAMERS                                  STREAMERS

                           PC                              Console                Mobile

               524mm PC Gamers                       729mm Console Gamers   2.4bn Mobile Gamers   6mm Committed
                                                                                                    Streamers
  GEAR NEEDS

Source: Jon Peddie Research and Newzoo (2019,2020)

                                                                                                                  9
MANY PC GAMERS ARE CONSTANTLY BUILDING AND
UPGRADING THEIR PCS WITH INDIVIDUALLY SELECTED,
HIGH PERFORMANCE COMPONENTS
▪ Games Become More Graphically Intense Every Year,                    • A Majority of This High-End PC Segment Consists of Gamers Who
  Requiring High-End Gaming PCs to Play Competitively                    Build Their Own Rigs

▪ Competitive PC Gamers Want Both High Quality Graphics and            • This is a Large, Growing Market, Comprising 46% of the Total
  High Frame Rates                                                       Gaming PC Spend and Exhibiting a CAGR of 14% From 2012-
                                                                         2019
▪ High Quality Graphics Enhance the Immersive Experience
  While Higher Frame Rates Have Definitive, Measurable                 • Gaming PC Builders Care About :
  Performance Benefits
                                                                             • Performance and Cooling
                                                                             • Quietness and Silence
                144FPS                    VS                   30FPS         • Reliability and Durability
                                                                             • Aesthetics and Form Factor

▪ 51% of the Global Gaming PC Market Comprises of Machines             • Corsair is a Recognized Market Leader in the Categories of
  that Cost $1,800+                                                      Gaming Components it Sells to the High-Spend Consumer
 Source: Jon Peddie Research (2020), DFC Intelligence (2020)
                                                                                                                                         10
GAMING GEAR UPGRADE PATH
CASUAL COMMITTED
11STREAMING GEAR UPGRADE PATH
CASUAL COMMITTED
12COMPETITIVE
GAMING AND Pro eSports Pro
STREAMING DRIVE Athletes Streamers
USER ASPIRATIONS,
SPEND ON HIGH
COMMITTMENT AND PERFORMANCE GEAR
SPENDING ON GEAR Sponsored
(~$0)
COMMITTED
PC / CONSOLE
GAMERS
Extensive
COMPETITIVE PC / CONSOLE
GAMERS
Moderate
CASUAL PC /
CONSOLE GAMERS
Low
MOBILE-ONLY GAMERS
~$0
13LARGE GLOBAL PC GAMING AND
…Resulting in Significant Whitespace as Gamers and
STREAMING GEAR MARKET, WITH Streamers Become More Serious and Start to Spend
SIGNIFICANT WHITESPACE Represents Gamers Who Spent >$1,000 on Their Primary PC
5% Committed Competitive Casual
2019 Total PC Gamers:
13%
524mm $651
While Committed and Competitive
PC Gamers Only Make Up 18% of
the PC Gamer Population….
2019 Total Spending on PC
Gaming Gear: $36bn $179
…They Represent 83% of the $36bn
PC Gaming and Streaming Gear $18 $14
Total Addressable Market… $12
27mm + 67mm + 430mm
Number of PC Gamers
Source: Jon Peddie Research (2019, 2020) Note: Committed PC Gamers defined by >$1,800 per gamer aggregate
Committed Competitive Casual spend on gaming hardware and accessories. Competitive PC Gamers defined by $1,000 - $1,800 per gamer
aggregate spend on gaming hardware and accessories. Casual PC Gamers defined byPROLIFERATION OF
STREAMING AND
BROADER CONTENT
CREATION EXPANDING
MARKET OPPORTUNITY
~6 Million
Committed Streamers Across Platforms1
Streamers who Purchase Streaming Gear Spent an
Average of Over $240 in 2019.
Traditionally Spend Was on Gaming Content, But
Increasingly on:
• Podcasting
• Video Blogging
• Interactive Fitness
• Remote Learning
• Work From Home
Source: Newzoo (2020)
1 Includes Twitch and Youtube.
15OUR COMPETITIVE ADVANTAGE
Leading Performance and Integration
16REPUTATION FOR HIGH PERFORMANCE AND QUALITY
Since 2016, We Have Received over 4,000 Product Awards in Approximately 45 Countries,
of Which 3,500 Were “Gold,” “Editor’s Choice,” “Approved,” or Similar Awards
Precision Power Customization
Durability Aesthetics Creative freedom
17USED, INFLUENCED AND TESTED BY THE WORLD’S MOST
ADMIRED GAMERS AND STREAMERS
LEADING R&D
TEAM AND
CONTINUED
PRODUCT
ENHANCEMENT
SUMMIT1G
7mm+ Followers
2020 Live Viewer Hours: 109mm PROFESSIONAL
ATHLETE AND CORSAIR
GAMER DNA AND
FEEDBACK ADVANTAGE
(BETA TESTING)
CohhCarnage
2mm+ Followers
MOST
2020 Live Viewer Hours: 36mm COMPLETE
GAMING
LoserFruit ECOSYSTEM
9mm+ Followers
2020 YouTube Views: 51mm
18MOST COMPLETE, SOFTWARE-DRIVEN ECOSYSTEM
Two proprietary software platforms enhance brand loyalty and repeat
purchases across gaming and streaming gear
iCUE FOR GAMERS ELGATO FOR CONTENT CREATORS
Performance Tuning 5
RGB Lighting Control
4 1
3 2
Immersive game Integration Performance Dashboard
1 4K Video Capture 2 Audio and Mic Mixer 5
Video software
3 Stream Deck Software 4 Lighting Control
19MARKET LEADERSHIP ACROSS OUR
PRODUCT CATEGORIES
Kingston/ Cooler
Logitech Razer Microsoft Crucial EVGA NZXT Seasonic
HyperX Master
Keyboards 2nd • • • • •
Gamer and Creator
Mice 3rd • • • • • Corsair’s Leadership
Peripherals
Headsets 4th • • • • Commanding Price Premiums
Against Other Brands1
Streaming
Peripherals 2nd • •
Cooling Solutions +73%
Performance
Controllers 2nd • • Computer Cases +42%
Memory 1st • • Power Supply Units +32%
Gaming Component
and Systems
High-Performance Memory +8%
Cases 2nd • • •
Power Supply
Units 1st • • • •
Cooling
Solutions 1st • • •
Total U.S Market Share Based on NPD Group Total U.S Market Share Based on Management Estimates Indicates Offering in Product Category
Source: NPD Group (Last twelve months ended September 2020) and management estimates.
1 Premiums in the U.S. for the twelve months ended September 2020.
20GLOBAL AND ESTABLISHED CHANNEL RELATIONSHIPS
AMERICAS EMEA APAC
21SUPPORTED BY A INFLUENCER
HIGHLY EFFICIENT MARKETING
Sponsor High-Impact Gamer and
MARKETING ENGINE Streamer Influencers
ESPORTS
MARKETING SOCIAL MEDIA
Sponsor Leading Teams Powerful Social Media
and Tournaments Across Footprint
Geographies and Games
EVENTS
Opportunity to Interact With
WEB AND DIGITAL
Industry, Channel, and ADVERTISING
Supplier Partners as Well as
Search, Traffic
End-Consumers
Acquisition, Product
Launches and Offers
PRODUCT
REVIEWS
Received 4,000+ Industry Awards
Since 2016 for Leading Products
and Features
22OVERVIEW OF GROWTH STRATEGY
1 Advance as the global leader in high-performance gaming and streaming gear
2 Continue to develop innovative, market-leading gaming and streaming gear
3 Expand into new gear and services that grow our market opportunity
4 Leverage our software platforms to sell more gear into existing customers
5 Strengthen relationships with end-users by increasing direct-to-consumer sales
6 Continue to grow market share globally
7 Selectively pursue complementary acquisitions
23MANAGEMENT TEAM OF VISIONARY INDUSTRY LEADERS
ANDY PAUL MICHAEL G. POTTER THI LA CARINA TAN PETE HILLIARD JULIAN LIGHTON
CEO CFO President & COO Vice President Chief Human SVP, Strategy &
& General Counsel Resource officer New Ventures
42 Years in Industry 30 Years in Industry 33 Years in Industry 24 years legal experience 30 years of HR experience 31 Years in Industry
Chief People Officer
President of Multichip Technology CFO and Chief Legal Officer VP, Global Operations and IT Partner CEO Chief Strategy Officer
Chief Administrative Officer
General Manager Chief Strategy Officer
CFO
Various sales and marketing positions Director
Research Scientist
CFO Various Senior Positions
Partner & VP of Operations 24FINANCIAL OVERVIEW
Top-Line Growth and Cash Flow Profile Support
Investment in Attractive Growth Areas
25FINANCIAL HIGHLIGHTS
1 Strong top-line growth
2 Margin expansion across our segments
3 Investing to consolidate market leadership
4 Asset-light business model
5 Strong free cash flow generation
26STRONG TOP-LINE GROWTH - REVENUE
YoY
$1,702 M YoY $556 M
Growth
Growth
55%
YoY 539 70% 192
Growth
$1,097 M 83%
17% $327 M
$938 M 104%
294
234 26% 94
45% 1163 365
57%
14% 803
704 232
2018 2019 2020(1) Q4'19 Q4'20 (1)
Gamer and Creator Peripherals Gaming Components and Systems Total
Source: Company Management
Note: Financials in $mm. 2018 and 2019 financials are not presented on a pro-forma basis for CORSAIR’s acquisitions of Elgato in 2018 and Origin and SCUF in 2019.
1 Reflects preliminary and unaudited estimates for the year ended December 31, 2020 based on currently available information. This is not a comprehensive statement of our financials results and is subject to completion of our closing process.
Actual results may differ materially from these estimates. Estimates should not be viewed as a substitute for our full annual financial statements, and are not necessarily indicative of the results to be expected for any future period.
27GROSS MARGIN EXPANSION IN BOTH OUR SEGMENTS
SEGMENT GROSS PROFIT SEGMENT GROSS MARGIN
YoY $465
Growth 35%
YoY 108% 31%
Growth 190
27%
16%
$224 21%
$193 133% 24%
11% 81
73 17%
276
20% 143 93%
119
2018 2019 2020 2018 2020
Gamer and Creator Peripherals Gaming Components and Systems Total
Source: Company Management
Note: Financials in $mm. 2018 and 2019 financials are not presented on a pro-forma basis for CORSAIR’s acquisitions of Elgato in 2018 and Origin and SCUF in 2019.
28EXPANDING EBITDA WITH LOW CAPEX
Adjusted EBITDA (1) 213
67 72
2018 2019 2020 (2)
EBITDA Margin 7.2% 6.5% 12.5%
Capex Spend
0.9% 0.8% 0.5%
(% of Revenue)
Source: Company Management. Note: Financials in $mm.
1 Adjusted EBITDA is determined by adding back to GAAP net income (loss) the acquisition accounting impacts related to recognizing acquired deferred revenue and inventory at fair value, stock-based compensation, certain acquisition-related
and integration-related expenses, change in fair value of contingent consideration for business acquisition, executive transition costs, non-deferred costs associated with the IPO and the secondary offering, debt modification costs, intangible
asset amortization, depreciation and amortization, interest expense (including loss on extinguishment of debt) and tax expense (benefit). While we believe Adjusted EBITDA provides useful information to investors and others in understanding
and evaluating our operations, we urge you to review the reconciliation of Adjusted EBITDA to our most directly comparable GAAP financial measures set forth in the Appendix to this presentation.
Note: 2018 and 2019 financials are not presented on a pro-forma basis for CORSAIR’s acquisitions of Elgato in 2018 and Origin and SCUF in 2019. 2020 financial figures are preliminary estimates and the review of such figures by the
Company's auditors is not yet complete. As a result, such figures are subject to change.
2 Reflects unaudited numbers for the year ended December 31, 2020 based on currently available information. This is not a comprehensive statement of our financials results and is subject to completion of our closing process. Actual results
may differ materially from these estimates. Estimates should not be viewed as a substitute for our full annual financial statements, and are not necessarily indicative of the results to be expected for any future period.
29Exited 2020 on a Strong Note
Record Full Year Results Q4’20 Y/Y 2020 Y/Y
Net Revenue $556.3 70.4% $1,702.4 55.2%
Net revenue growth of 55.2% to $1.7 billion and
Gross Profit $153.8 118.3% $465.4 107.5%
adjusted EBITDA nearly tripled to $213.0 million, driven
by strong demand across all of our product lines as Gross Profit Margin 27.6% 600 bps 27.3% 690 bps
consumers spend more time working and gaming at Operating Income $58.9 314.2% $158.4 568.0%
home Adjusted Operating
$71.0 166.9% $204.8 211.4%
Income
Gross margin of 27.3%, an increase of 690 basis
points, driven by product mix and lower promotional Net Income $43.0 616.0% $103.2 nm
activity Earnings per Share
$0.43 470.6% $1.14 nm
(diluted)
Adjusted operating income growth of 211.4% to $204.8
Adjusted Net Income $53.0 214.8% $145.0 427.0%
million, driven by increased sales leverage
Adjusted Earnings per
$0.53 150.9% $1.60 354.5%
Cash flow from operations of $170.0 million Share (diluted)
Adjusted EBITDA $72.5 154.7% $213.0 197.5%
Note: $ in millions except EPS and percentages; 2019 was a Net Income loss of $8.4m or $0.11 per share making the year-over-year % comparison not meaningful
30GAMER AND CREATOR PERIPHERALS
Gamer and Creator Peripherals segment net revenue Q4’20 Y/Y 2020 Y/Y
growth of 83.4%, driven by sales of Elgato branded Net Revenue $191.8 104.0% $539.4 83.4%
streaming products, gaming chairs, headsets, and the
contribution from SCUF % of Total Net
34.5% 570 bps 31.7% 490 bps
Revenue
Gamer and Creator Peripherals segment net revenue Gross Profit $68.9 197.7% $189.7 133.2%
was 31.7% of total net revenue, an increase of 490 Gross Profit Margin 35.9% 1130 bps 35.2% 750bps
basis points over 2019
Gamer and Creator Peripherals segment gross profit
was $189.7 million, an increase of $108.4 million
Gamer and Creator Peripherals segment gross margin
was 35.2%, an increase of 750 basis points, driven by
increasing sales of higher margin products, coupled with
less promotional activities
Note: $ in millions except percentages
31GAMING COMPONENTS AND SYSTEMS
Gaming Components and Systems segment net Q4’20 Y/Y 2020 Y/Y
revenue growth of 44.8%, driven by strong sales across
Net Revenue $364.5 56.8% $1,163.0 44.8%
all products that were prompted in part by introduction
of high-performing microprocessors by Intel and AMD % of Total Net
65.5% -570 bps 68.3% -490 bps
Revenue
and graphic cards by AMD and Nvidia
Gross Profit $84.9 79.5% $275.7 92.9%
Gaming Components and Systems segment gross profit Gross Profit Margin 23.3% 290 bps 23.7% 590 bps
was $275.7 million, an increase of 92.9% year-over-
year
Gaming Components and Systems segment gross
margin was 23.7%, an increase of 590 basis points,
driven by increasing sales of higher margin products,
coupled with less promotional activities
Note: $ in millions except percentages
312021 Outlook (1)
Financial Metrics 2021 Guidance
Net Revenues $1.8-1.95 billion
Adjusted Operating Income $205-220 million
Adjusted EBITDA $215-230 million
1. Actual results may differ materially from these estimates. Estimates should not be viewed as a substitute for our full annual financial
statements, and are not necessarily indicative of the results to be expected for any future period.
33DEBT SUMMARY
Repaid $50 million of term loan debt
($ in millions) December 31, 2020
during Q4’20
Cash (excluding restricted cash) $129.5
Repaid $190.4 million of term loan
Term Loan (face value) $326.9 during 2020, retiring $50 million second
Total debt $326.9 lien debt in its entirety during Q3’20
prior to the IPO
$197.4
Net debt
LTM adjusted EBITDA (1) $213.0
Total debt / LTM adjusted EBITDA 1.5x
Net debt / LTM adjusted EBITDA 0.9x
1. See appendix for non-GAAP reconciliations
34APPENDIX
35GAAP TO NON-GAAP RECONCILIATIONS
Three Months Ended Year Ended
December 31, December 31,
2020 2019 2020 2019
Operating Income - GAAP $ 58,893 $ 14,218 $ 158,361 $ 23,707
Acquisition accounting impact related to recognizing acquired deferred
revenue at fair value - 1,067 - 1,067
Acquisition accounting impact related to recognizing acquired inventory at
fair value - 1,604 394 1,604
Change in fair value of contingent consideration for business acquisition 954 (635) 954 (635)
Stock-based compensation 1,510 1,035 5,796 3,848
Intangible asset amortization 8,572 6,571 33,916 30,123
Acquisition-related and integration-related costs 680 1,250 3,156 3,099
Executive transition costs - 444 - 984
Non-deferred IPO and secondary offering costs 428 224 1,633 1,135
Debt modification costs - 836 623 836
Adjusted Operating Income - Non-GAAP $ 71,037 $ 26,614 $ 204,833 $ 65,768
As a % of net revenue - GAAP 10.6% 4.4% 9.3% 2.2%
As a % of net revenue - Non-GAAP 12.8% 8.1% 12.0% 6.0%
36GAAP TO NON-GAAP RECONCILIATIONS
Three Months Ended Year Ended
December 31, December 31,
2020 2019 2020 2019
Net Income (Loss) - GAAP $ 43,043 $ 6,012 $ 103,217 $ (8,394)
Acquisition accounting impact related to recognizing acquired deferred
revenue at fair value - 1,067 - 1,067
Acquisition accounting impact related to recognizing acquired inventory at
fair value - 1,604 394 1,604
Change in fair value of contingent consideration for business acquisition 954 (635) 954 (635)
Stock-based compensation 1,510 1,035 5,796 3,848
Intangible asset amortization 8,572 6,571 33,916 30,123
Acquisition-related and integration-related costs 680 1,250 3,156 3,099
Executive transition costs - 444 - 984
Non-deferred IPO and secondary offering costs 428 224 1,633 1,135
Debt modification costs - 836 623 836
Loss on debt extinguishment 858 - 4,114 -
Non-GAAP income tax adjustment (3,032) (1,567) (8,850) (6,163)
Adjusted Net Income - Non-GAAP $ 53,013 $ 16,841 $ 144,953 $ 27,504
Diluted Net income per share:
GAAP $ 0.43 $ 0.08 $ 1.14 $ (0.11)
Adjusted, Non-GAAP $ 0.53 $ 0.21 $ 1.60 $ 0.35
Shares used to compute diluted net income per share:
GAAP 99,771 79,514 90,577 76,223
Adjusted, Non-GAAP 99,771 79,514 90,577 78,117
37ADJUSTED EBITDA RECONCILIATION
Three Months Ended Year Ended
December 31, December 31,
2020 2019 2020 2019
Net Income (Loss) - GAAP $ 43,043 $ 6,012 $ 103,217 $ (8,394)
Acquisition accounting impact related to recognizing acquired deferred
revenue at fair value - 1,067 - 1,067
Acquisition accounting impact related to recognizing acquired inventory at
fair value - 1,604 394 1,604
Change in fair value of contingent consideration for business acquisition 954 (635) 954 (635)
Stock-based compensation 1,510 1,035 5,796 3,848
Acquisition-related and integration-related costs 680 1,250 3,156 3,099
Executive transition costs - 444 - 984
Non-deferred IPO and secondary offering costs 428 224 1,633 1,135
Debt modification costs - 836 623 836
Intangible asset amortization 8,572 6,571 33,916 30,123
Depreciation 2,613 1,936 9,318 7,384
Interest expense (includes loss on debt extinguishment) 6,021 8,485 35,137 35,548
Tax expense (benefit) 8,676 (360) 18,825 (5,005)
Adjusted EBITDA - Non-GAAP $ 72,497 $ 28,469 $ 212,969 $ 71,594
Adjusted EBITDA margin - Non-GAAP 13.0% 8.7% 12.5% 6.5%
38THANKS!
40You can also read