HALF-YEAR RESULTS 2019 - BUILDING TRAINS WITH PASSION AND SWISS PRECISION - Stadler Rail

Page created by Antonio Duran
 
CONTINUE READING
HALF-YEAR RESULTS 2019 - BUILDING TRAINS WITH PASSION AND SWISS PRECISION - Stadler Rail
HALF-YEAR RESULTS 2019
BUILDING TRAINS WITH PASSION AND
SWISS PRECISION
Dr. Thomas Ahlburg, Group CEO, and Raphael Widmer, Group CFO
3 September 2019
HALF-YEAR RESULTS 2019 - BUILDING TRAINS WITH PASSION AND SWISS PRECISION - Stadler Rail
REPRESENTING STADLER TODAY

                      Dr. Thomas Ahlburg                        Raphael Widmer
                      Group CEO                                 Group CFO

Stadler half-year results 2019 | © Stadler | 3 September 2019                    2
HALF-YEAR RESULTS 2019 - BUILDING TRAINS WITH PASSION AND SWISS PRECISION - Stadler Rail
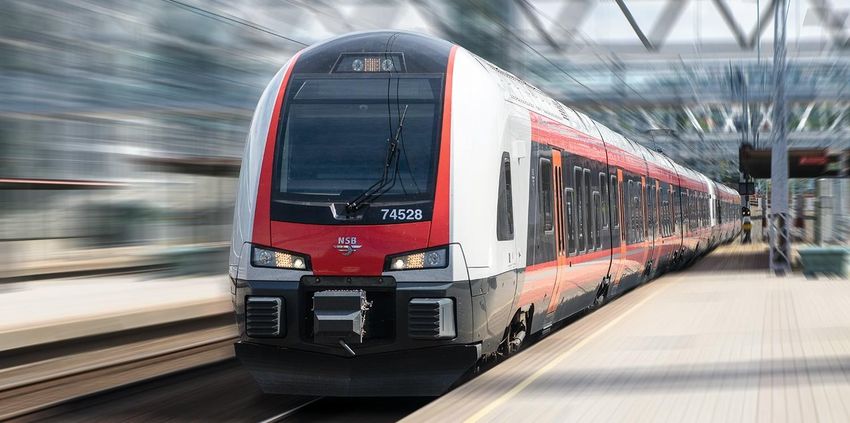
AGENDA

  1         Introduction and highlights                         Dr. Thomas Ahlburg, Group CEO

  2         Half-year financial results 2019                       Raphael Widmer, Group CFO

  3         Summary and outlook                                 Dr. Thomas Ahlburg, Group CEO

Stadler half-year results 2019 | © Stadler | 3 September 2019                                   3
HALF-YEAR RESULTS 2019 - BUILDING TRAINS WITH PASSION AND SWISS PRECISION - Stadler Rail
INTRODUCTION AND HIGHLIGHTS
Dr. Thomas Ahlburg, Group CEO
HALF-YEAR RESULTS 2019 - BUILDING TRAINS WITH PASSION AND SWISS PRECISION - Stadler Rail
HALF-YEAR 2019 KEY FIGURES

                                                                             Order intakeOrder intake                                              OrderNet
                                                                                                                                                         Backlog
                                                                                                                                                            revenues
                                                                             CHF X.Xbn
                                                                                     CHF 2.3bn                                                     CHFCHF
                                                                                                                                                       XXbn
                                                                                                                                                          1.1bn(2)
                                                                             +XX%    +178%(1)                                                      +XX%
                                                                                                                                                      +40%(1)

                                                                                                  Order backlog                                             EBIT
                                                                                                  CHF 14.4bn                                                CHF 46.9m(2)
                                                                                                  +9%(3)                                                    +33%(1)

(1)   Change year-on-year.
(2)   Note that net revenues, EBIT, and EBIT margins are subject to strong seasonal effects and are in line with seasonal patterns experienced historically. Please see slides 12 and 16 for more details.
(3)   Change in relation to 31 December 2018.
Stadler half-year results 2019 | © Stadler | 3 September 2019                                                                                                                                                5
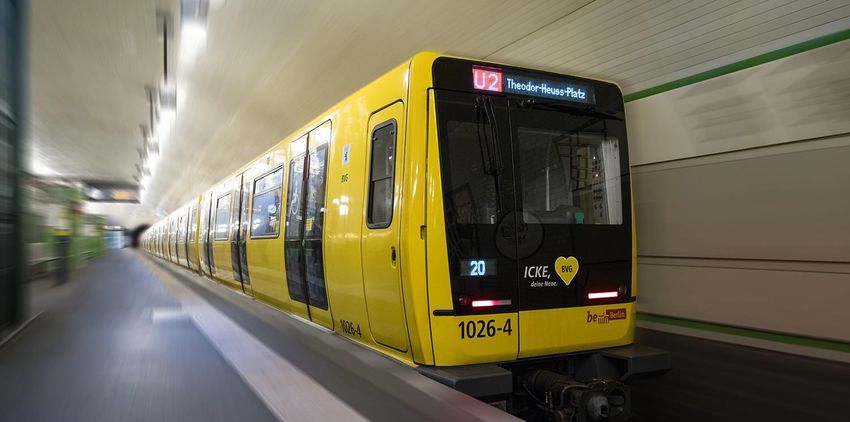
HALF-YEAR RESULTS 2019 - BUILDING TRAINS WITH PASSION AND SWISS PRECISION - Stadler Rail
STADLER AT A GLANCE

                   >8,000 Stadler trains and locomotives operate in 41 countries every day

                    >170            million kilometres covered every year by vehicles serviced by Stadler

                       12           core sites across high- and low-cost countries

                c. 10,500 employees, including engineering team of over 1,500 employees1

                      ~7%           net revenues CAGR over the last decade2

                   27,000           registered shareholders following successful IPO in April 2019

1     Average FTEs H1 2019.
2     2008-2018.
Stadler half-year results 2019 | © Stadler | 3 September 2019                                        6
HALF-YEAR RESULTS 2019 - BUILDING TRAINS WITH PASSION AND SWISS PRECISION - Stadler Rail
COMPREHENSIVE PORTFOLIO OF VEHICLE FAMILIES

    Market segments and vehicle families                                                                                          Order backlog contributions (H1 2019)

                        Market                                                                                                                    Reporting segment
     Type                                                               Vehicle families
                       segment

                      Very High                                                                                                         19%
                                                                       Not a strategic focus
                       Speed                                                                                                                                     Rolling Stock
                                                                                                                                                                 Service & Components
                     High Speed
                                                                                                                                                  81%

                                   1
     Trains            Intercity                                                                                                                   Market segment2

                      Regional /                                                                                                                                 Trains
                      Suburban
                                 1                                                                                                       17%
                                                                                                                                                                 Locomotives

                                                                                                             Services & Systems
                                                                                                                                      11%                        Metro
                       Coaches                                                                                                          6%          57%          LRV
                                                                                                                                        4%

                                                                                               Tailor-made
                                                                                                                                                                 Tailor-made
                                                                                                                                        4%
                      Main-line                                                                                                                                  Service & Components
                    locomotives
     Loco-
    motives                                                                                                                                       Regional markets
                      Shunting
                    locomotives                                                                                                                                  DACH
                                                                                                                                           7%
                                                                                                                                       9% 2%                     Western Europe
HALF-YEAR RESULTS 2019 - BUILDING TRAINS WITH PASSION AND SWISS PRECISION - Stadler Rail
AN ESTABLISHED LEADER IN OUR HOME MARKETS

                                                            Stadler’s strategic markets – competitive landscape
 Focus markets                                                         Home markets                                                                                  Opportunistic markets
                   North America: €4bn                                                                 Europe: €11bn                                                                         CIS: €5bn
           5%                                                                                             Others                                                          0%
                                                                          12% HS                                                                                         10%
                                                                                                          13%                                                            12%             Others Transmashholding
           29%            Others GE Transportation                                                PESA                                                                           Stadler
                                                                                                                                              Bombardier                  5%
                   Stadler                                                                        CAF 2%                               26%                                      Alstom       13%
                                                                                                                                                                                           1%
               KinkiSharyo 14% 27%                                                                     3%                                                                     Siemens
                                                                                                                                                                                          4%
           13%             4%                                             54% MU                                                                                              Mobility 4%
                 Siemens                                                                     Hitachi
                           6%                                                                        8%
                 Mobility                                                                       Rail                                                                     54% GE Trans- 5%
                            15%                                                                                                                                              portation 6%           55%
                     EMD             17%                                                                                                                                          Talgo
           45%
                                         Bombardier                         7% Metro Siemens                                                                                               12%
                               16%                                                    Mobility 13%                                                Alstom
                                                                           12% LRV                                                   19%
                            Kawasaki                                                                                                                                                       Sinara
                              Heavy                                        11% Locomotives                                                                               19%
            8%                                                              3% Coaches
                            Industries                                                                                 15%
                                                                                                               Stadler

                                                                       Opportunistic markets
                                                                              RoW (excl. East Asia and Australia): €8bn

                                                                                0%                                                            CRRC
             Stadler is…1                                                      15%                                                  22%
 Region

                                                                               28%             Others        39%
             •   No. 3 in Europe
                                                                                4%                                                       10%       Alstom
             •   No. 2 in EMU
 Segment

                 globally                                                      35%                                                     8%
                                                                                                                    6%            8%           DLW
             •   No. 4 in DMU                                                                                             7%
                 globally                                                      17%
                                                                                                           RCF
                                                                                                                      CLW          ICF
Source: SCI (2018).
Bar charts represent market structure by product, pie charts represent market share by player.
Market volumes as at 2017 based on € value of equipment delivered. 2017 market size defined as average of 2016-2018.
Market segment values as at 2017 (based on market value in €). Market shares based on units delivered between 2013 and 2017, weighted by market segment value.
Very High Speed trains (VHS) defined as trains with top speed above 251km/h.
East Asia defined as China + South Korea + Japan. Rest of the World (RoW) includes Asia (excluding East Asia), South and Central America, Middle East and Africa.
EMD: Electro-Motive Diesel; DLW: Diesel Locomotive Works; ICF: Integral Coach Factory; CLW: Chittaranjan Locomotive Works; RCF: Rail Coach Factory; EMU: electrical multiple units; DMU: diesel multiple units.
1      Measured on the basis of Stadler’s strategic markets.
Stadler half-year results 2019 | © Stadler | 3 September 2019                                                                                                                                                     8
HALF-YEAR RESULTS 2019 - BUILDING TRAINS WITH PASSION AND SWISS PRECISION - Stadler Rail
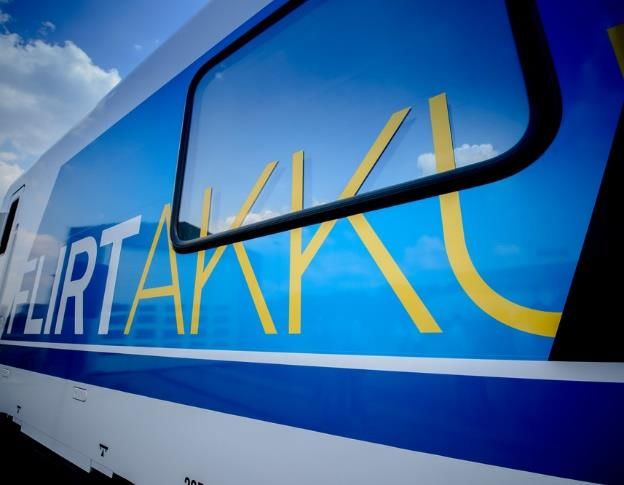
HALF-YEAR 2019 ORDER HIGHLIGHTS
 Rolling Stock                                                  Service & Components                  Pending orders

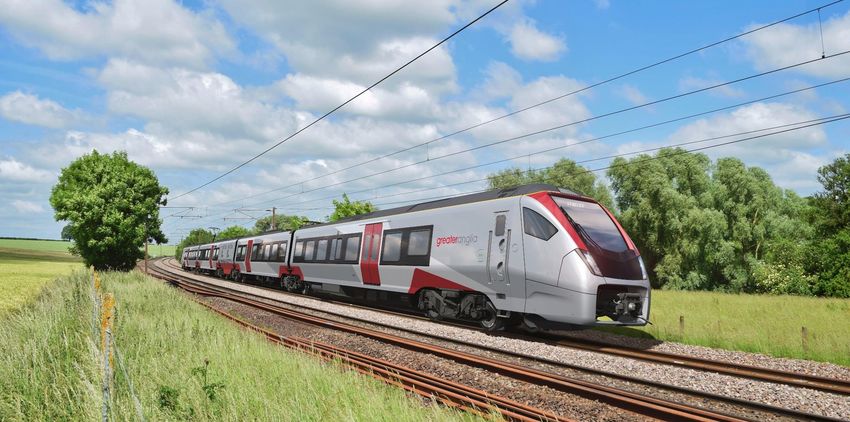
 55 battery-powered FLIRT Akku                                  CHF 100m service contract for         US Metro contract for MARTA
  Presented for the first time at                              over 100 trains in Norway             (Atlanta)
     InnoTrans 2018, Stadler has                                 Milestone service contract           Largest order by number of
     managed to win a major contract                               underpinning our strategic focus       vehicles in Stadler’s history
     within a very short time                                    Largest fleet under contract and     Valued at over USD 600m
  Contract includes vehicle                                       first full-service order from a    BVG Metro Berlin
     maintenance for 30 years                                      state-run operator                  We have participated in the
 60 locomotives for VR Group                                    30-year maintenance for 55 FLIRT          tender, but the final award
  Successful entry into the Finnish                            Akku vehicles ordered in                  decision has been delayed due
     market with a contract valued                              Germany                                   to a bidder's appeal
     approx. EUR 200m                                                                                 80 TRAMLINK trams for Milan
 Further expansion of the market                                Two large service orders in           framework contract
 position in Canada with first                                  Germany from Bogestra and
 FLIRT order for Ottawa                                         Netinera

Stadler half-year results 2019 | © Stadler | 3 September 2019                                                                             9
HALF-YEAR RESULTS 2019 - BUILDING TRAINS WITH PASSION AND SWISS PRECISION - Stadler Rail
HALF-YEAR FINANCIAL RESULTS 2019
Raphael Widmer, Group CFO
HALF-YEAR RESULTS 2019 SUMMARY
Key figures
CHFm

    Order intake                                                                   Net revenues                                                                     Order backlog

                              +178%                                                                            +40%                                                                               +9%
                                                   2’310                                                                           1’115                                                                           14’383
                                                                                                                                                                            13’179
                                                                                              798

              831

            H1 18                                 H1 19                                     H1 18                                 H1 19                                  31-Dec-18                                  H1 19

    EBIT                                                                          Capex                                                                             Net working capital1

                              +33%
                                151                                                                           +208%
                                                                                                                                    154
                               7.5%
      4.4%                                              4.2%                                                                                                                                                         -105
                                                           47                                  50
        35

                                                                                                                                                                               -323
      H1 18                 FY 2018                    H1 19                                H1 18                                 H1 19                                  31-Dec-18                                  H1 19
               EBIT as % of net revenues                                                      Change reported
1     Net working capital is calculated by subtracting the sum of trade payables, liabilities from work in progress and other current liabilities (including other current liabilities, current provisions, and deferred income and accrued
      expenses) from the sum of trade receivables, inventories, work in progress, and other current assets (including other current receivables, compensation claims from work in progress, and accrued income and deferred expenses).
Stadler half-year results 2019 | © Stadler | 3 September 2019                                                                                                                                                                            11
STRONG TOP LINE
Strong order intake and revenue growth in the first half of the year
CHFm

   Order intake                                                                 Net revenues
                           +178%
                                          2’310

                                            603          Service & Components

                                                                                               +40%
                                                                                                      1’115
                                                                                                       113
                831                                                                  798
                                          1’708          Rolling Stock
                249                                                                  103
                                                                                                      1’002
                582                                                                  695

               H1 18                      H1 19                                     H1 18             H1 19

   Comments

    Surge in order intake in Rolling Stock as well as Service & Components compared to the same period last year
    Significant growth in order intake in Stadler’s home markets in Europe as well as in the North American strategic
     focus market (Ottawa, DART)
    Net revenues continue to follow their typical seasonal patterns
    Year-on-year growth of 44% in Rolling Stock net revenues and 10% in the Service and Components business
    Stable revenue development in the DACH region coupled with strong revenue growth in all other geographical
     markets

Stadler half-year results 2019 | © Stadler | 3 September 2019                                                            12
RECORD ORDER BACKLOG
Continued strong order intake drives a record order backlog of CHF14.4bn
CHFm

                                       +9%                                                                    +9%

                                             14’383                                                                   14’383
                  13’179                                                                           13’179                 347
                                                                                        Others1                     1’046
                                             2’713        Service & Components                         284
                    2’262                                                             Americas    916                  1’305
                                                                                                    1’113
                                                                                 Eastern Europe
                                                                                                                      5’453
                                                                                 Western Europe     5’434

                  10’917                     11’669       Rolling Stock

                                                                                         DACH       5’432             6’231

               31-Dec-18                     H1 19                                                31-Dec-18           H1 19

    Comments

     A growing order backlog in both reporting segments and across regions
     Note: the order backlog as at 30 June does not include a number of projects already announced such as:
          a pending order from MARTA (Atlanta) valued at over USD 600m
          a framework agreement to supply 80 TRAMLINK trams for Milan with an initial order for 30 vehicles

1     Others: CIS and rest of the world.
Stadler half-year results 2019 | © Stadler | 3 September 2019                                                                   13
ROLLING STOCK
Strong order intake drives a new record order backlog

CHFm                                                                           H1 2018          H1 2019          Change
 Order intake                                                                      582             1’708            194%
 Order backlog                                                                  10’9171           11’669                 7%
 Net revenues (third party)                                                        695             1’002             44%

 Investments in fixed assets                                                        32              105             230%
 Total staff as FTEs2                                                            6’412             8’147             27%

    Comments

     Significant step-up in the first six months of 2019 compared to the first half of 2018
     Revenue growth in line with planned expansion
     Significant increase in FTEs and investments in fixed assets to provide capacity for execution according to plan

1     As at 31 December 2018.
2     Average FTEs 1 January to 30 June.
Stadler half-year results 2019 | © Stadler | 3 September 2019                                                             14
SERVICE & COMPONENTS
Strong order intake drives a new record order backlog

 CHFm                                                                        H1 2018          H1 2019   Change
 Order intake                                                                    249             603      142%
 Order backlog                                                                 2’2621           2’713     20%
 Net revenues (third party)                                                      103             113      10%

 Investments in fixed assets                                                      11              17      59%
 Total staff as FTEs2                                                           1’724           2’163     25%

    Comments

     Surge in order intake and backlog predominantly driven by long-term service contracts
     Solid year-on-year growth in net revenues
     Investments and FTEs follow strong order and revenue trend

1     As at 31 December 2018.
2     Average FTEs 1 January to 30 June.
Stadler half-year results 2019 | © Stadler | 3 September 2019                                                15
EBIT
EBIT grows 33% year-on-year at slightly lower margin
CHFm

                                                                             +33%
                                                                  9.6%
                   160                                                                  151                         10%
                   140                                                                  7.5%
                                                                   116                                              8%
                   120
                   100                                                                                              6%
                     80                 4.4%                                                          4.2%
                     60                                                                                             4%
                                                                                                       47
                     40                   35
                                                                                                                    2%
                     20
                      0                                                                                             0%
                                        H1 18                     H2 18               FY 2018         H1 19
                                                                EBIT      EBIT in % of net revenues

   Comments

    EBIT increases by 33% year-on-year driven by strong revenue growth
    Sequential EBIT decline versus H2 2018 in line with expectations and the typical seasonality of our business
    EBIT margin slightly lower mainly due to:
         adverse foreign currency impacts
         effects of changes in the regional mix
         production ramp-up related to additional orders

Stadler half-year results 2019 | © Stadler | 3 September 2019                                                             16
NET INCOME

            (in CHFm)                                                H1 2018            H1 2019           Change
            Earnings before interest and taxes (EBIT)                   35.2               46.9              33%
            Financial result                                           (21.3)             (11.7)
            Share of results from associates                             1.0                1.4
            Ordinary result                                             14.8               36.6             147%
            Non-operating result                                         -                 (0.9)
            Profit before income taxes                                  14.8               35.7             141%
            Income taxes                                                (7.3)              (8.2)
            Profit for the period                                        7.6               27.5             263%
            thereof attributable to
               - Shareholders of Stadler Rail AG                         7.0              26.9
               - Non-controlling interests                               0.6               0.6

   Comments

    Financial result mainly driven by movements in foreign currencies
    Tax rate as % of profit before taxes: 23.0% (H1 2018: 48.9%)
    Semi-annual tax rates not representative of the full year and typically impacted by technical and seasonal effects

Stadler half-year results 2019 | © Stadler | 3 September 2019                                                             17
HIGH LEVEL OF GROWTH INVESTMENTS
Capital expenditure1 (CHFm)

                                                                                                               188

                                                                                                                       154

                                                                                                                                +208%
                                                                               76
                                                 55                                                     50

                                              2016                          2017                       H1 18   2018   H1 2019

    Comments

     Significant investments supporting Stadler’s anticipated growth
     Major capacity investments during the first six months of 2019:
            St. Margrethen, Switzerland
            Herne, Germany
            Salt Lake City, USA

1     Capital expenditure is calculated as the sum of investments in tangible and intangible assets.
Stadler half-year results 2019 | © Stadler | 3 September 2019                                                                           18
NET WORKING CAPITAL
Net working capital1 (CHFm)

                                       163           Trade receivables
         252
                                       352           Compensation claims from WIP                                                                                                                                                                                 28                          -105
         280                                                                                                                                                                                                                                     26
                                                                                                                                                                                                                          36
                                       266           Inventories
         261                                                                                                                                                                                     139
                                                     Other current assets
          86                           122                                                                                                                                         6
                                                                                                               -323          (89)                   72

                                                                                                                 NWC 2018

                                                                                                                                                                                                                                                                                               NWC H1 2019
                                                                                                                                                                                   Inventories
                                                                                                                                                    Compensation claims from WIP

                                                                                                                                                                                                                                                 Trade payables

                                                                                                                                                                                                                                                                  Other current liabilities
                                                                                                                                Trade receivables

                                                                                                                                                                                                                          Other current assets
                                                                                                                                                                                                 Work in progress (net)
                                      -618           Work in progress (net)
        -757

                                      -148           Trade payables
        -174                          -241           Other current liabilities
        -269                          -105
        -323
    31-Dec-18                      H1 2019

    Comments

     Temporarily higher level of net working capital (NWC) in line with the typical seasonal pattern of our business
     Increase in NWC mostly due to higher net work in progress as a result of production ramp-up

1     Net working capital is calculated by subtracting the sum of trade payables, liabilities from work in progress and other current liabilities (including other current liabilities, current provisions, and deferred income and accrued
      expenses) from the sum of trade receivables, inventories, work in progress, and other current assets (including other current receivables, compensation claims from work in progress, and accrued income and deferred expenses).
Stadler half-year results 2019 | © Stadler | 3 September 2019                                                                                                                                                                                                                                                19
NET CASH
                                                            532

                                                                      161

                                                            695
                                                                      499        Cash and cash equivalents

                                                            -82       -103       Non-current financial liabilities
                                                            -81
                                                                      -236       Current financial liabilities

                                                     31 Dec 2018   30 Jun 2019

   Comments

    Lower net cash position as a result of usual seasonal patterns combined with higher working capital needs amid
     the ramp-up of manufacturing across the Group
    Increase in current financial liabilities mainly due to:
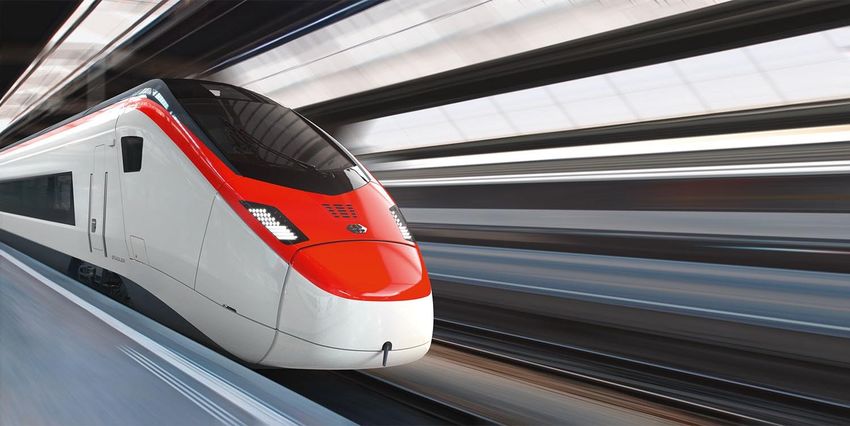
        short-term project financing (as expected) largely related to our SMILE contract with SBB
        partial delays of final customer acceptance for certain vehicles within the East Anglia contract

Stadler half-year results 2019 | © Stadler | 3 September 2019                                                         20
SUMMARY AND OUTLOOK
Dr. Thomas Ahlburg, Group CEO
KEY MACRO ECONOMIC TRENDS SUPPORTING
GROWTH OF RAILWAY SECTOR
    Global demand for transportation is growing…1

                                         Continuing upward trend in population
     Population
                                             ― c.83 million people are being added to the world’s population every year
      growth
                                         By 2050, worldwide population is estimated to increase to c.9.8 billion (+29% from 2018)

                                         Number of megacities with more than 10 million inhabitants in the world is expected to reach 43 by
    Urbanisation                          2030, mostly in developing countries
                                         By 2050, c.68% of population is estimated to live in urban areas (+13% from 2018)

    …with strong tailwind for the rail sector…2

                                         Rail travel produces the least amount of CO2 emissions by travel amongst major means of transport:
Environmental                             rail at 14g per passenger km vs. car at 104g and plane at 285g
 awareness
                                         Adoption of more restrictive regulations on car use in large urban areas

                                         Increasing air and road congestion expected to foster shift towards rail transport
     Demand for
                                         High-speed rail market expected to continue to gain share from airlines due to greater convenience
    rail transport

                                         Liberalisation in many established markets driven by commercial reasons and rollout of EU regulations
       Market
                                         Domestic railway operations in EU member states to be opened to competitive entry from December
    liberalization
                                          2019

    …with trains as a core part of Mobility 4.0

                                         We do not see autonomous cars taking market share from rail transportation because:
    Autonomous
                                             ― Rail transportation provides better space efficiency and superior capacity
        cars
                                             ― Rail transportation will continue to maintain edge on time-to-travel
1      Source: United Nations.
2      Source: European Environment Agency, SCI (2018).
Stadler half-year results 2019 | © Stadler | 3 September 2019                                                                                  22
WE HAVE A CLEAR STRATEGY FOR BRINGING
STADLER TO THE NEXT LEVEL
                                   Stadler sales today                                                     Stadler strategy 2023
                                                                                                                Signalling
                            Service &
                           Components
                                                                                             Service &
                                                                                            Components

                                                   Rolling                                                                      Rolling
                                                   Stock                                                                        Stock

                                                                          Strategic focus

                                                                                          Service &
                                                         Rolling Stock                                                        Signalling
                                                                                         Components
                                                     •   Market segments             •   Growing                        •    Establish own
               Europe                                    unchanged                       accessible market                   signalling
                                                                                         and installed base                  solutions
                                                     •   Deliver on
                                                         backlog and                 •   New service                    •    AngelStar JV with
               North America
   Regions

                                                         establish next                  solutions                           Mermec
                                                         sales level
                                                                                     •   Capture                        •    Potential
                                                     •   Growth through                  opportunities                       opportunistic
               CIS
                                                         new product                     from signalling                     acquisitions
                                                         pipeline
                                                                                     •   Potential selective
               New markets                                                               acquisitions

Note: Sizes of pie charts are illustrative only.
Stadler half-year results 2019 | © Stadler | 3 September 2019                                                                                    23
OUTLOOK

                               Outlook for 2019 given at the time of the IPO broadly confirmed
                                We expect net revenues of approximately CHF 3.5bn excluding foreign currency impacts and
                                 an EBIT margin of 7%

                               Effects impacting guidance for 2019
                               East Anglia contract
                                Homologation process completed in record time but partial delay of final customer acceptance
         Outlook                  for certain vehicles within the East Anglia contract due to third-party supplier product
          2019                  Potential risk of penalties

                               Selected external effects potentially impacting our business performance
                                Strong appreciation of the Swiss franc
                                Brexit, and a hard Brexit in particular
                                Further escalation of protectionist tendencies and international trade conflicts as well as a
                                 general macroeconomic slowdown

Stadler half-year results 2019 | © Stadler | 3 September 2019                                                                    24
Q&A

Stadler half-year results 2019 | © Stadler | 3 September 2019   25
APPENDIX
INFORMATION

Share information                                                           Investor contact

Listing:                                 SIX Swiss Exchange                 Raphael Widmer
Currency:                                CHF                                Group CFO
Ticker symbol:                           SRAIL                              Phone:   +41 71 626 86 80
ISIN:                                    CH0002178181                       E-mail:  ir@stadlerrail.com
Listing date:                            12 April 2019
                                                                            Daniel Strickler
                                                                            Investor Relations Officer
                                                                            Phone:     +41 71 626 86 47
                                                                            E-mail:    ir@stadlerrail.com

Financial calendar                                                          Media contact

March 2019:                         Publication of full-year results 2019   Marina Winder
30 April 2019:                      Annual General Meeting                  Head of Communications & PR
August 2020:                        Publication of half-year results 2020   Phone:    +41 71 626 31 57
                                                                            E-mail:   marina.winder@stadlerrail.com

Stadler half-year results 2019 | © Stadler | 3 September 2019                                                  27
SEGMENT BREAKDOWN

                                                                  H1 2018                                                    H1 2019
                                        Rolling         Service &       Corporate                        Rolling       Service &    Corporate
      CHFm                                                                              Total                                                     Total
                                        Stock          Components        Center                          Stock        Components     Center

       Order intake                            582               249          -             831             1’708           603           -         2’310

       Total revenue                           708               221         (132)          798              1’027          284          (196)       1’115
       Inter-segment revenue                    (14)            (118)         132               -              (25)         (171)         196             -
       Net revenue                             695               103              (0)       798             1’002           113           -         1’115

       Investments in PPE                        32               11              2                 45        105            17               2       125

       Total FTE                             6’412              1’724         158         8’294             8’147          2’163          181      10’491

Stadler half-year results 2019 | © Stadler | 3 September 2019                                                                                                 28
CONSERVATIVE SALES RECOGNITION
Percentage of Completion Method: Units-of-delivery method
                                        Phase I:                         Phase II:                     Phase III:              Phase IV:                  Phase V:
                                        Signing                         Engineering                  Manufacturing             Delivery                   Warranty

       Project
       phases                               6m                                 1y                        1.5y                       3-4y                    3-6y

                                 Milestone payments                                 Milestone payments                    Delivery payment
                                     (10% - 30%)                                        (70% - 75%)                          (5% - 15%)    % of total payments(1)

                                                                                                                                                            Cash in

    Cash flows                                                                                                                                              Cash out

                                                                                                                                                            Net cash

                                                                                                                     80% of units          20% of units
                                                                                                                      delivered2            delivered2
      Sales
   recognition

                                                                                                                         3y                Thereafter

                             •   Pressure on management: sales recognition is the result of successfully executing orders as opposed to incurring costs
     Rationale
                             •   Conservative approach: sales are recognised relatively late and risk of earnings surprises is minimized

1 Average values based on management estimates; distribution varies on a project-by-project basis.
2 Average values based on management estimates.
Stadler half-year results 2019 | © Stadler | 3 September 2019                                                                                                         108
WORK IN PROGRESS
                 791
      593
                                           31-Dec-18
                                           H1 2019

                                                                         (618)
                                                                 (757)                                         (59)
                                                                                                   198                       (618)

                                (1’350) (1’409)                                      (757)
 Assets from WIP                    Liabilities                 Total WIP (net)   WIP (net) 31   ▲Assets    ▲Liabilities   WIP (net)
                                    from WIP                                       Dec 2018      from WIP   from WIP       H1 2019

   Comments

    Continuously negative net work in progress (WIP)
    Increasing WIP as a result of a major production ramp-up

Stadler half-year results 2019 | © Stadler | 3 September 2019                                                                          30
DISCLAIMER
IMPORTANT NOTICE

This presentation (the "Presentation") has been prepared by Stadler Rail AG ("Stadler" and, together with its subsidiaries, "we", "us" or the "Group") and includes forward-looking
information and statements concerning the outlook for our business. These statements are based on current expectations, estimates and projections about the factors that may
affect our future performance, including global economic conditions, and the economic conditions of the regions and markets in which the Group operates. These expectations,
estimates and projections are generally identifiable by statements containing words such as “expects,” “believes,” “estimates,” “targets,” “plans,” “outlook” or similar expressions.

There are numerous risks and uncertainties, many of which are beyond our control, that could cause our actual results to differ materially from the forward-looking information and
statements made in this Presentation, which, in turn, could affect our ability to achieve our stated targets. The important factors that could cause such differences include:
changes in the markets the Group serves, including as a result of changes in the global demand for transportation and demographic changes; the Group's ability to successfully
develop, launch and market new products and services; the Group's ability to retain existing customers and/or secure new customers; the Group's ability to compete with existing
and new competitors; the Group's ability to maintain the high quality, reliability, performance and timely delivery of its products and services; the impact of fluctuations in foreign
exchange rates; and such other factors as may be discussed from time to time. Although we believe that our expectations reflected in any such forward-looking statement are
based upon reasonable assumptions, we can give no assurance that those expectations will be achieved.

PRESENTATION OF FINANCIAL INFORMATION
This Presentation has been prepared by Stadler solely for informational purposes. Certain financial data contained herein is based on historical financial information of Stadler
that has been prepared in accordance with the accounting standards of Swiss GAAP FER, unless otherwise stated. In addition, certain financial data included in the Presentation
consists of "non-Swiss GAAP financial measures". These non-Swiss GAAP financial measures may not be comparable to similarly titled measures presented by other companies,
nor should they be construed as an alternative to other financial measures determined in accordance with Swiss GAAP. You are cautioned not to place undue reliance on any
non-Swiss GAAP financial measures and ratios included herein.

In addition, certain financial information contained herein has not been audited, confirmed or otherwise covered by a report by independent auditors and, as such, actual data
could vary, possible significantly, from the data set forth herein.

THIS PRESENTATION IS NOT AN INVITATION TO PURCHASE SECURITIES OF STADLER OR THE GROUP.
.

Stadler half-year results 2019 | © Stadler | 3 September 2019                                                                                                                       31
You can also read