WELCOME TO THE PSCU PAYMENTS INDEX

Page created by Cory Gregory
 
CONTINUE READING
WELCOME TO THE PSCU PAYMENTS INDEX
July 2021 ■ 1

WELCOME TO THE PSCU PAYMENTS INDEX
As we introduce the fourth installment of the PSCU Payments Index, we find our
country at a key inflection point in its battle against the COVID-19 pandemic – and
its long-reaching effects on the U.S. economy.

After many parts of our nation had seemingly turned a corner and began to emerge
from the pandemic over the course of the summer, slowing vaccination rates could
lead to regional pockets of increases in COVID cases. The Delta variant now looms
large as children prepare to return to school and many workers prepare to return to
offices. Employers are grappling with “The Great Resignation,” labor shortages and
rising wages. Even whoever coined the famous “May you live in interesting times”
adage could not have envisioned the past 16 months.

Despite these challenges, we continue to see positive signs of economic recovery
and increased consumer spending and confidence. In the July 2021 edition of
the PSCU Payments Index, we take a deep dive into this year’s Amazon Prime Day
event, held June 21-22, as well as the competing events from major U.S. retailers
Target and Walmart. We hope that the insights and demographic data from these
events, one of the largest retail shopping periods of the year, will help our financial
institutions make informed decisions and help keep their cards in the coveted top-
of-wallet position for consumers.

Click here to subscribe to the PSCU Payments Index and receive updates
when we publish each month.
WELCOME TO THE PSCU PAYMENTS INDEX
PSCU Payments Index                                                                                                                                                                                            July 2021 ■ 2

       MONTHLY PERFORMANCE                                                           sizeable uptick from approximately 13,200 at this
       While there were no dramatic fluctuations                                     time last month following a spike in new cases after
       in consumer behavior among our same-store                                     the Fourth of July holiday, yet still far below the high                       OVERALL PERFORMANCE
                                                                                     of more than 250,000 in January 2021.                                                        June (Month 6)
       population in June, spending remains strong, buoyed
       by the annual summer savings events (Amazon Prime                                                                                                PURCHASES                                      TRANSACTIONS
                                                                                     Additionally, the Bureau of Labor Statistics on July 2
       Day, Target Deal Days and Walmart Deals for Days)                                                                                               2021 VS. 2019                                       2021 VS. 2019
                                                                                     that job creation for June was 850,000, above the
       covered in this month’s Deep Dive. At the same time,
                                                                                     May number. The June unemployment rate showed
       continuing uncertainty around the pandemic and
                                                                                     little change at 5.9%, and the Department of Labor          Debit            Credit                            Debit             Credit
       the expiration of several pandemic-related benefits –
                                                                                     reported new claims for unemployment benefits              arrow-up 36%     arrow-up 26%                      arrow-up 15%      arrow-up 14%
       coupled with continued rising prices on housing and
                                                                                     remained just below 400,000 for the week ending
       automobiles, among others – have some consumers
                                                                                     July 3.
       taking a more cautious, “wait-and-see” approach.
                                                                                                                                                       2021 VS. 2020                                       2021 VS. 2020
       According to data released by the Labor Department
                                                                                     LOOKING AHEAD
       on July 13, the Consumer Price Index rose 0.9% in                                                                                         Debit           Credit                             Debit            Credit
                                                                                     While it is too soon to see clear economic impacts
       June and 5.4% year over year, marking its highest
                                                                                     from states (26 as of July 12) announcing an early         arrow-up16%      arrow-up 32%                      arrow-up13%       arrow-up 25%
       growth in 13 years. New and used vehicle pricing
                                                                                     end to pandemic-related federal unemployment
       continued to surge, while other categories including
                                                                                     benefits, we will continue to monitor this and the
       hotels, car rentals, apparel and airfare notably
                                                                                     effects of other employment trends – including                    2020 VS. 2019                                       2020 VS. 2019
       contributed to the increase.
                                                                                     labor shortages, rising wages and slower hiring
                                                                                     rates – on consumer behavior. At the same time,             Debit           Credit                             Debit            Credit
       As of July 13, the CDC reports that 59% of the
       U.S. adult population is fully vaccinated against
                                                                                     we will also monitor the impact of Child Tax Credits       arrow-up18%       arrow-down 4%                     arrow-up2%        arrow-down 9%
                                                                                     provided by the IRS, which began this week, as well
       COVID-19 and 68% have had at least one dose,
                                                                                     as the ending of the CDC’s moratorium on evictions,
       falling short of President Biden’s goal of 70% by July
                                                                                     which is now set to end on July 31, 2021.
       4. At the same time, the seven-day average of daily
       cases in the U.S. has increased to nearly 15,500, a

          Payments ■ Risk Management ■ Digital Banking ■ Data Science and Analytics ■ Loyalty ■ Mobile and Online Card Management
7.21      Contact Center Services and Solutions ■ Strategic Consulting ■ Cross-Channel Marketing Solutions ■ Delinquency Management
WELCOME TO THE PSCU PAYMENTS INDEX
PSCU Payments Index                                                                                                                                                                                   July 2021 ■ 3

       KEY TAKEAWAYS
       ■   While June CPI-U jumped to an annual rate of 5.4%, its largest increase since 2008,
           assistance from the U.S. Government – approaching nearly $6 trillion since the start of
           the pandemic – has fueled demand and put substantive impacts on supply chains.

       ■   No dramatic fluctuations in consumer behavior were seen in June, although consumer
                                                                                                                                                                While we did not see dramatic fluctuations in consumer
           spending continues to show strength. Continuing uncertainty around the pandemic                                                                      behavior in this month’s Payments Index, spending
           and the expiration of several pandemic-related benefits have some consumers taking a                                                                 remains strong, even as continuing uncertainty around the
           more cautious, “wait-and-see” approach.
                                                                                                                                                                pandemic and the expiration of several pandemic-related
       ■   Card payments growth remains strong, supported by large retailer summer savings                                                                      benefits have some consumers taking a more cautious,
           events (this month’s Deep Dive). Of the three large retailer summer savings events in
                                                                                                                                                                ‘wait-and-see’ approach. This month’s Deep Dive, in
           June (Amazon Prime Day, Target Deal Days and Walmart Deals for Days), Target posted
           the biggest percentage of growth in year-over-year purchases over the comparative
                                                                                                                                                                which we explore the continued growth of Amazon Prime
           two-day Prime Day event period.                                                                                                                      Day and its competing events at major U.S. retailers, along
                                                                                                                                                                with accompanying demographic data, showcases PSCU’s
       ■   Across all three merchants (Amazon, Target and Walmart) by age demographics, we see
           year-over-year purchases for the summer savings events strongest for Young Millennials                                  powerful data and analytics capabilities. From understanding consumer behavior to
           (ages 23-30) and Gen Z (ages 18-22). See this month’s Deep Dive for more detailed                                       providing personalized service, data is – and will continue to be – the key driver of
           purchase, transaction and demographic insights by retailer, which can help credit
                                                                                                                                   decision making for financial institutions.
           unions tailor personalized campaigns by membership age groups and card preferences.
                                                                                                                                   — Tom Gandre, EVP, Chief Operating Officer at PSCU
       ■   Card Present volume continues to improve, most notably in the Goods and Restaurant
           sectors, when compared to the start of 2021 for both credit and debit – but still
           continues to trail Card Not Present growth.

       ■   Credit card portfolio balances (for our same-store population) in June 2021 held
           relatively steady, with just a 0.3% drop. These balances are down 14% compared to the
           pre-pandemic June 2019 timeframe.

       Payments ■ Risk Management ■ Digital Banking ■ Data Science and Analytics ■ Loyalty ■ Mobile and Online Card Management
7.21   Contact Center Services and Solutions ■ Strategic Consulting ■ Cross-Channel Marketing Solutions ■ Delinquency Management
WELCOME TO THE PSCU PAYMENTS INDEX
PSCU Payments Index                                                                                                                                                                                          July 2021 ■ 4

       CREDIT CARD ACCOUNT BALANCES                                                                                                                              AVERAGE CREDIT CARD BALANCES
                                                                                                                                                                              June (Month 6)
       Average credit card account balances (for our same-store population) have shown a decline since July                          $3200
       2019. Last month showed a slight uptick and June 2021 held relatively steady with just a 0.3% drop. A
       major factor for lower credit card balances in 2021 continues to be the record-setting pace at which                          $3100

       consumers are paying off their credit card debt, with the average debt per household down 13.5% in Q1
                                                                                                                                     $3000
       2021 compared to Q1 2020, according to a WalletHub study.
                                                                                                                                     $2900

                                                                                                                                     $2800
          ADDITIONAL FINDINGS OF NOTE IN PSCU’S SAME-STORE
          POPULATION INCLUDE:                                                                                                        $2700

            ■   The average credit card balance per gross active account is $2,640, down $8 from May 2021.                           $2600

            ■   Year-over-year average credit card account balances (June 2021 vs. June 2020) have dropped 7%, or                    $2500
                $195.                                                                                                                        Jan    Feb    Mar    Apr   May     Jun    Jul     Aug   Sep   Oct    Nov   Dec

            ■   Compared to June 2019, average credit card account balances have dropped 14%, or $422.                                                    2021           2020                2019          2018

                                                                                                                                                   PERCENTAGE CHANGE IN AVERAGE CREDIT CARD BALANCES
          We do anticipate a rise in credit card balances as fall approaches, following the expiration of federal                                                             June (Month 6)
          unemployment benefits and the expiration of the CDC’s eviction moratorium.                                                   2%

                                                                                                                                       0%

                                                                                                                                       -2%

                                                                                                                                       -4%

                                                                                                                                       -6%

                                                                                                                                       -8%

                                                                                                                                      -10%

                                                                                                                                      -12%

                                                                                                                                      -14%

                                                                                                                                      -16%
                                                                                                                                             Jan    Feb   Mar    Apr    May     Jun    Jul     Aug   Sep   Oct    Nov   Dec

                                                                                                                                                     % Change 21v19              % Change 21v20            % Change 20v19

         Payments ■ Risk Management ■ Digital Banking ■ Data Science and Analytics ■ Loyalty ■ Mobile and Online Card Management
7.21     Contact Center Services and Solutions ■ Strategic Consulting ■ Cross-Channel Marketing Solutions ■ Delinquency Management
WELCOME TO THE PSCU PAYMENTS INDEX
PSCU Payments Index                                                                                                                                                                                                        July 2021 ■ 5

       CREDIT AND DEBIT CARDS
       For both credit and debit card payments, June 2021 continued to show strong performance in overall
       consumer spending. In June 2021, debit purchases were up 36% and credit purchases were up 26%
       compared to June 2019. As PSCU has reported over the past 16 months, the rebound to pre-pandemic
       spending patterns continues to vary by card product and sector, with some improving to historic levels
       and others still elevated from pre-pandemic levels. Supporting a strong month of consumer spending
       was Amazon Prime Day, which moved back to the summer months after being delayed last year due to
       COVID-19. This month’s Deep Dive explores the trends for Prime Day, as well as Target and Walmart, which
       also held concurrent annual sales events, Deal Days and Deals for Days, respectively.

                                                                         DEBIT ACTIVITY                                                                                                    CREDIT ACTIVITY
                                                                            June (Month 6)                                                                                                   June (Month 6)

        70%                                                                                                                                      70%

        60%                                                                                                                                      60%

        50%                                                                                                                                      50%

        40%                                                                                                                                      40%

        30%                                                                                                                                      30%

        20%                                                                                                                                      20%

        10%                                                                                                                                      10%

         0%                                                                                                                                       0%

       -10%                                                                                                                                      -10%

       -20%                                                                                                                                      -20%

       -30%                                                                                                                                      -30%
                  Jan         Feb         Mar         Apr         May         Jun          Jul        Aug         Sep         Oct    Nov   Dec          Jan   Feb   Mar     Apr      May      Jun     Jul     Aug    Sep      Oct       Nov   Dec

                                           Debit Transactions 21v19                                   Debit Purchases 21v19                                           Credit Transactions 21v19                Credit Purchases 21v19
                                           Debit Transactions 21v20                                   Debit Purchases 21v20                                           Credit Transactions 21v20                Credit Purchases 21v20
                                           Debit Transactions 20v19                                   Debit Purchases 20v19                                           Credit Transactions 20v19                Credit Purchases 20v19

         Payments ■ Risk Management ■ Digital Banking ■ Data Science and Analytics ■ Loyalty ■ Mobile and Online Card Management
7.21     Contact Center Services and Solutions ■ Strategic Consulting ■ Cross-Channel Marketing Solutions ■ Delinquency Management
WELCOME TO THE PSCU PAYMENTS INDEX
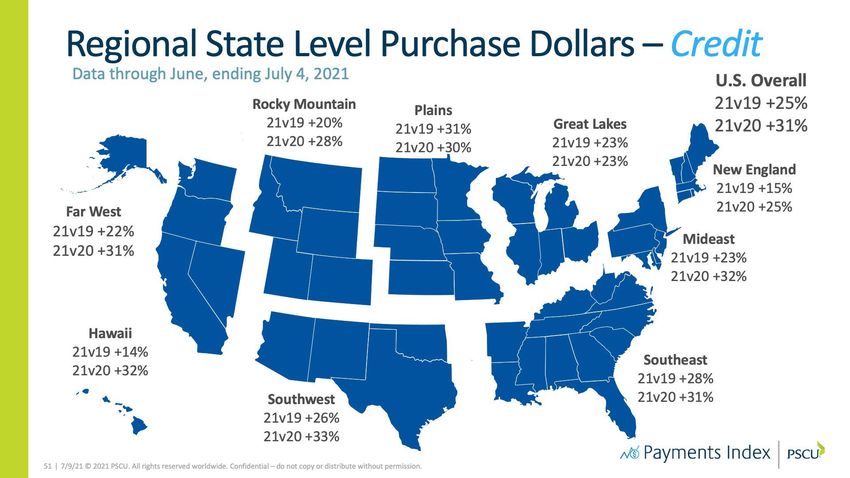
PSCU Payments Index                                                                                                                                                                                                                                      July 2021 ■ 6

       CARD NOT PRESENT (CNP) &                                                                                                     % DEBIT ACTIVITY CNP
                                                                                                                                            June (Month 6)
                                                                                                                                                                                                                             % CREDIT ACTIVITY CNP
                                                                                                                                                                                                                                     June (Month 6)
       CARD PRESENT (CP) ACTIVITY                                                         70%                                                                                                   70%

       June 2021 Card Not Present (CNP) debit
                                                                                          60%                                                                                                   60%
       purchases represented 42% of all purchases, up
       eight percentage points from June 2019. CNP                                        50%                                                                                                   50%
       credit purchases represented 51% of overall
       credit purchases in June 2021, up six percentage                                   40%                                                                                                   40%

       points from June 2019. As the number of fully-
                                                                                          30%                                                                                                   30%
       vaccinated Americans continues to rise, state
       restrictions are lifted and mask mandates are
                                                                                          20%                                                                                                   20%
       rescinded, we continue to see increases in Card
       Present (CP) activity, with CP debit transactions                                  10%                                                                                                   10%
       for June 2021 up 14% compared to 2020 and                                                   Jan     Feb      Mar     Apr       May    Jun    Jul   Aug        Sep   Oct   Nov   Dec             Jan     Feb   Mar    Apr   May   Jun    Jul    Aug     Sep   Oct    Nov   Dec

       up 3% compared to 2019. CP credit transactions                                                     2021 % CNP Debit Transactions                            2021 % CNP Debit Purchases                2021 % CNP Credit Transactions                 2021 % CNP Credit Purchases
                                                                                                          2020 % CNP Debit Transactions                            2020 % CNP Debit Purchases                2020 % CNP Credit Transactions                 2020 % CNP Credit Purchases
       were up 37% for June 2021 compared to 2020                                                         2019 % CNP Debit Transactions                            2019 % CNP Debit Purchases                2019 % CNP Credit Transactions                 2019 % CNP Credit Purchases
       and up 2% compared to 2019.
                                                                                                                      % CHANGE IN CP DEBIT ACTIVITY                                                                   % CHANGE IN CP CREDIT ACTIVITY
                                                                                                                                       June (Month 6)                                                                               June (Month 6)
                                                                                          120%                                                                                                  120%

                                                                                          100%                                                                                                  100%

                                                                                           80%                                                                                                   80%

                                                                                           60%                                                                                                   60%

                                                                                           40%                                                                                                   40%

                                                                                           20%                                                                                                   20%

                                                                                             0%                                                                                                   0%

                                                                                           -20%                                                                                                 -20%

                                                                                           -40%                                                                                                 -40%

                                                                                           -60%                                                                                                 -60%
                                                                                                    Jan     Feb      Mar      Apr     May     Jun   Jul      Aug     Sep   Oct   Nov   Dec             Jan     Feb    Mar   Apr   May    Jun   Jul    Aug     Sep    Oct   Nov   Dec
                                                                                                          Debit CP Transactions 21v19                              Debit CP Purchases 21v19                     Credit CP Transactions 21v19                   Credit CP Purchases 21v19
                                                                                                          Debit CP Transactions 21v20                              Debit CP Purchases 21v20                     Credit CP Transactions 21v20                   Credit CP Purchases 21v20
                                                                                                          Debit CP Transactions 20v19                              Debit CP Purchases 20v19                     Credit CP Transactions 20v19                   Credit CP Purchases 20v19

          Payments ■ Risk Management ■ Digital Banking ■ Data Science and Analytics ■ Loyalty ■ Mobile and Online Card Management
7.21      Contact Center Services and Solutions ■ Strategic Consulting ■ Cross-Channel Marketing Solutions ■ Delinquency Management
WELCOME TO THE PSCU PAYMENTS INDEX
PSCU Payments Index                                                                                                                                                                                                                                                      July 2021 ■ 7

       CONTACTLESS TRANSACTIONS                                                                                            CONTACTLESS DEBIT ACTIVITY
                                                                                                                                            June (Month 6)
                                                                                                                                                                                                                                   CONTACTLESS CREDIT ACTIVITY
                                                                                                                                                                                                                                                   June (Month 6)
                                                                                           20%                                                                                                          20%
       Usage of contactless cards continues to grow,
                                                                                           18%                                                                                                          18%
       with contactless transaction volume for both
                                                                                           16%                                                                                                          16%
       debit and credit more than doubling since January
       2020. In June 2021, contactless tap-and-go                                          14%                                                                                                          14%
       debit transactions were 18% of total Card Present                                   12%                                                                                                          12%
       volume, compared to 8% in January 2020. For
                                                                                           10%                                                                                                          10%
       credit, contactless tap-and-go transactions also
                                                                                             8%                                                                                                          8%
       remain more than doubled at 15% in June 2021,
       compared to 6% in January 2020.                                                       6%                                                                                                          6%

                                                                                             4%                                                                                                          4%
       As contactless transactions have continued to
                                                                                             2%                                                                                                          2%
       replace cash for smaller purchases, the average                                              Jan     Feb      Mar     Apr      May     Jun     Jul    Aug    Sep     Oct    Nov     Dec                Jan     Feb     Mar     Apr     May      Jun       Jul   Aug    Sep     Oct     Nov     Dec
       contactless purchase remains well below the                                                         % Contactless CP Debit Transactions 2021           % Contactless CP Debit Purchases 2021                  % Contactless CP Credit Transactions 2021          % Contactless CP Credit Purchases 2021
                                                                                                           % Contactless CP Debit Transactions 2020           % Contactless CP Debit Purchases 2020                  % Contactless CP Credit Transactions 2020          % Contactless CP Credit Purchases 2020
       non-contactless card purchase. For June 2021, the
       average debit contactless purchase was $23 and
       the average credit contactless purchase was $43.                                                           CONTACTLESS DEBIT AVERAGE PURCHASE                                                                     CONTACTLESS CREDIT AVERAGE PURCHASE
                                                                                                                                            June (Month 6)                                                                                         June (Month 6)
                                                                                           $75                                                                                                          $75

                                                                                           $65                                                                                                          $65

                                                                                           $55                                                                                                          $55

                                                                                           $45                                                                                                          $45

                                                                                           $35                                                                                                          $35

                                                                                           $25                                                                                                          $25

                                                                                           $15                                                                                                          $15
                                                                                                    Jan     Feb      Mar     Apr      May     Jun     Jul    Aug    Sep     Oct    Nov     Dec                Jan     Feb     Mar     Apr     May      Jun       Jul   Aug    Sep     Oct     Nov     Dec
                                                                                                           AVG CP Contactless DR Purchase 2021                AVG CP Contactless DR Purchase 2020                   AVG CP Contactless CR Purchase 2021                AVG CP Contactless CR Purchase 2020
                                                                                                           AVG CP Non-Contactless DR Purchase 2021            AVG CP Non-Contactless DR Purchase 2020               AVG CP Non-Contactless CR Purchase 2021            AVG CP Non-Contactless CR Purchase 2020
                                                                                                           AVG OVERALL DR Purchase 2021                       AVG OVERALL DR Purchase 2020                          AVG OVERALL CR Purchase 2021                       AVG OVERALL CR Purchase 2020

          Payments ■ Risk Management ■ Digital Banking ■ Data Science and Analytics ■ Loyalty ■ Mobile and Online Card Management
7.21      Contact Center Services and Solutions ■ Strategic Consulting ■ Cross-Channel Marketing Solutions ■ Delinquency Management
WELCOME TO THE PSCU PAYMENTS INDEX
PSCU Payments Index                                                                                                                                                                                                                                                     July 2021 ■ 8

                                                                                                                                                   Mobile Wallet
       MOBILE WALLETS                                                                                        MOBILE WALLET TRANSACTIONS (2019 BASELINE)
                                                                                                                                            June (Month 6)
                                                                                                                                                                                                                    MOBILE WALLET PURCHASES (2019 BASELINE)
                                                                                                                                                                                                                                                  June (Month 6)
                                                                                            200%                                                                                                      200%
       Mobile Wallets continue to see an increase in usage
                                                                                            175%                                                                                                      175%
       since the start of 2021, especially for debit. Debit
                                                                                            150%                                                                                                      150%
       Mobile Wallet transactions finished June up 141%
                                                                                            125%                                                                                                      125%
       compared to 2019, reflecting two years of growth,
       and up 75% compared to 2020. Purchases were up                                       100%                                                                                                      100%

       a bit higher than transaction volumes, with growth                                     75%                                                                                                      75%

       on total Mobile Wallet purchases up 186% for debit                                     50%                                                                                                      50%
       and 119% for credit compared to 2019. Average                                          25%                                                                                                      25%
       purchase size has increased from $15.30 in June                                         0%                                                                                                       0%
       2019 to $18.19 in June 2021, an increase of 19%.                                      -25%                                                                                                     -25%
                                                                                             -50%                                                                                                     -50%
       For Mobile Wallet credit activity, year-over-year                                               Jan     Feb     Mar      Apr    May        Jun     Jul   Aug    Sep      Oct     Nov     Dec          Jan   Feb     Mar     Apr      May     Jun   Jul     Aug   Sep      Oct     Nov     Dec
       growth in transaction volume has stayed in line                                                       Mobile Wallet - F2F - Credit 21v19                  Mobile Wallet - F2F - Debit 21v19                 Mobile Wallet - F2F - Credit 21v19               Mobile Wallet - F2F - Debit 21v19

       with the results of 2020 (compared to the 2019                                                        Mobile Wallet - F2F - Credit 20v19                  Mobile Wallet - F2F - Debit 20v19                 Mobile Wallet - F2F - Credit 20v19               Mobile Wallet - F2F - Debit 20v19

       baseline), up 89% for June 2021. Similar to debit
       Mobile Wallets, credit purchases were up 119%
                                                                                                                 MOBILE WALLET DEBIT AVERAGE PURCHASE                                                               MOBILE WALLET CREDIT AVERAGE PURCHASE
       for June compared to 2019. The average Mobile                                                                                        June (Month 6)                                                                                       June (Month 6)
       Wallet credit purchase increased by $4.36 in June                                     $45                                                                                                      $45
       to $31.71, up compared to 2019 by 16%.
                                                                                             $40                                                                                                      $40

                                                                                             $35                                                                                                      $35

                                                                                             $30                                                                                                      $30

                                                                                             $25                                                                                                      $25

                                                                                             $20                                                                                                      $20

                                                                                             $15                                                                                                      $15

                                                                                             $10                                                                                                      $10
                                                                                                      Jan     Feb      Mar     Apr     May        Jun     Jul   Aug    Sep     Oct     Nov      Dec          Jan   Feb    Mar      Apr     May      Jun   Jul     Aug   Sep     Oct      Nov     Dec

                                                                                                                             2021                       2020              2019                                                       2021                 2020                 2019

         Payments ■ Risk Management ■ Digital Banking ■ Data Science and Analytics ■ Loyalty ■ Mobile and Online Card Management
7.21     Contact Center Services and Solutions ■ Strategic Consulting ■ Cross-Channel Marketing Solutions ■ Delinquency Management
WELCOME TO THE PSCU PAYMENTS INDEX
PSCU Payments Index                                                                                                                                                                                                           July 2021 ■ 9

       ATM
       We continue to see lessened demand for cash. While the volume of transactions remains low, we have seen
       an increase in the average amount withdrawn per transaction. For June 2021, the total cash withdrawn
       remained below the baseline levels of June 2019 by 3%, but was above the June 2020 levels by 8%. The
       average monthly cash withdrawn was close to June 2020 levels, finishing up by 2% at $143, which was 16%
       higher than average ATM cash withdrawn in June 2019.

                                             ATM MONTHLY WITHDRAWALS (2019 BASELINE)                                                                                  ATM MONTHLY WITHDRAWALS (2020 BASELINE)
                                                                           June (Month 6)                                                                                                    June (Month 6)

       30%                                                                                                                                       30%

       20%                                                                                                                                       20%

       10%                                                                                                                                       10%

        0%                                                                                                                                        0%

   -10%                                                                                                                                          -10%

   -20%                                                                                                                                          -20%

   -30%                                                                                                                                          -30%
               Jan         Feb         Mar         Apr         May         Jun          Jul        Aug         Sep         Oct       Nov   Dec          Jan   Feb   Mar     Apr     May       Jun      Jul    Aug      Sep     Oct       Nov   Dec
                                        AVG $ Withdrawal 21v19                                     TOTAL $ Withdrawal 21v19                                         AVG $ Withdrawal 21v20                    TOTAL $ Withdrawal 21v20

                                        AVG $ Withdrawal 20v19                                     TOTAL $ Withdrawal 20v19

         Payments ■ Risk Management ■ Digital Banking ■ Data Science and Analytics ■ Loyalty ■ Mobile and Online Card Management
7.21     Contact Center Services and Solutions ■ Strategic Consulting ■ Cross-Channel Marketing Solutions ■ Delinquency Management
WELCOME TO THE PSCU PAYMENTS INDEX
PSCU Payments Index                                                                                                                                                                                                               July 2021 ■ 10

       SECTORS/MERCHANT
       CATEGORIES
       For debit purchases, every sector remained
                                                                                         prescription-bottle-alt   DRUG STORES
                                                                                                                   June (Month 6)

                                                                                                                                    Credit   Debit
                                                                                                                                                     camera-movie   ENTERTAINMENT
                                                                                                                                                                    June (Month 6)

                                                                                                                                                                                     Credit   Debit
                                                                                                                                                                                                       gas-pump       GASOLINE
                                                                                                                                                                                                                      June (Month 6)

                                                                                                                                                                                                                                       Credit   Debit
       above its respective 2019 baseline for June 2021
                                                                                                                   2021 v 2019      13%      8%                     2021 v 2019      14%      30%                     2021 v 2019      21%      21%
       results. Entertainment and Gasoline showed the
       largest monthly year-over-year increases at eight                                                           2021 v 2020      10%       1%                    2021 v 2020      145%     117%                    2021 v 2020      72%      40%
       percentage points and six percentage points,
                                                                                                                   2020 v 2019       2%       7%                    2020 v 2019      -53%     -40%                    2020 v 2019      -30%     -8%
       respectively.

       For credit purchases, Travel remains the only
       sector below 2019 levels for June at -3% for year
       over year. Travel and Entertainment, two of the
       most negatively affected sectors throughout
                                                                                       shopping-bag                GOODS
                                                                                                                   June (Month 6)

                                                                                                                                    Credit   Debit
                                                                                                                                                     carrot         GROCERIES
                                                                                                                                                                    June (Month 6)

                                                                                                                                                                                     Credit   Debit
                                                                                                                                                                                                       utensils-alt   RESTAURANTS
                                                                                                                                                                                                                      June (Month 6)

                                                                                                                                                                                                                                       Credit   Debit
       the course of the COVID-19 pandemic, showed
       the largest monthly year-over-year gains at 11                                                              2021 v 2019      39%      46%                    2021 v 2019      24%      12%                     2021 v 2019      21%      27%
       percentage points and 13 percentage points,                                                                 2021 v 2020      17%       3%                    2021 v 2020      10%      -1%                     2021 v 2020      80%      33%
       respectively.
                                                                                                                   2020 v 2019      19%      42%                    2020 v 2019      13%      13%                     2020 v 2019      -32%     -5%

                                                                                        briefcase                  SERVICE
                                                                                                                   June (Month 6)                    plane          TRAVEL
                                                                                                                                                                    June (Month 6)                    lightbulb-on    UTILITIES
                                                                                                                                                                                                                      June (Month 6)

                                                                                                                                    Credit   Debit                                   Credit   Debit                                    Credit   Debit
                                                                                                                   2021 v 2019      31%      38%                    2021 v 2019       -3%     21%                     2021 v 2019      21%      34%
                                                                                                                   2021 v 2020      27%      19%                    2021 v 2020      150%     72%                     2021 v 2020      15%       9%
                                                                                                                   2020 v 2019       3%      16%                    2020 v 2019      -61%     -30%                    2020 v 2019       5%      23%

         Payments ■ Risk Management ■ Digital Banking ■ Data Science and Analytics ■ Loyalty ■ Mobile and Online Card Management
7.21     Contact Center Services and Solutions ■ Strategic Consulting ■ Cross-Channel Marketing Solutions ■ Delinquency Management
PSCU Payments Index                                                                                                                                                July 2021 ■ 11

       DEEPER DIVE: AMAZON                                                           Of the three large merchants (Amazon, Target and
                                                                                     Walmart), Target posted the biggest percentage
       PRIME DAY
                                                                                     of growth in year-over-year purchases over the
       This year’s Amazon Prime Day event, typically one                             comparative two-day Prime Day event period.
       of the busiest shopping periods of the year for                               For Target, across Card Present (CP) and Card Not
       Amazon and other competing retailers, returned to                             Present (CNP) channels, debit purchases were up
       summer on June 21-22 following a shift to the fall                            22% and credit purchases were up 17%.
       (October 13-14) in 2020. As expected, Prime Day
                                                                                     By age demographics, we saw year-over-year
       was met by competing events at Walmart (Deals
                                                                                     purchases were strongest for the Young Millennial
       for Days) and Target (Deal Days).
                                                                                     (ages 23 to 30) and Gen Z (ages 18 to 22)
       Compared to past Prime Day events, this year                                  demographics. Across all three merchants, year-
       yielded slower growth for the online merchant,                                over-year purchases were up for Young Millennials
       with Amazon’s publicity comparably muted around                               by 21% for debit and 18% for credit, and up for
       this year’s event, as reported by CNBC. However,                              Gen Z by 38% for debit and 45% for credit. Baby
       Amazon has maintained significant growth rates                                Boomers posted modest growth in purchases for
       throughout the pandemic, so these results should                              the 2021 two-day event, up 7% for debit purchases
       be tempered in context.                                                       and 4% for credit purchases compared to 2020.

                                                                          Credit                                       Debit
                                                                Transactions   Purchases                     Transactions  Purchases
          2021             Amazon Prime Day                            2%                    6%                     5%               10%
           vs.
          2020             Target Deal Days                           13%                   17%                   19%                22%
                           Walmart Deals for Days                      8%                   11%                     8%               9%

                                                                                                                                           ifeelstock - stock.adobe.com

         Payments ■ Risk Management ■ Digital Banking ■ Data Science and Analytics ■ Loyalty ■ Mobile and Online Card Management
7.21     Contact Center Services and Solutions ■ Strategic Consulting ■ Cross-Channel Marketing Solutions ■ Delinquency Management
PSCU Payments Index                                                                                                                                                                                                 July 2021 ■ 12

       AMAZON PRIME DAY: JUNE 21-22
       ■   This year’s Amazon Prime Day event returned to the summer months and yielded slower growth for the
           online merchant compared to previous events. 2021 Prime Day purchases for Amazon were up 10% for
           debit and 6% for credit compared to the 2020 Prime Day event that occurred last fall and effectively
           kicked off the 2020 holiday spending season.
       ■   Notable is the substantial growth in purchases – all CNP – that Amazon has generated since the onset
           of the COVID-19 pandemic, consistently generating purchases at more than twice their historical
           growth rate – and the Prime Day results are in addition to that. Compared to the July 2019 Prime Day
           event, June 2021 Prime Day purchases were up 60% for debit and 36% for credit.
       ■   For Amazon Prime Day 2021, the age demographic with the largest percentage of purchases for debit
           was Generation X (ages 41 to 54) with 30% of the total spend. For credit, Baby Boomers (ages 55+)
           were at the top with 44% of Amazon Prime Day purchases.
       ■   The age demographic that saw the largest year-over-year increase was Generation Z (ages 18 to
           22), with debit purchases up 35% and credit purchases up 31%. While Gen Z represents the smallest
           percentage of Amazon purchases on Prime Day, for 2021, their spending represented 6% of overall
           debit purchases, up from 5% during 2020 Prime Day.                                                                          dennizn - stock.adobe.com

       ■   For the 2021 Prime Day event, Amazon realized a 5.4% increase in their average debit purchase
           compared to 2020, finishing at $44.04. The average credit purchase of $52.42 was up 4.2% compared
           to 2020.

                                                                                                                                                                             Credit                       Debit
                                                                                                                                                                   Transactions    Purchases   Transactions    Purchases    Comparison

                                                                                                                                            2021 v 2019               32%           36%           47%           60%           2 Day

                                                                                                                                            2021 v 2020                2%            6%            5%           10%           2 Day

                                                                                                                                            2020 v 2019               30%           28%           40%           45%           2 Day

           Payments ■ Risk Management ■ Digital Banking ■ Data Science and Analytics ■ Loyalty ■ Mobile and Online Card Management
7.21       Contact Center Services and Solutions ■ Strategic Consulting ■ Cross-Channel Marketing Solutions ■ Delinquency Management
PSCU Payments Index                                                                                                                                                                                                            July 2021 ■ 13

       TARGET DEAL DAYS: JUNE 20-22                                                       Equally impressive was the growth for CNP and
       ■   Target, with its Deal Days sales event, posted                                 CP purchases for this younger demographic:
           the largest year-over-year increase in purchases                               Deal Days CNP purchases were up 77% for
           compared to Amazon and Walmart. Target’s                                       debit and 78% for credit compared to 2020. CP
           Deal Days 2021 posted an increase of 22% for                                   purchases were up 49% for debit and 67% for
           debit purchases and 17% for credit purchases.                                  credit for the same timeframes.

       ■   In 2021, Target expanded Deal Days to three                                ■   While Generation Z represents the smallest                                                Credit                           Debit
           days, starting one day earlier than Amazon                                     percentage of Target purchases on Deal Days for                                 Transactions    Purchases       Transactions    Purchases   Comparison
                                                                                          2021, their spending represented 11% of overall
           Prime Day. Our comparison uses activity on
                                                                                                                                                  2021 v 2019                  38%                  51%      29%           43%          2 Day*
           the two days that coincide with Prime Day and                                  debit purchases, nearly doubling their 2019
           Target’s two-day Deal Days 2020 event.                                         Deal Days purchases at 6% of overall spend at           2021 v 2020                  13%                  17%      19%           22%          2 Day*
                                                                                          Target.
       ■   Target’s growth in Deal Days 2021 purchases                                                                                            2020 v 2019                  23%                  29%       9%           18%           2 Day
           came from strong growth in both in-store                                   ■   Baby Boomers have yielded the lowest year-
           and online activity. Card Not Present (CNP)                                    over-year growth in purchases at Target during      * Using 2 days (M/T) of Target 2021 3 day event (S/M/T)

           purchases were up 35% for debit and 10% for                                    Deal Days. While they represent the largest age
           credit compared to Deal Days 2020, while Card                                  segment for credit purchases, year-over-year
           Present (CP) purchases were up 19% for debit                                   growth was up just 4% (2021 vs. 2020). Debit
           and 20% for credit.                                                            purchases were up a modest 6% for the same
                                                                                          time period.
       ■   For Target Deal Days 2021, the age
           demographic with the largest percentage of                                 ■   During the sale event, for Monday and
           purchases for debit was Older Millennials (ages                                Tuesday debit purchases, Target posted a 2.5%
           31 to 40) with 25% of the total spend. For                                     increase compared to 2020 in their overall
           credit, Baby Boomers (ages 55+) were at the top                                average purchase, finishing at $45.46. The
           with 32% of Deal Days purchases.                                               average credit purchase of $57.35 was up
                                                                                          4.0% compared to 2020. Target’s CP average
       ■   Similar to Amazon, the age demographic with
                                                                                          purchase was up 3.5%, finishing at $46.82, while
           the largest year-over-year increase with Target
                                                                                          CNP was down 0.5%, finishing at $40.11.
           was Generation Z (ages 18 to 22) with debit
           purchases up 52% and credit purchases up 69%.

                                                                                                                                             gesrey - stock.adobe.com

           Payments ■ Risk Management ■ Digital Banking ■ Data Science and Analytics ■ Loyalty ■ Mobile and Online Card Management
7.21       Contact Center Services and Solutions ■ Strategic Consulting ■ Cross-Channel Marketing Solutions ■ Delinquency Management
PSCU Payments Index                                                                                                                                                                                                                   July 2021 ■ 14

                                                                                                                                                   WALMART DEALS FOR DAYS:                                 ■   While Baby Boomers maintained the largest
                                                                                                                                                   JUNE 20-23                                                  percentage of Walmart’s purchases during the
                                                                                                                                                   ■   For 2021, Walmart kicked off its Deals for Days         event (33% for debit and 52% for credit), their
                                                                                                                                                       event one day before Amazon Prime Day and               growth in purchases was the lowest across age
                                                                                                                                                       concluded it one day after. The four-day event,         groups. 2021 Baby Boomer debit purchases
                                                                                                                                                       which was shortened from five days in 2020, was         were up 3% and credit purchases were up 2%
                                                                                                                                                       three days in 2019.                                     compared to 2020.
                                                  Credit                                         Debit
                                        Transactions    Purchases                     Transactions    Purchases                       Comparison   ■   This year’s event posted increases in purchases     ■   During the Deal Days 2021 event, for Monday
                                                                                                                                                                                                               and Tuesday debit purchases, Walmart posted a
            2021 v 2019                     15%                     24%                      9%                    17%                 3 Day #
                                                                                                                                                       of 9% for debit and 11% for credit compared to
                                                                                                                                                       2020. Purchases remain strong when compared             3.0% increase in their overall average purchase
            2021 v 2020                      8%                     11%                      8%                     9%                 4 Day %         to the 2019 pre-pandemic event, with debit              compared to 2020, finishing at $54.80. The
                                                                                                                                                                                                               average credit purchase of $62.53 was up
            2020 v 2019                      8%                     13%                      1%                     8%                 3 Day @
                                                                                                                                                       purchases up by 17% and credit purchases up 24%.
                                                                                                                                                                                                               2.5% compared to 2020. Walmart’s CP average
                                                                                                                                                   ■   During the Deals for Days 2021 event, Walmart
                                                                                                                                                                                                               purchase was up 4.1%, finishing at $51.89
       # Using 3 days (S/M/T) of Walmart 2021 4 day event (S/M/T/W)                                                                                    CNP debit and credit purchases were both up
       % Using 4 days (S/M/T/W) of Walmart 2020 5 day event (S/M/T/W/R)                                                                                                                                        and CNP was down 2.5%, finishing at $64.94.
       @ Using 3 days (S/M/T) of Walmart 2020 5 day event (S/M/T/W/R)
                                                                                                                                                       4% year over year. CP purchases were up 11% for
                                                                                                                                                                                                               Walmart has had the highest CNP average
                                                                                                                                                       debit and up 15% for credit.
                                                                                                                                                                                                               purchase amount amongst the three large
                                                                                                                                                   ■   In reviewing Walmart’s results, growth was fueled
                                                                                                                                                                                                               merchants for the past three years.
                                                                                                                                                       by Generation Z (ages 18 to 22) and Young
                                                                                                                                                       Millennials (23 to 30). During the two-day period
                                                                                                                                                       corresponding to Amazon’s Prime Day event:
                                                                                                                                                          • Growth in Gen Z CNP purchases was 76% for
                                                                                                                                                           debit and 46% for credit at Walmart. For CP,
                                                                                                                                                           Gen Z purchases were up 40% for debit and
                                                                                                                                                           52% for credit.
                                                                                                                                                          • Growth in Young Millennial CNP purchases
                                                                                                                                                           was 36% for debit and 52% for credit. For CP,
                                                                                                                                                           Young Millennial purchases were up 21% for
                                                                                                                                                           debit and 34% for credit.

       monticellllo - stock.adobe.com

          Payments ■ Risk Management ■ Digital Banking ■ Data Science and Analytics ■ Loyalty ■ Mobile and Online Card Management
7.21      Contact Center Services and Solutions ■ Strategic Consulting ■ Cross-Channel Marketing Solutions ■ Delinquency Management
PSCU Payments Index                                                                                                                                                                             July 2021 ■ 15

                                                                                                 REGIONAL STATE LEVEL PURCHASE DOLLARS – CREDIT
                                                                                                                                   JUNE (MONTH 6)

                                                                  Our regional analysis of spend utilizes the segmentation used by the U.S. Bureau of Economic Analysis (BEA) for economic analysis.

       Payments ■ Risk Management ■ Digital Banking ■ Data Science and Analytics ■ Loyalty ■ Mobile and Online Card Management
7.21   Contact Center Services and Solutions ■ Strategic Consulting ■ Cross-Channel Marketing Solutions ■ Delinquency Management
PSCU Payments Index                                                                                                                                                                             July 2021 ■ 16

                                                                                                  REGIONAL STATE LEVEL PURCHASE DOLLARS – DEBIT
                                                                                                                                   JUNE (MONTH 6)

                                                                  Our regional analysis of spend utilizes the segmentation used by the U.S. Bureau of Economic Analysis (BEA) for economic analysis.

       Payments ■ Risk Management ■ Digital Banking ■ Data Science and Analytics ■ Loyalty ■ Mobile and Online Card Management
7.21   Contact Center Services and Solutions ■ Strategic Consulting ■ Cross-Channel Marketing Solutions ■ Delinquency Management
PSCU Payments Index                                                                                                                                                                                                                   July 2021 ■ 17

       MONTHLY U.S. STATE/TERRITORY USAGE FOR MONTH 6, JUNE 2021 VS 2019
       The following list of U.S. states, districts and territories highlight the year-over-year changes on credit card purchases, debit card purchases and ATM transactions for PSCU Owner credit unions. This month highlights
       the changes for Month 6, comparing the results of 2021 to 2019. The location results refer to the home address of the member conducting the transaction, and not the location of the transaction. The output
       represents ‘same store’ transactions, so the same credit unions are in both sets of data, for both 2019 and 2020. Each month, the percentage changes are sorted from highest to lowest in their respective categories
       and ranked with the highest being number 1, and the lowest as number 54.

                                            Credit                                                                          ATM                                        Credit                                                     ATM
                    Location                                 Credit Rank      Debit Purchases        Debit Rank                        ATM Rank           Location               Credit Rank   Debit Purchases   Debit Rank                   ATM Rank
                                          Purchases                                                                     Transactions                                 Purchases                                                Transactions
            Alabama                          24%                  26                 44%                 10                  -3%          8       Montana              22%          34              43%             11            -3%           9
            Alaska                           16%                  44                 17%                 49                 -17%         36       Nebraska             29%          15              -1%             54           -30%           50
            Arizona                          28%                  19                 34%                 31                 -10%         24       Nevada               16%          45              20%             45           -11%           27
            Arkansas                         15%                  46                 16%                 51                 -26%         49       New Hampshire        18%          40              23%             42           -14%           31
            California                       18%                  41                 31%                 37                 -16%         33       New Jersey           14%          47              18%             48           -25%           46
            Colorado                         14%                  50                 21%                 44                 -20%         42       New Mexico           20%          38              38%             22            33%           2
            Connecticut                      14%                  48                 34%                 33                  -8%         19       New York             23%          31               3%             53           -39%           54
            Delaware                         22%                  33                 34%                 32                 -19%         40       North Carolina       36%          6               30%             38           -20%           41
            District of Columbia             10%                  54                 37%                 23                  -5%         10       North Dakota         29%          16              32%             35            -8%           16
            Florida                          30%                  13                 35%                 27                 -11%         28       Ohio                 26%          22              40%             17            -8%           17
            Georgia                          25%                  24                 38%                 20                 -14%         30       Oklahoma             21%          36              27%             40           -17%           35
            Guam                             32%                  10                 47%                  6                  19%          3       Oregon               30%          14              40%             14             1%           7
            Hawaii                           14%                  49                 23%                 41                 -25%         48       Pennsylvania         31%          12              38%             21           -16%           34
            Idaho                            27%                  20                 35%                 25                 -18%         38       Puerto Rico          89%          1               72%             1             -5%           11
            Illinois                         20%                  37                 36%                 24                  -5%         13       Rhode Island         23%          30              20%             46           -25%           47
            Indiana                          23%                  29                 39%                 18                   7%          5       South Carolina       32%          9               47%             5            -18%           37
            Iowa                             28%                  18                 69%                  2                 -20%         43       South Dakota         22%          32              13%             52           -19%           39
            Kansas                           32%                  11                 41%                 13                   9%          4       Tennessee            21%          35              45%             9            -10%           23
            Kentucky                         27%                  21                 46%                  8                  -9%         21       Texas                28%          17              34%             28           -10%           25
            Louisiana                        49%                   4                 40%                 15                  -7%         15       Utah                 25%          23              16%             50           -33%           52
            Maine                            39%                   5                 22%                 43                 -35%         53       Vermont              12%          52              27%             39           -30%           51
            Maryland                         12%                  51                 38%                 19                 -15%         32       Virgin Islands       33%          8               35%             26            -6%           14
            Massachusetts                    11%                  53                 18%                 47                 -20%         44       Virginia             17%          42              40%             16             4%           6
            Michigan                         24%                  25                 46%                  7                 -21%         45       Washington           24%          28              32%             36           -11%           29
            Minnesota                        34%                   7                 43%                 12                  -8%         18       West Virginia        17%          43              34%             34            -9%           22
            Mississippi                      50%                   3                 52%                  4                 -11%         26       Wisconsin            24%          27              34%             29            -5%           12
            Missouri                         20%                  39                 34%                 30                  -9%         20       Wyoming              54%          2               58%             3             51%           1

         Payments ■ Risk Management ■ Digital Banking ■ Data Science and Analytics ■ Loyalty ■ Mobile and Online Card Management
7.21     Contact Center Services and Solutions ■ Strategic Consulting ■ Cross-Channel Marketing Solutions ■ Delinquency Management
PSCU Payments Index                                                                                                                                                                                                                          July 2021 ■ 18

                                                                                                                              ABOUT THE PSCU PAYMENTS INDEX
                                                                                                                              All credit unions included in the PSCU Payments Index dataset have been processing with PSCU from the start of 2019 through the
                                                                                                                              most current week of 2021, enabling an accurate and relevant three-year same-store comparison (2019 vs. 2020 vs. 2021) for
                                                                                                                              purchasing behaviors and data. In our previous weekly Transaction Insights reporting, the year-over-year comparisons were extracted
                                                                                                                              from our data warehouse using the same population of credit unions, comparing each week year over year. Please note that as the
                                                                                                                              Payments Index uses the same-store population across the entire three-year period, there may be slight differences in results if the
                                                                                                                              Payments Index outputs are compared to past Transaction Insights reports.

                                                                                                                              For the “same-store” population of credit unions over the past rolling 12-month period, the July edition of the Payments Index
                                                                                                                              represents a total of 2.4 billion transactions valued at $116 billion of credit and debit card activity from July 2020 to June 2021.

                                                                                                                              Financial institutions that process with PSCU can access comparable reports to benchmark their own cardholder data with the
                                                                                                                              PSCU Payments Index for debit, credit and ATM transactions via Member Insight, our comprehensive data analytics and reporting
                                                                                                                              tool. Additionally, a library of past PSCU Payments Index reports and historical weekly Transactional Insights infographics and state/
                                                                                                                              territory analyses are available on the PSCU Payments Index site.

                                                                                                                              To subscribe to the PSCU Payments Index and receive alerts when the Index is published each month, please visit the PSCU Payments
                                                                                                                              Index site.

                                                                                                                              ABOUT PSCU
                                                                                                                              PSCU, the nation’s premier payments CUSO, supports the success of 1,500 credit unions representing more than 5.4 billion
                                                                                                                              transactions annually. Committed to service excellence and focused on innovation, PSCU’s payment processing, risk management,
                                                                                                                              data and analytics, loyalty programs, digital banking, marketing, strategic consulting and mobile platforms help deliver possibilities
                                                                                                                              and seamless member experiences. Comprehensive, 24/7/365 member support is provided by contact centers located throughout
                                                                                                                              the United States. The origin of PSCU’s model is collaboration and scale, and the company has leveraged its influence on behalf of
                                                                                                                              credit unions and their members for more than 40 years. Today, PSCU provides an end-to-end, competitive advantage that enables
                                                                                                                              credit unions to securely grow and meet evolving consumer demands. For more information, visit pscu.com.

       Payments ■ Risk Management ■ Digital Banking ■ Data Science and Analytics ■ Loyalty ■ Mobile and Online Card Management
7.21   Contact Center Services and Solutions ■ Strategic Consulting ■ Cross-Channel Marketing Solutions ■ Delinquency Management
You can also read