Florida: An Economic Overview - December 30, 2020
←
→
Page content transcription
If your browser does not render page correctly, please read the page content below
Florida:
An Economic Overview
           December 30, 2020   Presented by:

                               The Florida Legislature
                               Office of Economic and
                                    Demographic Research
                               850.487.1402
                               http://edr.state.fl.us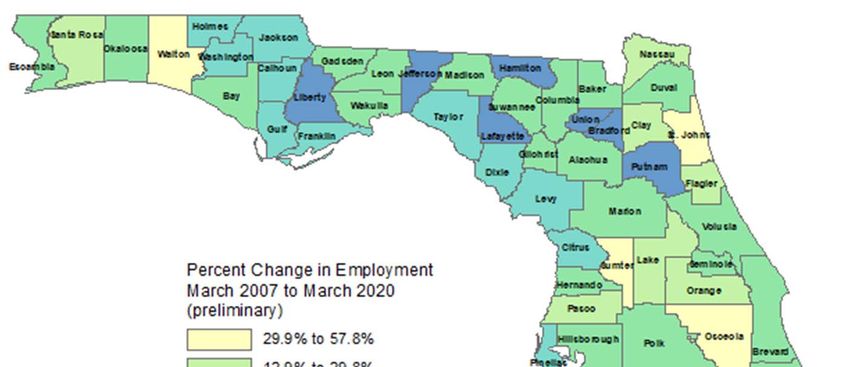
Coronavirus Impact on Florida GDP...
                                                                                       For the 2018 calendar year,
                                                                                       Florida had 3.2 percent growth
                                                                                       in Real Gross Domestic Product
                                                                                       (GDP). For 2019, Florida’s
                                                                                       growth slowed slightly from the
                                                                                       prior year, but remained above
                                                                                       the national average (2.8
                                                                                       percent in Florida versus 2.2
                                                                                       percent in the US). Translating
                                                                                       the data into the state’s fiscal
                                                                                       year, Florida grew 3.0 percent in
                                                                                       Fiscal Year 2018‐19 and was
                                                                                       expected to grow 2.5 percent in
                                                                                       Fiscal Year 2019‐20 at the
                                                                                       Conference held immediately
                                                                                       before the pandemic. Through
                                                                                       the first half of the 2019‐20
                                                                                       fiscal year, the data showed that
                                                                                       the state was on track to match
                                                                                       that Conference projection.

After falling ‐4.3 percent in the first quarter and ‐30.1 percent in the second quarter, the US Department of
Commerce, Bureau of Economic Analysis released GDP data by State for the third quarter of 2020 (July, August and
September) on December 23rd. Coming in at +33.4 percent, the state exactly matched the rate for the US as a whole.
Even so, given the overall soaring numbers among states during this quarter, Florida only ranked 27th in the country
for its real growth at a seasonally adjusted annual rate. The latest Estimating Conference projections are ‐0.5
percent for Fiscal Year 2019‐20 and +0.5 percent for Fiscal Year 2020‐21.
                                                                                                                           1
State’s GDP by County…

Pre‐pandemic, South Florida
represented one‐third of the
State’s GDP with Miami‐Dade
clocking in at 15.74%. The
post‐pandemic impact by
county is still unknown as is its
duration, but Miami‐Dade was
the state’s hardest hit county
by most metrics. At the end of
December, it was ranked
fourth in the country for its
total number of cases, and          Five counties represent over 50% of the
Broward was ranked                  state’s GDP:
thirteenth. In 2019, these                 • Miami-Dade       15.74%
                                           • Broward          10.37%
counties ranked seventh and                • Orange            9.37%
seventeenth nationally in                  • Hillsborough      8.81%
population, respectively.                  • Palm Beach        7.85%
                                                                              2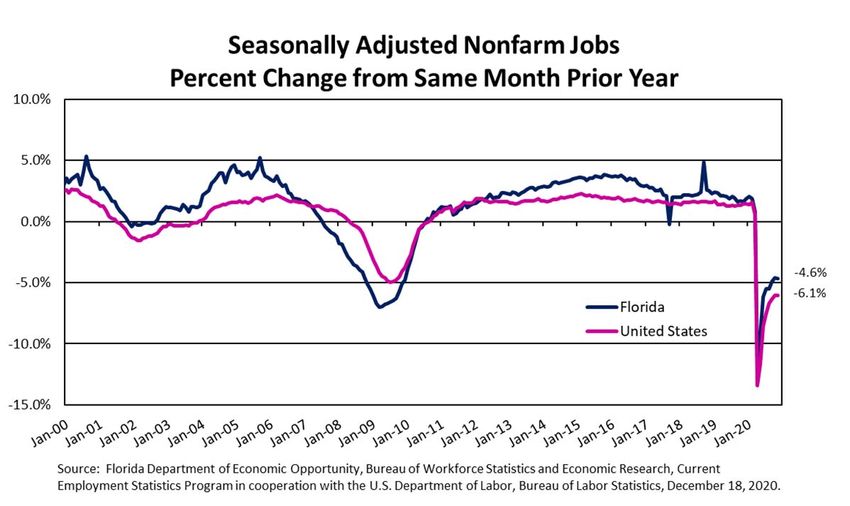
Coronavirus Impact on FL Personal Income...
                                                                                            For the 2018 calendar year, Florida
                                                                                            had 6.5 percent growth in personal
                                                                                            income and 5.1 percent growth in
                                                                                            per capita personal income. For
                                                                                            2019, Florida’s personal income
                                                                                            growth slowed slightly from the
                                                                                            prior year, but remained above the
                                                                                            national average (4.0 percent
                                                                                            growth in Florida versus 3.9
                                                                                            percent in the US), while per capita
                                                                                            personal income growth fell below
                                                                                            the national growth rate (2.9
                                                                                            percent in Florida versus 3.5
                                                                                            percent in the US). Translating the
                                                                                            data into the state’s fiscal year,
                                                                                            Florida grew 5.3 percent in
                                                                                            personal income during Fiscal Year
                                                                                            2018‐19 and was expected to grow
                                                                                            5.1 percent in Fiscal Year 2019‐20
                                                                                            at the Conference held
                                                                                            immediately before the pandemic.
                                                                                            Through the first half of the 2019‐
                                                                                            20 fiscal year, the data showed
                                                                                            that the state was on track to
                                                                                            match that Conference projection.

After increasing +5.7 percent in the first quarter and +30.3 percent in the second quarter due to government assistance
programs, the US Department of Commerce, Bureau of Economic Analysis released Personal Income data by State for
the third quarter of 2020 (July, August and September) on December 17th. The data indicated that Florida ranked 5th in
the country even though it showed ‐4.8 percent growth in personal income over the prior quarter. The state was better
than the United States as a whole, which saw a decline of ‐10.0 percent. The latest Estimating Conference projections
are +4.9 percent for Fiscal Year 2019‐20 and +2.3 percent for Fiscal Year 2020‐21 before declining (‐1.1 percent) in Fiscal
Year 2021‐22.                                                                                                               3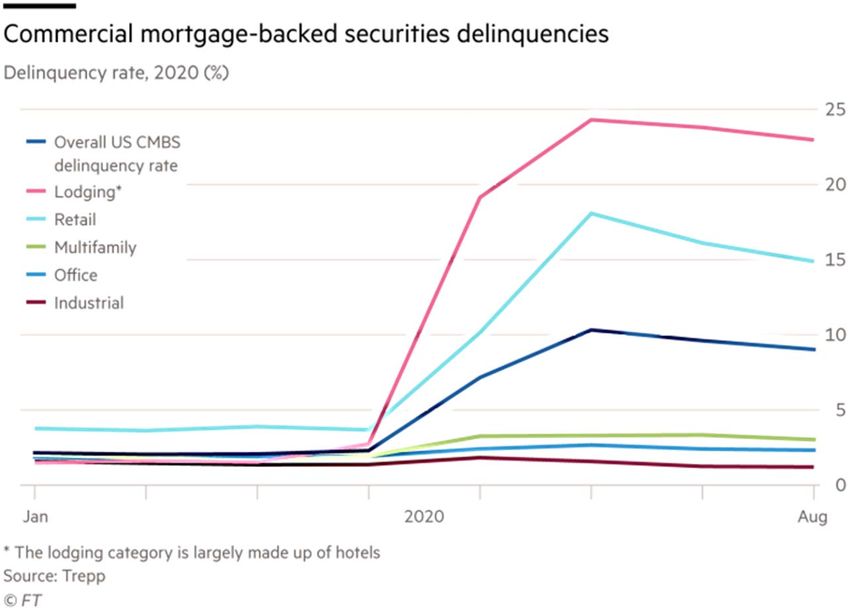
Atypical Wage Gap Stubbornly Persisted in 2019…

Florida’s average annual wage has typically been below the US average. The most recent data showed that Florida’s
average wage, relative to the US average, was 87.4% in the 2019 calendar year, continuing to fall from 2016 when it was
87.7%. The ratio in 2014 (87.2%) was Florida’s lowest percentage since 2001.

In part, the lower than average wage gains has to do with the mix of jobs that have been growing the fastest in Florida
and their average wages. For example, the Accommodation & Food Services employment sector is large, has the lowest
average annual wage, and, until the coronavirus pandemic, had been growing faster than overall employment in the
state. This industry sector is closely related to the health of Florida’s tourism industry that reached almost 130 million
visitors in FY 2018‐19, an increase of 5% over FY 2017‐18. Visitors declined to fewer than 108 million in FY 2019‐20 due
to the pandemic, causing the temporary or permanent loss of thousands of jobs. Tourism bore the brunt of the
shutdowns, possibly leading to the permanent loss of some of those jobs. As Florida’s mix of jobs changes, so will the
average annual wage.                                                                                                       4
Current Employment Conditions…
  November 2020 Nonfarm Jobs (YOY)
    US           ‐6.1%
    FL           ‐4.6%
    Employment dropped by nearly 1.2 million
    jobs from February 2020 to April 2020, a
    decline of ‐13.0 percent. As of November,
    Florida has regained 694,700 jobs out of the
    1,178,100 million lost, or about 59%.

  November 2020 Unemployment Rate
    US: 6.7%
    FL: 6.4% (651,100 jobless persons)
    The Revenue Estimating Conference assumes
    the “full employment” unemployment rate is
    about 4 percent.

Florida’s unemployment rate dropped to 2.8
percent in January and February 2020, which,
together with November 2019, became the
lowest recorded unemployment rates since the
series began in 1976. With the onset of the
Coronavirus outbreak, the unemployment rate
spiked to 13.8 percent in April 2020, handily
surpassing the prior peak rate of 11.3 percent
experienced in January 2010 during the Great
Recession. The change was breathtaking. Over
the space of two months, the unemployment
rate shifted from a near 50‐year low to a near
50‐year high.                                      5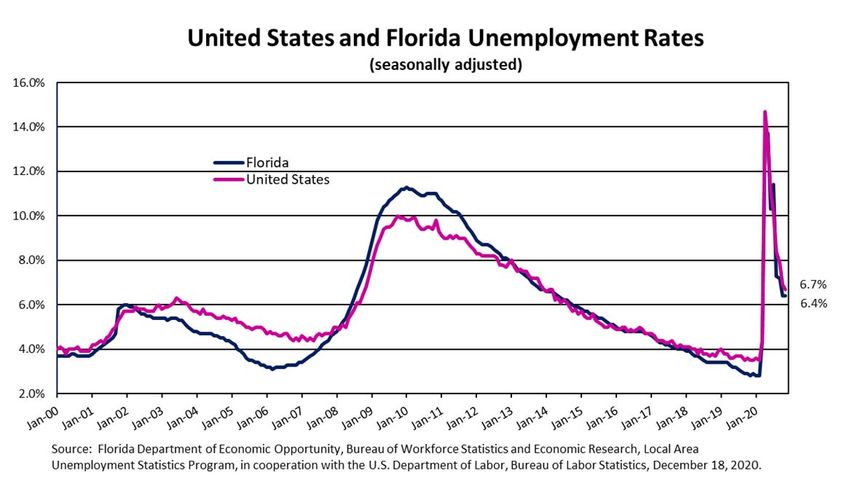
Florida’s Participation Rate Subpar…
                                                                                                  Florida’s labor force participation rate
                                                                                                  peaked during the Housing Boom at
                                                                                                  64.1% from December 2006 to
                                                                                                  February 2007. Pre‐pandemic,
                                                                                                  Florida’s participation rate had been
                                                                                                  hovering around 59.5%; however,
                                                                                                  Florida’s participation rate fell to a
                                                                                                  series low of 53.8% in April, before
                                                                                                  moving back to a still subpar 57.3% in
                                                                                                  August. Since September, Florida’s
                                                                                                  participation rate has been hovering
                                                                                                  around 57.1%.

                                                                                                  Florida’s participation rate is still lower
                                                                                                  than the US even though the US
                                                                                                  participation rate also fell substantially
                                                                                                  in April to 60.2%. The US participation
                                                                                                  rate rebounded to 61.7% in August,
                                                                                                  but since September, the rate has
                                                                                                  been fluctuating slightly, with
                                                                                                  November posting at 61.5%.

As a result of the pandemic’s economic impact, there was a surge in the number of unemployed in both Florida and the US. The duration
of unemployment initially reflected the shift of a large number of workers into unemployment with an increased number and percentage
of those unemployed for less than 5 weeks. In Florida, the percentage of those unemployed for less than 5 weeks had grown from 32.3%
in February to 44.2% in April, before falling back to 29.5% in November. As some of the temporary furloughs became permanent layoffs,
the duration of unemployment increased for the unemployed, with the percentage of those unemployed from 5 to 26 weeks reaching
56.3% in November.

Prior to the pandemic’s impact on the labor force, Florida was still experiencing a significant percentage of long‐term unemployed
(24.7%). This group now represents only 14.1%, as people laid off during the pandemic swell the ranks of the unemployed.                        6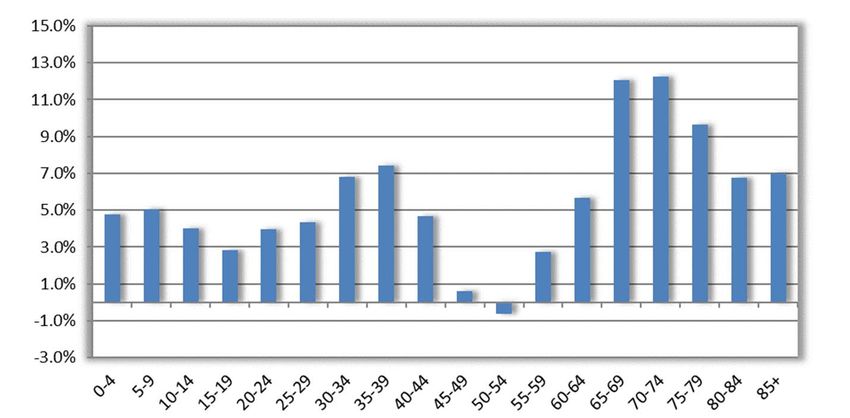
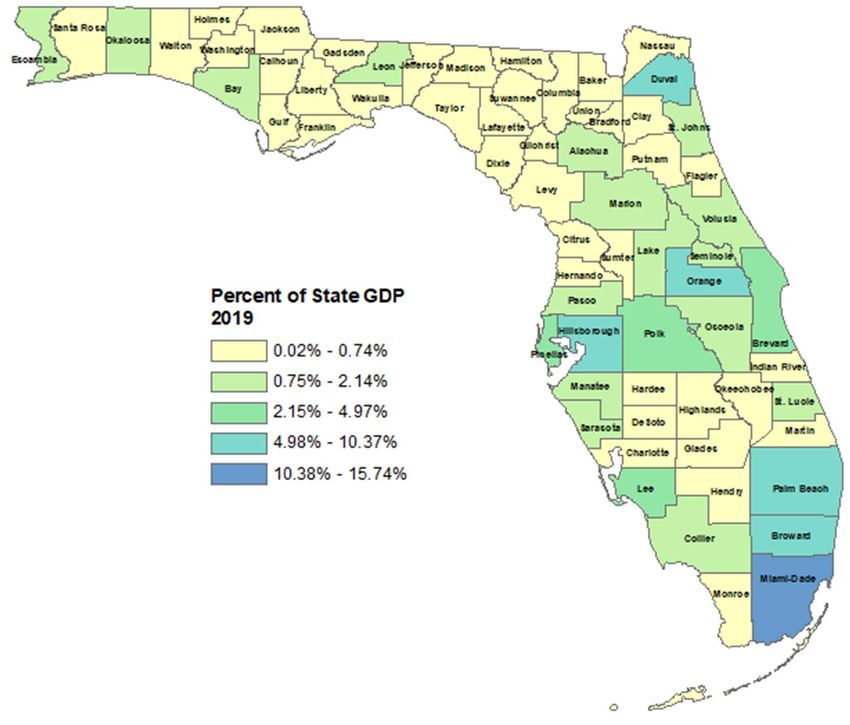
Pre-Pandemic, Employment Picture Was
Improving Across the State, but Polarized…

 Area           March 2007 to
                March 2020
 Sumter                 57.8%    Greatest
 County                          Percentage
                                 Increase

 Florida                10.9%
 Liberty                -26.1%   Greatest
 County                          Percentage
                                 Decline

           • Comparing March data over the year, it took Florida nine years to finally
             surpass its March 2007 level of employment.

           • Just over two‐thirds (46) of Florida’s counties had gained employment
             relative to their levels in March 2007. Last year, there was 42 counties.
                                                                                         7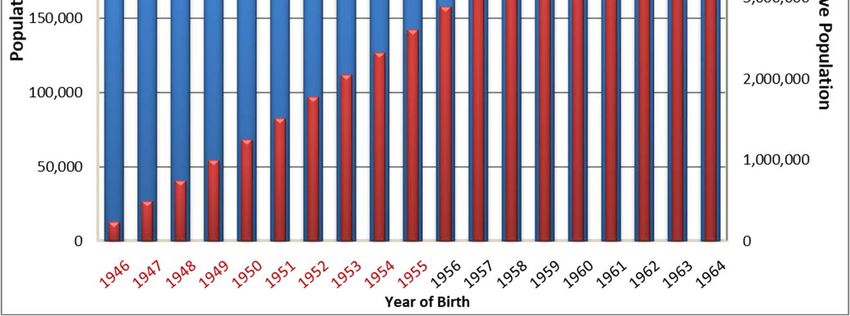
Population Growth to Slow…
Population growth is typically the state’s primary engine of economic growth, fueling both
employment and income growth.
Florida’s population exhibited strong growth over the past two years. Between April 1,
2018 and 2019 population grew by 368,021 residents (1.77%), while between April 1, 2019
and 2020 the state added 387,479 residents (1.83%). As a result of the pandemic,
population growth is expected to slow to 297,851 new residents (1.38%), reflecting both
slower net migration and a speed‐up in the expected negative natural increase (more
deaths than births). Between 2021 and 2025, growth is forecast to average 1.36%.
Almost all of Florida’s population growth through 2030 will be from net migration.
Nationally, average annual growth was forecast to be about 0.66% between 2020 and 2030.
This number has not been updated since the onset of the pandemic.
The future will be different than the past; Florida’s long‐term growth rate between 1970
and 1995 was over 3%.
Florida is currently the third most populous state, behind California and Texas.
8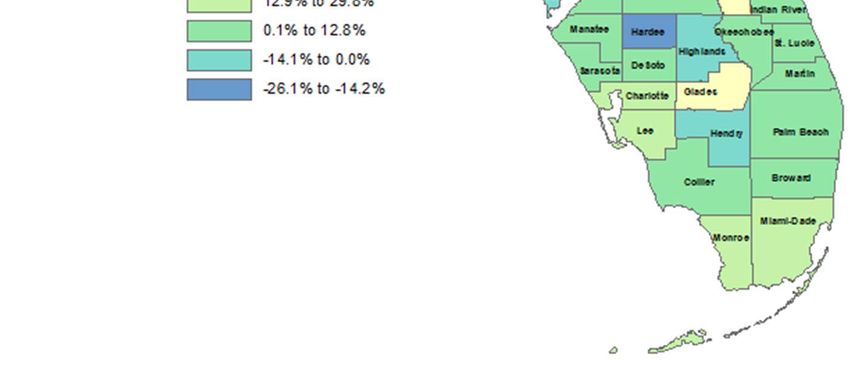
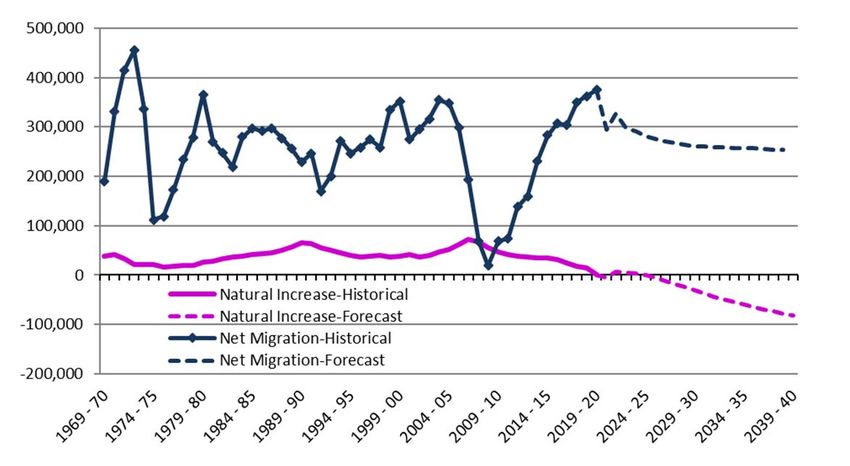
Florida’s Population Growth…
Typically, Florida’s population growth
is from net migration. This year,
COVID‐19 is expected to slow net
migration and also cause natural
increase to turn negative sooner than
originally expected. Starting in FY
2024‐25, net migration is forecast to
represent all of Florida’s population
growth.

                                         Florida’s population growth of
                                         387,479 between April 1, 2019 and
                                         April 1, 2020 was the strongest
                                         annual increase since 2005,
                                         immediately prior to the collapse of
                                         the housing boom and the
                                         beginning of the Great Recession.

                                                                                9
Baby Boomers in Context...
The first cohort of Baby
Boomers became eligible for
retirement (turned age 65) in
2011. Ten cohorts have now
entered the retirement phase:
2011 through 2020. This
represents almost half of all
Baby Boomers.
Population aged 65 and over is
forecast to represent 24.3% of
the total population in 2030,
compared with 20.4% today
and 17.6% in 2000.
In 2000, Florida’s prime working age population (ages 25‐54) represented 41.5% of the total
population. With the aging Baby Boom generation, this population now represents 36.9% of
Florida’s total population and is expected to represent only 35.9% by 2030.
The youngest population, 0‐17, represented 22.8% of the total population in 2000. Today, only
20.3% of the total population is in this age group, and this share is projected to continue
10
declining to 20.0% by 2030.Population Growth by Age Group…
Distribution of Growth by Age Group
between April 1, 2010 to April 1, 2030
53.4%
As a result of both net migration and natural increase, Florida is forecast to grow by almost 5.6
million persons between 2010 and 2030.
Growth by age group depends upon this overall growth and the aging of resident population,
resulting in 53.4 percent of those gains in the older population (age 60 and older).
Florida’s younger population (age 0‐17) will account for 15.5 percent of the gains, while the
younger working age group (25‐39) will account for 18.6 percent of the growth.
11Florida Housing Market is Resilient...
Documentary Stamp Tax collections saw 8.4% growth in FY 2019‐20 over FY 2018‐19, despite activity in one
quarter being affected by the pandemic. The market environment supporting this result primarily resulted
from the record low interest rates resulting from the Federal Reserve’s actions to stem the severity of the
12
pandemic’s economic disruption in the second quarter of 2020.Homeownership Rate Still Below Normal...
From 2013 to 2019, Florida was below its long‐run average homeownership rate, although the 2019
calendar year very nearly matched it at 66.0 percent. Quarterly data for the 2020 calendar year
indicates that the state will finally move above the long‐run average when the year is done: Q1—67.9
percent; Q2—70.1 percent; and Q3—69.7 percent.
13Permits Are Still Well Below Historic Norms…
Single‐Family building permit activity, an indicator of new construction, remains in positive territory,
beginning with strong back‐to‐back growth in both the 2012 and 2013 calendar years (over 30% in each
year). The final data for the 2014 calendar year revealed significantly slowing (but still positive) activity—
posting only 1.6% growth over the prior year. However, annual activity for the 2015 through 2018
calendar years again ran well above their individual periods a year prior, posting double‐digit growth in
each year: 20.3% in 2015, 11.1% in 2016, 13.5% in 2017, and 13.8% in 2018. In 2019, activity slowed again
to 2.9%.
Even with the strong percentage growth rates in six of the last eight calendar years, the level is still low by
historic standards – just 63.8% of the long‐run per capita level. The preliminary data for the 2020 calendar
year is suggesting more robust growth than seen in 2019, despite the pandemic.
14Existing Home Market
All metrics point to an existing home
market that appears to be fully
recovered. Existing home sales
volume in each of the calendar years
from 2014 to 2019 exceeded the 2005
peak year, and 2020 is expected to do
the same. The story is similar for sales
price. Florida’s existing home price
gains have roughly tracked national
gains over the last five years; however,
growth in the state’s median home
price for single family homes has
generally stayed upwardly steady as
the national median peaks and dips.
Even so, the national median price
increases have outpaced Florida’s; the
state’s median price in October was 96
percent of the national median price
after passing it briefly in February
2018. Florida’s median price finally
surpassed its own prior peak
($256,200 in June 2006) in June 2018.
The state reached a new high of
$305,000 in October 2020 and
Data through November 2020
maintained it in November. 15Florida and U.S. Median Gross Rent
(in Current Dollars)
Median Gross Rent Average Gross Rent
Year
Florida Florida
United relative to United relative to
Florida Florida
States United States United
States States
2005 728 809 111% 803 863 107%
2006 763 872 114% 844 932 110%
2007 789 925 117% 878 991 113%
2008 824 947 115% 919 1,015 110%
2009 842 952 113% 938 1,024 109% Florida Quarterly Vacancy Rate:
2010 855 947 111% 954 1,017 107% 2020:Q3 7.0
2011 871 949 109% 973 1,027 106%
2012 884 954 108% 990 1,037 105%
2013 905 972 107% 1,016 1,050 103%
2014 934 1,003 107% 1,047 1,087 104%
2015 959 1,046 109% 1,077 1,129 105%
2016 981 1,086 111% 1,105 1,161 105%
2017 1,012 1,128 111% 1,138 1,203 106%
2018 1,058 1,182 112% 1,182 1,251 106%
Florida Renter Fraction
2019 1,097 1,238 113% 1,223 1,301 106%
Date US Florida
Source: U.S. Census Bureau, American Community Survey, 1-Year, 2005-2019. 2019 35.89% 33.75%
2018 36.05% 34.08%
2017 36.13% 34.85%
Challenging housing costs and shifting preferences 2016 36.88% 35.87%
among Millennials have caused residential rental 2015 36.97% 36.22%
2014 36.90% 35.95%
vacancies to tighten strongly over the last five years 2013 36.50% 35.21%
(2015 through 2019) even as price pressure builds. 2012 36.09% 34.36%
2011 35.42% 33.28%
However, the overall share of Florida’s population
2010 34.65% 31.85%
living in rentals is dropping as homeownership rises. 2009 34.13% 31.52%
1650
60
70
80
90
100
110
1978‐01‐01 120
1978‐09‐01
1979‐05‐01
1980‐01‐01
1980‐09‐01
1981‐05‐01
1982‐01‐01
1982‐09‐01
1983‐05‐01
1984‐01‐01
1984‐09‐01
1985‐05‐01
1986‐01‐01
1986‐09‐01
1987‐05‐01
1988‐01‐01
1988‐09‐01
1989‐05‐01
1990‐01‐01
1990‐09‐01
1991‐05‐01
1992‐01‐01
1992‐09‐01
1993‐05‐01
1994‐01‐01
1994‐09‐01
1995‐05‐01
1996‐01‐01
1996‐09‐01
1997‐05‐01
1998‐01‐01
1998‐09‐01
1999‐05‐01
2000‐01‐01
2000‐09‐01
2001‐05‐01
2002‐01‐01
2002‐09‐01
2003‐05‐01
2004‐01‐01
2004‐09‐01
2005‐05‐01
2006‐01‐01
2006‐09‐01
2007‐05‐01
2008‐01‐01
2008‐09‐01
2009‐05‐01
2010‐01‐01
2010‐09‐01
2011‐05‐01
2012‐01‐01
University of Michigan: Consumer Sentiment (UMSCENT)
2012‐09‐01
2013‐05‐01
2014‐01‐01
2014‐09‐01
2015‐05‐01
2016‐01‐01
2016‐09‐01
2017‐05‐01
2018‐01‐01
2018‐09‐01
Nationally, the sentiment reading for December 2020 (80.7) is below the index
2019‐05‐01
2020‐01‐01
range across all of the pandemic‐affected months is 71.8 (April) to 81.8 (October).
2020‐09‐01
average since inception (86.2), but markedly above the Great Recession depths. The
Consumer Perceptions Surprisingly Resilient
17Florida-Based Downside Risk
Florida’s tourism‐sensitive economy is particularly vulnerable to the longer‐term effects of the
pandemic. Previous economic studies of disease outbreaks have shown that it can take as much as
12 to 15 months after the outbreak ends for tourism to return to pre‐disease levels. The
magnitude of this event is greater. The total number of tourists declined ‐60.3 percent from the
prior year in the second quarter of 2020. After that breathtaking decline, tourism in the third
quarter managed to recover to 35.4 percent of the prior year’s level, buttressed by the stronger
than anticipated number of domestic visitors travelling by car. Several industry groups have
already predicted that it will take at least two years to reach recovery from this pandemic. Current
expectations are that leisure driving vacations will recover first, and then—in order—business
travel, domestic air travel, and international travel.
The Legislative Office of Economic and
Demographic Research has updated and refined
an empirical analysis of the various sources of
the state’s sales tax collections. In FY 2017‐18,
sales tax collections provided over $24.1 billion
dollars or 76.4% of Florida’s total General
Revenue collections. Of this amount, an
estimated 13.4% (over $3.2 billion) was directly
attributable to purchases made by tourists.
Preliminary data for FY 2018‐19 indicates that
the visitor share rose to 14.5% for nearly $3.7
billion dollars.
18Federal Open Market Committee
Commercial Real Estate… Minutes from late July:
Bank lending standards for
commercial real estate (CRE) loans
have tightened, according to the July
Senior Loan Officer Opinion Survey
(SLOOS), and CRE loan growth at
banks slowed. The credit quality of
existing CRE loans continued to
deteriorate as further signs of
repayment difficulties emerged,
most notably in the lodging and
retail sectors.
Financing conditions for small
businesses remained tight. Banks
reported in the July SLOOS that the
level of standards for small
businesses was at the tighter end of
the range since 2005. At the same
time, the credit needs of small
businesses remained high, as the
prospect arose of many businesses
having to shut down operations
In addition to Sales Tax, worsening commercial real estate again in response to rising
coronavirus cases. Small business
conditions materially affected the new forecasts for loan performance deteriorated
Corporate Income Tax and Ad Valorem. Reduced profitability, significantly; short‐term
involuntary structural changes, business failures and delayed delinquencies were comparable with
business formations are all factors. levels seen in early 2008.
19Florida Taxable Sales…
Looking at the year‐over‐year change in 20.0%
taxable sales, Florida’s volatility over the
prior year has been dramatic since the
onset of the pandemic. Even at that, 10.0%
taxable sales activity has been bolstered
by redirected spending from the hard‐
hit service sector and some consumers’ 0.0%
0 20 40 60 80 100 120 140
ability to draw down atypically large
savings that built up during the
pandemic. After increasing to a 33.7 -10.0%
percent rate in April from the 7.9
percent for the entire 2018‐19 fiscal
-20.0%
year, just released personal income data
indicated that the personal savings rate
had further dropped to 12.9 percent in
-30.0%
November. By EDR’s analysis, reduced
savings have been responsible for at
least $177.6 million in sales tax
-40.0%
collections since the beginning of the
FL Taxable Sales Tax Growth Over the Same Month, Prior Year
fiscal year—and likely more as Poly. (FL Taxable Sales Tax Growth Over the Same Month, Prior Year)
purchasing stays focused on taxable
Data through November 2020
goods rather than services. However,
how people spend has changed. On November 19, 2020, the Census Bureau of the US Department of Commerce
released its quarterly retail e‐commerce sales report. The third quarter 2020 e‐commerce sales number increased
36.7 percent from the third quarter of 2019, while total retail sales increased just 7.0 percent. E‐commerce sales for
the third quarter of 2020 accounted for 14.3 percent of total sales, as compared to the third quarter of 2019 when
the share was 11.2 percent.
20General Revenue Forecast Comparison…
January 2020 Sales Tax Share of
Through November, revenue estimates had gained
Fiscal Year Forecast Growth GR Growth GR
slightly over $1.0 billion to the Conference
expectations, with reason to believe that December
2004-05 24,969.4 17,628.9 70.6%
2005-06 27,074.8 8.4% 19,367.4 9.9% 71.5%
would add to the overage. Because the continuing
2006-07 26,404.1 -2.5% 19,435.2 0.4% 73.6%
risk to the forecast is still high due to the pandemic-
2007-08 24,112.1 -8.7% 18,428.9 -5.2% 76.4% induced economic effects on Florida’s tourism-
2008-09 21,025.6 -12.8% 16,531.4 -10.3% 78.6% sensitive economy, the Revenue Estimating
2009-10 21,523.1 2.4% 16,014.7 -3.1% 74.4% Conference largely banked the year-to-date overage
2010-11 22,551.6 4.8% 16,638.3 3.9% 73.8% and assumed that the rest of the year would perform
2011-12 23,618.8 4.7% 17,422.0 4.7% 73.8% in accordance with the prior forecast. Even at that, the
2012-13 25,314.6 7.2% 18,417.6 5.7% 72.8% Conference made sizeable adjustments to the
2013-14 26,198.0 3.5% 19,707.7 7.0% 75.2% forecast adopted in August. Anticipated revenues
2014-15 27,681.1 5.7% 21,062.7 6.9% 76.1% were revised upward by nearly $1.5 billion in FY
2015-16 28,325.4 2.3% 21,998.0 4.4% 77.7% 2020-21 and by $623 million in FY 2021-22, for a two-
2016-17 29,594.5 4.5% 22,987.4 4.5% 77.7% year combined increase of $2.1 billion—restoring 39.0
2017-18 31,218.2 5.5% 24,138.7 5.0% 77.3% percent of $5.4 billion reduction taken in August.
2018-19 33,413.8 7.0% 25,385.3 5.2% 76.0%
2019-20 33,249.3 -0.5% 26,185.6 3.2% 78.8% By far the largest adjustment in the new forecast
2020-21 34,449.3 3.6% 27,022.9 3.2% 78.4% relates to Sales Tax. The anticipated gain to General
2021-22 35,686.8 3.6% 27,849.6 3.1% 78.0% Revenue is $806.6 million in FY 2020-21 and $205.3
2022-23 37,141.1 4.1% 28,756.3 3.3% 77.4% million in FY 2021-22, with five of six sales tax
2023-24 38,372.6 3.3% 29,705.9 3.3% 77.4% categories seeing increases in FY 2020-21. Only
2024-25 39,702.6 3.5% 30,709.1 3.4% 77.3% expected revenues in the vulnerable Tourism &
Recreation sector were reduced. Even though a
December significant part of this category relates to the number
2020 Sales Tax Share of of out-of-state tourists, this category also includes
Fiscal Year Forecast Growth GR Growth GR sales to Florida residents at restaurants, local
2019-20 31,366.2 -6.1% 24,591.3 -3.1% 78.4% attractions and other leisure-based activities which
2020-21 32,476.0 3.5% 24,948.9 1.5% 76.8% have also been negatively affected by the pandemic.
2021-22 34,314.1 5.7% 26,803.6 7.4% 78.1% The year-to-date gain in this category relates to
2022-23 36,064.5 5.1% 28,005.1 4.5% 77.7% restaurant sales which are particularly sensitive to
2023-24 37,566.7 4.2% 29,130.4 4.0% 77.5% individual social-distancing decisions as consumers
2024-25 39,012.5 3.8% 30,204.8 3.7% 77.4% face a resurgence in the pandemic.
2025-26 40,386.7 3.5% 31,165.7 3.2% 77.2% 21General Revenue FY 2020‐21 …
Outlook… Beginning Balance
Estimated Revenues
6,352.2
30,990.1
Net Misc Receipts through 8/14/2020 346.1
December 2020 Forecast Change 1,485.9
Tobacco Settlement Lawsuit Payment 192.9
COVID‐19 Reimbursement (August to December Outlooks) 68.9
COVID‐19 Reimbursement (Post‐December Outlook) 3.1
Federal Funds Interest Earnings Rebate (0.7)
FEMA Reimbursement (Hurricanes Irma & Michael) 21.1
FEMA Reimbursement (Hurricanes Irma & Michael: Post‐December) 0.1
Additional Retrospect‐Related Adjustments (236.4)
Total Revenues 39,223.3
Total Appropriations, GAA Actions & Substantive Appropr 34,795.9
Transfer to BSF 100.0
Budget Amendments through 8/14/2020 896.2
Bridge Loans: Hurricane Sally 5.0
Hurricane Response Budget Amendments (Sally) 7.1
Placed in Reserve: COVID‐19 Budget Amendment (49.4)
CARES Act Funds for Reemployment Assistance 67.8
CARES Act Funds to Local Governments 339.8
CARES Act Funds to Local Governments (Post‐December Outlook) 591.2
NOTE: Outlook balance reflects COVID‐19 Response Budget Amendments 522.7
all actions through 12/21/2020. 37,276.3
Unallocated General Revenue 1,947.0
Difference from official August 14, 2020 Outlook 580.4
Difference from official December 14, 2020 Outlook 897.9
22You can also read