Cycles Within the US Stock and Real Estate Markets - Regions
←
→
Page content transcription
If your browser does not render page correctly, please read the page content below
Cycles Within the US Stock and
Real Estate Markets
                                                                                                      October 2020

T   he US stock and real estate markets are governed by very distinct cyclical patterns. These patterns have
    been traced throughout history going back to the inception of public land sales to private citizens starting in
1800. While there are many cycles we could explore, some of the most important are the 80-year Generational
Turning Cycle, the Secular Bull/Bear Stock Cycle, the 18.6-Year Cycle and the 11-Year Cycle. We will explore the
latter 3 cycles in earnest in this paper in order to hopefully provide the reader with a clear picture as to how
these cycles combine to move the US economy, stock market and real estate market forward through time and
cause massive price oscillations along the way.

Why Study Cycles?

Cycles rule our universe. They are all around us. They are so prevalent that we often do not even notice them.
The moon cycles every month from full to new and back again. The seasons cycle as the earth moves closer
to and further away from the sun. Life cycles progress as we are born, grow up, raise our own children, teach
them the lessons we have learned and then we pass away. There are countless other cycles that we either don’t
notice or just dismiss in our everyday lives.

The most interesting cycles are the ones that make up time. For some reason, we in the Western world tend to
think of time as a linear progression moving forward without ever looking back. This is curious because all our
time is based on circular movements of the planets…specifically the earth rotating as it moves in an oblong
circular pattern around the sun marking out days and years. The very nature and structure of time is based on
circular patterns, yet we think of it in a linear pattern. Yet these are the cycles that can teach us the most about
how our universe works. This includes economies and markets.

Maybe the reason that cycles befuddle us so much is that we expect there to be clean easy answers to everything
in life, and cycles provide approximations and pieces of the puzzle. For instance, there is not one clear cycle
that determines every movement in markets, but a series of cycles that govern the major moves in markets.
This series of cycles rises from smallest to largest or vice versa providing a structure through which to see the
major movements of economies and markets. Think of the gears of a clock starting with the smallest that
determines the seconds, then the minute gear, then the hourly gear, then the daily gear and so on up through
time. You can move from smallest to largest and back down through the gears as they all work together to
make the clock work as it should.

There are several books that have been instrumental in my understanding of cycles and my ability to piece
them together to create the structure that I believe I have found. Each of these books have focused on a specific
time length cycle and it’s affects on the world. It is only when you put them together that you can gain a clear
picture of how the machine works. Two of the most transformative books I have read on the subject of cycles are
The Fourth Turning by Strauss and Howe and The Secret Life of Real Estate and Banking by Phillip J Anderson
– which has had by far the most influence on the way I see economic and market cycles. The latter book is so
important in my view that I read it every single year as a refresher. A third which has also contributed to my
understanding of cycles is Zero Hour by Harry Dent and Andrew Pancholi.

Differing Cycle Lengths

Viewing these cycles in order from largest to smallest and adding the pieces of the total cycle picture that each
author has focused on is a little like looking at an old lithograph with multiple layers that can be added or
removed in order to provide a complete or incomplete picture. If you are looking at just one layer, you won’t
be able to see the full picture or how the different layers interact with one another. The cycles that are stacked
                                                                       Author:                     Ryan Jones, CMT
                                                                       Regions Investment Management, Equity Analyst

                                                                                                                  1
CYCLES WITHIN THE US STOCK AND REAL ESTATE MARKETS REGIONS ASSET MANAGEMENT
in this structure from largest to smallest are the Generational Turning Cycle > Secular Bull/Bear Market Cycle
> 18.6 Year Real Estate/Gann Cycle >11 Year Panic Cycle > 3 Year Stock/Economy Cycle (161 Weeks) > 18 Month
Stock Cycle > 9 Month Stock Cycle. There are other smaller cycles that work within this structure such as the 20
week intermediate cycle and the 10 week daily cycle, but these cycles are small enough that they are largely
inconsequential to the overall structure.
By stacking these cycles on top of each other, you will be able to see how each one interacts with the next.
For instance, the 18.6 year real estate/Gann cycle acts differently in both severity and length of movements
when placed inside of a secular bull market vs. a secular bear market. Also, generational fourth turnings tend
to start with a financial crisis which coincides with a secular bear market. This massive crisis sets the tone
for sociological and economic moods that come later. As the fourth turning progresses, market participants
continue to look over their shoulders for another such crisis for decades to come, causing most of them to
miss a large portion of the secular bull market that started when the financial crisis subsided. First and third
turnings tend to be eras of economic prosperity that last for a couple of decades and lead into the next secular
bear market which kicks off the second and fourth turnings respectively.
Secular Bull/Bear Cycles
Each cycle is like a key that must be turned in order to determine how the next smaller cycle will act. After
turning the first key – which is the generational turning cycle – the next one to look at is the secular bull/bear
market cycle. Going back to the beginning of the data I have access to in 1920, secular bull markets tend to last
25-26 years and secular bear markets tend to last 6-10 years. The secular bull and bear markets since 1929 look
like this:
• Secular bear 1929-1942 ~ 13 years
• Secular bull 1942-1966 ~ 24 years
• Secular bear 1966-1974 ~ 8 years
• Secular bull 1974-2000 ~ 26 years
• Secular bear 2000-2009 ~ 9 years
• Secular bull 2009-ongoing; expected to end between 2034-2037
Source: Sourced Data from StockCharts.com; W.D. Gann Cycle Table
Figure 1 shows the long-term Figure 1:
Figure 1
chart of the S&P 500. Secular
bear markets are shown in the
red boxes, and secular bull
markets are shown by the green
trend lines.
An interesting thing to note
about secular bull/bear markets
is that declines in secular bear
markets can be 50% or greater,
whereas declines in secular bull
markets are usually less than
20%. Declines in secular bull
markets are typically contained
by the upward sloping 200 week
moving average when looking
at the S&P 500 and the upward
sloping 150 week moving
average when looking at the
NASDAQ.
Source: Chart Courtesy of
Stockcharts.com
2CYCLES WITHIN THE US STOCK AND REAL ESTATE MARKETS REGIONS ASSET MANAGEMENT
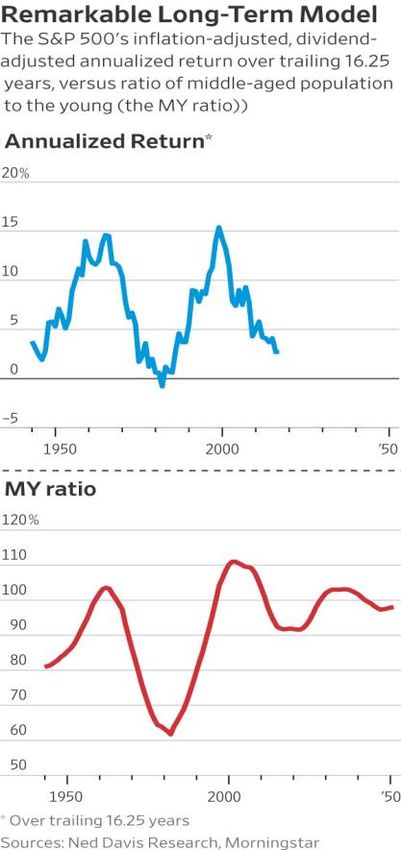
Secular bull and bear markets are driven largely by demographic factors Figure 2:
as large generations are born, grow up and enter the work force. As they
reach their peak spending years, they spend money on goods and services
which drives economic growth and profitability of the companies traded
on the exchanges. They also begin saving for retirement and use their
peak income years to buy stocks which also drives stock prices higher.
After the large generation drives earnings and economic growth to their
excesses – usually around the time the generation hits the demographic
peak spending age – then a secular bear market begins. The secular
bear market has two purposes: 1) allow the excesses built up in the
prior secular bull to be worked off and 2) allow the smaller generation to
pass through their peak spending years as the economy makes way for
the next large generation. This oscillation between larger and smaller
generations is captured quite well by the Middle-Young Ratio which was
created by the Brookings Institute.
18.6 Year Real Estate/Gann Cycle
The next cycle to look at once you determine whether you are in a
secular bull or bear is the 18.6 year Real Estate/Gann cycle. This is a very
interesting and accurate cycle based on the work of two men. The first
man to discover it and put it down on paper was an analyst and trader
in the early 1900’s named W.D. Gann. He reportedly discovered the cycle
in 1910 and projected it forward through time. It has been uncanny in
the dates that it has predicted as turning dates from up to down cycles.
It predicted the March 2000 market top, the 2003 bottom, the 2007 top
and the March 2009 bottom. It also warned of the panic in late 2015/
early 2016, as well as the panic sell off which began in October 2018.
The original chart was based on columns of 19 years which had to be
adjusted after so many columns to account for the difference between a full 19 years and the 18.6 year cycle. I
took the liberty of adjusting the chart starting in the year 1990 to show the chart on an actual 18.6 year cycle. It
is shown in figure 3 below.
Figure 3:
1990.65 2009.25 2027.85 Extreme low stock prices, beginning of new 18.6 year cycle
1973 1991 2010 2028
1974 1992 2011 2029
1975 1993 2012 2030
1976 1994 2013 2031 Stock prices breakout to large upside move
1977 1995 2014 2032
1978 1996 2015 2033 Minor Panic
1979 1997 2016 2034 Minor Panic Bottom, stock price low
1980 1998 2017 2035
1981.65 1999 2018.85 2036 High stock prices, mid-cycle market top
1982 2000.25 2019 2037.45
1983 2001 2020 2038 Panic
1984.65 2002 2021.85 2039 Bottom of bear market, stock price low
1985 2003.25 2022 2040.45
1986 2004 2023 2041
1987 2005 2024 2042 Real Estate cycle top, beginning of 4 year downturn
1988 2006.6 2025.2 2043.8 Stock Market cycle top, extreme bear market
1989.25 2007.85 2026.45 2044
1990 2008 2045.05
Source: W.D. Gann
It was a mystery to all who came across this cycle as to why it worked until the second man completed his work
on the cycle and applied it to real estate and the overall economy. His name is Phillip J Anderson of Australia. In
2012, he wrote a book about his findings entitled The Secret Life of Real Estate and Banking. Based on my study
3CYCLES WITHIN THE US STOCK AND REAL ESTATE MARKETS REGIONS ASSET MANAGEMENT
of market and economic history, Mr. Anderson’s work provides the absolute best structure for determining
economic and stock market moves. Mr. Anderson studied real estate cycles going back to the 1600’s in England
up through the Great Financial Crisis of 2008. He found that the economy, which is driven by this 18.6-year
real estate cycle, moves in very predictable Figure 4:
ways throughout the cycle and events can be
determined well ahead of time. In fact, a man
named Fred Harrison predicted the 2008 real
estate financial crisis using this cycle as far
back as the 1990’s.
The structure consists of a 7-year recovery
from the previous real estate decline, followed
by a 1-2 year mid-cycle slow down. This mid-
cycle slowdown leads to the bull phase of the
real estate cycle of approximately 5 years. This
5 year bull phase is followed by a 2 year bubble
phase which ultimately leads to the 4 year real
estate decline. I have recreated the structure
of the real estate cycle as Mr. Anderson has
described it as shown in figure 4. Source: The Secret Life of Real Estate and Banking Phillip J. Anderson; Akhil
Patel
Mr. Anderson also constructed a 24-hour economic clock which lays out every step that the economy takes
through the cycle. Steps 1-24 are shown below.
The 24 steps are as follows:
Steps 1-4: first phase of real estate activity
1. Ready for next boom
2. Gross rents improve
3. Net rents improve
Steps 3-6: decline in vacancy rates
4. Higher net rents equals higher prices for established buildings
5. More profitable to build
6. Rapid expansion in new construction
Steps 7-9: construction takes off
7. Continued expansion of new construction
8. Expansion of banks
9. Easy credit
Steps 10-12: credit growth
10. Increased building activity absorbs vacant land
11. Mid-cycle slowdown
12. Mid-cycle slowdown begins to turn
Steps 13-18: real estate cycle in full swing
13. The land boom (world’s tallest buildings; complaints about property taxes)
14. Lavish government spending for public works
15. Real estate activity frenetic (the peak)
16. Activity slackens (but confidence remains high)
17. Foreclosures and bankruptcies increase
18. Stocks enter bear market from past all-time high
Steps 19-21: vacancies increase
19. Credit creation institutions reverse policies
20. Economic activity stalls
4CYCLES WITHIN THE US STOCK AND REAL ESTATE MARKETS REGIONS ASSET MANAGEMENT
21. Wipe out of debts/stagnation
Steps 22-24: land price induced recession
22. Wreckage is cleared away
23. Stocks start climbing
24. New cycle begins
There are also longer cycles that are just multiples of the 18-year cycle. For some unknown reason, when the
cycles stretch out to multiples of the 18.6-year cycle, the multiples are of 18 years, not 18.6 years. Examples of
these cycles that Andrew Pancholi wrote about in his book Zero Hour are the 45-year, 54-year, 72-year and 90-
year cycles. He also wrote about 50 and 100-year cycles, but I don’t find them as useful as the 18-year based
cycles.
The next cycle is the 11-year cycle. This cycle is nearly as important as the 18.6-year cycle for determining turn
dates for the stock market. There have been some amazing turns called out by this cycle. In the table in figure
5, I have gathered some of the more remarkable cycle turns over the last 35 years.
Figure 5:
Year Event Market Decline Previous Event Date
1987 Stock Market Crash 36%
1998 Long Term Capital Management Crisis 28% 1987 Crash
2000 S&P 500 Market Top 50% 1989 Savings and Loan Market Top
2001 September 11 Crash Lows 29% 1990 Savings and Loan Market Bottom
2009 Financial Crisis Market Low 58% 1998 Asian Currency Crisis Bottom
2011 European Debt Crisis 22% 2000 Tech Bubble Top
2015/2016 Chinese Market Crash Issues 21% 2014/2005 Twin Declines
2018 Taper Tantrum 20% 2007 Market Top
2020 Coronavirus Crash 35% 2009 Financial Crisis Market Bottom
Source: Sourced Data from Stockcharts.com
Some of the worst short-term panics we have seen since 1987 have come on this 11-year cycle, they are: the
1987 crash, the 1998 Long Term Capital Management sell off, the 2009 Great Financial Crisis bottom and the
2020 Coronavirus crash. There is no event shown before the 1987 crash because the previous event was the
1974 bear market low during the Arabian Oil Crisis. In this particular case the 45-year cycle overrode the 11-year
cycle and we had a crash low in 1974 instead of the expected 1976.
The strongest market events come when multiple cycles line up together. This happened in 2020 when the 11-
year, 18.6-year and 45-year cycles all lined up together. The 18.6-year cycle was from the 9/11 crash low, the
11-year cycle was from the 2009 Financial Crisis market low and the 45-year cycle was from the 1974 crash low.
Figure 6 is a chart of the Nasdaq going back to 1987. The bold red and green vertical lines are the 18.6-year
cycle top and bottom turning points, while the dotted green and red vertical lines are the 11-year cycle top and
bottom turning points. There is speculation of a possible cycle turn for the market around April 2021 if one is
studying (following) both the 11-year cycle and the 18.6-year cycle. April 2021 is 11 years from the 2010 flash
crash and 18.6 years from the 2002 Tech Bubble absolute price low. The end of this 3-year period of turmoil
in which the S&P 500 has fallen by over 20% multiple times and GDP contracted by over 30% in the second
quarter of 2020, is called out in the 18.6-year cycle tables above, may end in October 2021.
By understanding the different cycles and how they interact with each, investors are much more likely to
understand what the economy should do next and where declines will most likely happen in the timeline of
the stock market. When taking the interaction between secular cycles, 18.6-year cycles, 11-year cycles and 18-
year multiple cycles investors can not only determine the most likely times that declines will happen but also
the relative severity of declines. This information is helpful in providing investors a better understanding of the
market and how cyclical in nature it is, which can help them to make more informed decisions for investments
now and in the future.
5CYCLES WITHIN THE US STOCK AND REAL ESTATE MARKETS REGIONS ASSET MANAGEMENT
Figure 6:
Figure 6
Source: Chart Courtesy of Stockcharts.com
© Regions Bank, Member FDIC. This publication has been prepared by Regions Investment Management, Inc. (RIM) for Regions Bank for distribution
to, among others, Regions Wealth Management clients. RIM is an Investment Adviser registered with the U.S. Securities & Exchange Commission
pursuant to the Investment Advisers Act of 1940. RIM is a wholly owned subsidiary of Regions Bank, which in turn, is a wholly owned subsidiary of
Regions Financial Corporation. While the commentary accurately reflects the opinions of the Analyst by whom it is written, it does not necessarily
reflect those of Regions Bank or RIM. This publication is solely for information and educational purposes and nothing contained in this publication
constitutes an offer or solicitation to purchase any security, the recommendation of any particular security or strategy or a complete analysis of any
security, company or industry or constitutes tax, accounting or legal advice. Information is based on sources believed by RIM to be reliable but is not
guaranteed as to accuracy by Regions Bank, RIM or any of their affiliates. Commentary and opinions provided in this publication reflect the judgment
of the authors as of the date of this publication and are subject to change without notice. Certain sections of this publication contain forward looking
statements that are based on the reasonable expectations, estimates, projections and assumptions of the authors, but forward-looking statements
are not guarantees of future performance and involve risks and uncertainties, which are difficult to predict. Investment ideas and strategies presented
may not be suitable for all investors. No responsibility or liability is assumed by Regions Bank, RIM or their affiliates for any loss that may directly or
indirectly result from use of information, commentary or opinions in this publication by you or any other person. Trust and investment management
services are offered through Regions Wealth Management, a business group within Regions Bank. Investment advisory services are offered through
RIM. In some cases, RIM’s investment management services and/or strategies will be utilized by Regions Wealth Management for its trust and
investment management clients. RIM receives compensation from Regions Bank for providing certain services, including market commentary.
When applicable, RIM receives additional compensation based upon the assets in Regions Wealth Management client accounts managed according
to RIM’s strategies. For additional information concerning RIM or its strategies, please see RIM’s Form ADV Part 2A, which is available by calling 205-
264-6735. Neither Regions Bank, nor Regions Asset Management (collectively, “Regions”) nor the Regions Bank subsidiary, Regions Investment
Management, Inc. (RIM), are registered municipal advisors, nor provide advice to municipal entities or obligated persons with respect to municipal
financial products or the issuance of municipal securities (including regarding the structure, timing, terms and similar matters concerning municipal
financial products or municipal securities issuances) or engage in the solicitation of municipal entities or obligated persons for such services. With
respect to this presentation and any other information, materials or communications provided by Regions or RIM, (a) Regions and RIM are not
recommending an action to any municipal entity or obligated person, (b) Regions and RIM are not acting as an advisor to any municipal entity or
obligated person and do not owe a fiduciary duty pursuant to Section 15B of the Securities Exchange Act of 1934 to any municipal entity or obligated
person with respect to such presentation, information, materials or communications, (c) Regions and RIM are acting for their own interests, and
(d) you should discuss this presentation and any such other information, materials or communications with any and all internal and external
advisors and experts that you deem appropriate before acting on this presentation or any such other information, materials or communications.
Investment, Insurance and Annuity Products
Are Not FDIC-Insured | Are Not Bank Guaranteed | May Lose Value | Are Not Deposits
Are Not Insured by Any Federal Government Agency | Are Not a Condition of Any Banking Activity
6You can also read