THE UA TAKE - SECOND QUARTER 2018: Urban Analytics
←
→
Page content transcription
If your browser does not render page correctly, please read the page content below

THE UA TAKE – SECOND QUARTER 2018:
                                        MIXED SIGNALS

A number of factors aligned in the first two quarters of 2018 to dampen buyer demand and slow
sales activity in some sectors of the new multi‐family home market. In addition to the
introduction of OSFI’s more stringent new mortgage stress test qualification rules and higher mortgage
rates, the NDP government demonstrated its intention to attack demand (while ignoring supply issues)
in the housing market with the announcement of several new taxation policies. While these
new policies are theoretically designed to encourage existing home owners to sell their properties
rather than pay the higher taxes, thereby increasing supply and reducing prices, they will prove to be
little more than an annoyance and have very limited impact on supply or affordability, particularly
in the new multi‐family home sector.
These measures, combined with the continued loud chatter in traditional and social media and at nearly
every social gathering led to lower urgency levels among some buyer groups, which in turn
lowered overall new condominium and townhome sales in the second quarter of 2018. The lower
urgency levels and sale volumes were not felt equally across all sectors and in all sub‐markets of the
region. While some product forms in certain neighbourhoods experienced significantly lower demand,
which in some cases prompted high‐valued incentives and realtor bonuses, many projects
continued to achieve strong absorptions, albeit at lower average sale values.
Projects targeting downsizer purchasers with existing homes to sell in higher valued neighbourhoods
felt the lower buyer urgency levels most. The lingering soft conditions in the detached home sector
of the resale market has impacted this buyer group more than others. There is greater
uncertainty over the value of their current home today, let alone in two to three
years when the presale unit they’re
Metro Vancouver UA Take – Q2‐2018               1                           urbananalytics.ca
considering completes. The market for their current home has also been impacted by the loss in buying
power among move‐up purchasers who they would typically target. Those who need to sell are settling
for lower sale prices while those who don’t need to sell are delaying their decision to purchase a new
home to downsize into until values for resale detached homes stabilize. While detached homes have
dropped in value in some of the higher valued neighbourhoods of the region, the lower values are
insignificant relative to the value increase these homes have experienced over the past few years.
There was a noticeable flattening in price growth across the region in the new multi‐family home market
in Q2‐2018. However, in some areas and sectors of the market, developers who sensed the softer market
conditions adjusted their sale value expectations below what could have been achieved last year and in
the first quarter of 2018. Developers and marketing firms that position product being launched to reflect
the shifting market conditions and buyer expectations (as they relate to pricing) have continued to
achieve strong and steady sales activity. Projects launched in the second quarter at list prices that don’t
consider the shift in buyer demand and pricing expectations have experienced much lower buyer
urgency levels and slower absorptions.
Unlike recent years when most developers and marketing firms ignored the historic seasonal market
norms and launched new projects through the summer months, UA anticipates fewer significant new
project launches this July and August as developers continue to monitor and assess market conditions
and buyer sentiments. Some other issues UA is monitoring closely that may impact the new multi‐family
home market in the second half of 2018 include:
Municipal Elections – The quickly approaching municipal elections in October are likely to
increase the level of rhetoric and discussion around the housing issue throughout Metro
Vancouver. The louder this rhetoric and discussion becomes, the more likely that uncertainty and
fatigue creeps into the mindset of prospective new homebuyers. Some mayoral and council
hopefuls who’ll undoubtedly call for a slowing of new development approvals to gain favour with
NIMBY voters will only add to the rhetoric and potential buyer uncertainty and fatigue.
Political Interference – Any additional policies introduced by the provincial government to reduce
demand for residential real estate could dampen prospective buyer urgency and therefore sales
activity in all sectors of the market.
Interest Rates – With the Canadian economy projected to continue its strong performance (three
percent growth anticipated in Q3‐2018), the Bank of Canada is almost certain to increase its
benchmark lending rate at least once more this fall, which would compound the drop in
purchasing power already incurred by many prospective homebuyers this year.
Geopolitics – While the Canadian economy continues its strong performance, several geopolitical
issues (trade wars, tariffs, conflicts, etc.) continue to pose a threat to consumer confidence
locally.
Metro Vancouver UA Take – Q2‐2018 urbananalytics.ca
2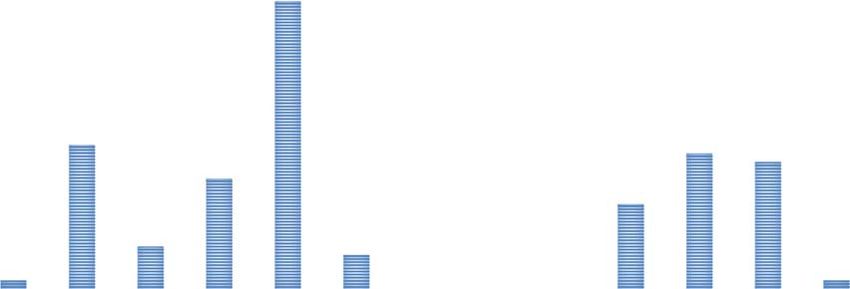
The following is an analysis of Q2‐2018 sales activity and the inventory status as at the end of the quarter.
Sales and Inventory Analysis
After holding its own in the first quarter of 2018, Metro Vancouver’s new multi‐family home market
began to feel the effects of the various policies introduced by various levels of governments and agencies
early this year. Total new condominium and townhome sales across the region fell by 28 percent in Q2‐
2018 compared to the first quarter and by 34 percent relative to Q2‐2017. While the lower sales can be
partially attributed to an 18 percent drop in the number of new units released to the market in the
second quarter, lower buyer urgency and greater certainty was also a factor.

                               QUARTERLY NEW MULTI‐FAMILY HOME SALES
 8,000

 7,000

 6,000

 5,000

 4,000
                                                                                                                           3,254
 3,000

 2,000                                                                                                                     2,009

 1,000                                                                                                                     1,245

     0
           Q2‐2010   Q2‐2011    Q2‐2012            Q2‐2013        Q2‐2014    Q2‐2015         Q2‐2016    Q2‐2017     Q2‐2018

 Chart 1                              Total                 N. of Fraser      S. of Fraser

Strong sales experienced in the first quarter of 2018 resulted in a more moderate nine percent reduction
in sales volume in the first half of 2018 compared to 2017; much of the drop can be attributed to lower
sales activity in the South of Fraser sub‐markets.

                                    YTD NEW MULTI‐FAMILY HOME SALES
 14,000

 12,000

 10,000

  8,000                                                                                                                    7,768
  6,000
                                                                                                                           5,566
  4,000

  2,000                                                                                                                    2,202

      0
             2010      2011         2012             2013             2014    2015            2016        2017        2018
                                           Total             N. of Fraser     S. of Fraser
Chart 2

Metro Vancouver UA Take – Q2‐2018                                                                      urbananalytics.ca
                                                                  3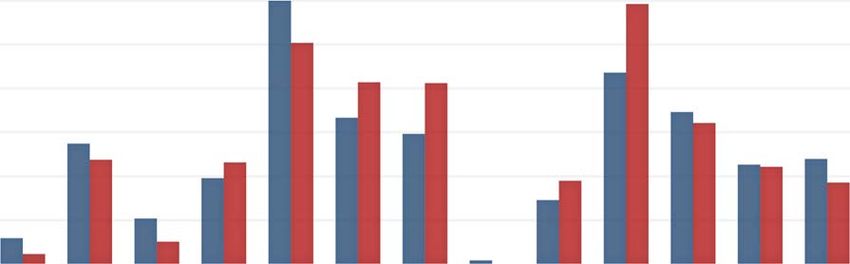
While the launch of several comprehensive new concrete condominium projects during the first quarter
of 2018 helped generate a substantial increase in sales over the same quarter in 2017, softer demand in
the second quarter resulted in a smaller increase in sales in that sector. A 25 percent drop in new wood
frame condominium and townhome sales in the first half of 2018 compared to 2017 can be partially
attributed to 18 percent fewer units in these two product sectors being released to the market. This
again reflects some softening in buyer urgency and demand, particularly in the second quarter of this
year.

                                                YTD UN IT SA L ES COMPARISON ‐ BY PRODUC T TYPE
                                                     6,962
                                             4,658

                                                             4,404
                                                             4,316
                                     4,171
                     4,034

                                                                                                                                   3,313
             3,396

                                                                                                                                                                                                   2,687
                             2,704

                                                                                                                               2,373
     2,250

                                                                                                                                                                                                2,090
                                                                                    2,050
                                                                                            2,038

                                                                                                                    2,032

                                                                                                                                                                                              1,715
                                                                                                                                                                                      1,779
                                                                                                                            1,649
                                                                                                            1,601

                                                                                                                                                                              1,529
                                                                                                                                                      1,514
                                                                                                                                                              1,260
                                                                            1,221

                                                                                                    1,179

                                                                                                                                                                      1,086
                                                                                                                                              1,070
                         CONCRETE                                                           WOOD FRAME                                                          TOWNHOMES

                                     2010                2011        2012             2013                  2014               2015        2016           2017                   2018
Chart 3
When the governing provincial Liberal party first introduced the Foreign Buyers Tax in summer 2016,
there was an immediate (albeit temporary) drop in sales activity across the market. This cooling was
reflected in a narrowing in the spread between the number of quarterly sales and the number of unsold
units at the end of the third quarter of 2016. Not surprising, a similar narrowing occurred in Q2‐2018;
the first quarter after the increase in the Foreign Buyers Tax and other regressive housing policy
measures introduced by the current ruling NDP party.

The spread in the number of new multi‐family homes sold in a quarter and the number of unsold units
at the end of that quarter narrowed by 93 percent in Q2‐2018. While the number of unsold units
increased by 20 percent from the end of the previous quarter, the 28 percent drop in sales from the Q1
to Q2 of 2018 contributed more to the narrowing of these two metrics. Should market conditions remain
flat, UA anticipates the number of unsold units at the end of the third quarter of 2018 to exceed the
number of unit sales during the quarter for the first time since late 2015.

Metro Vancouver UA Take – Q2‐2018                                                                                                                                       urbananalytics.ca
                                                                                                              4
QUARTERLY SALES VS UNSOLD INVENTORY TREND
10,000
8,000
6,000
4,000
‐141
2,000
0
Chart 4 Total Sales Released Inventory
Not surprising given the data illustrated in Chart 4, there were fewer new multi‐family homes sold during
the second quarter than were released to the market. However, the difference in these two metrics was
just three percent. In fact, the number of units sold during the quarter exceeded the number of units
released in eight of the 13 sub‐markets across the region. The higher number of sales relative to units
released can be attributed to an increase in the number of new units released in the Tri‐Cities and
Surrey/North Delta sub‐markets.
QUARTERLY UNIT SALES VS. UNITS RELEASED
592
600
435
413
411
503
345
332
320
295
274
239
237
231
221
226
189
195
185
145
103
58
50
22
7
0
Chart 5 Units Sold Units Released
Metro Vancouver UA Take – Q2‐2018 urbananalytics.ca
5While the unsold inventory of new multi‐family homes has increased by 43 percent over the past year,
the 3,113 units available to purchase remains well below the levels seen from 2010 to 2015. Much of the
increase in supply occurred in the concrete condominium sector, which is generally the least affordable
product in the market. Representatives of luxury concrete condominium product seeking higher sale
values noted much softer buyer demand than in previous quarters, which resulted in slower absorptions
and the need for incentive offerings for prospective buyers and substantial bonuses for realtors. The
year‐over‐year rise in unsold inventory in the wood frame condominium and townhome sectors was
marginal at seven and eight percent respectively.
R E L EA S E D IN V E N TORY CO M PAR I S O N
5,712
5,483
4,363
3,998
3,977
3,233
3,212
2,823
2,521
2,370
2,012
1,893
1,756
1,233
1,180
1,163
1,153
1,111
1,032
768
720
676
624
517
425
399
398
CONCRETE WOOD FRAME TOWNHOMES
Q2‐2010 Q2‐2011 Q2‐2012 Q2‐2013 Q2‐2014 Q2‐2015 Q2‐2016 Q2‐2017 Q2‐2018
Chart 6
New project launches in Richmond, the North Shore and Surrey/North Delta contributed to these sub‐
markets attaining the highest biggest increases in unsold inventory in Q2‐2018 compared to the previous
quarter.
Q UA RT E R LY R E L EA S E D IN V E N TORY CO M PAR I S O N
700
600
500
NUMBER OF UNITS
400
300
200
100
0
Chart 7 Q1‐2018 Q2‐2018
Metro Vancouver UA Take – Q2‐2018 urbananalytics.ca
6Another sign of shifting market conditions is the fact there were more than 100 completed and unsold
units at the end of the Q2‐2018 for the first time in two years.
S TA N D I N G I N V E N TO R Y T R E N D
2,500
1,922
Completed and Unsold Inventory
1,726
1,708
2,000
1,282
1,500
997
798
1,000
534
255
500
122
116
90
89
83
62
61
50
31
0
Chart 8
While the recent completion of a projects in a number of sub‐markets during the second quarter
contributed to the 30 percent increase in the number of move‐in ready units, the reality is most new
multi‐family home projects are being completed with just a few unsold units, and most of these units
are the larger, higher priced homes in each respective project. It’s also worth noting that the amount of
standing inventory currently in the market represents just four percent of all unsold inventory.
S TA N D I N G I N V E N TO R Y BY S U B ‐ M A R K E T
40
34
COMLPLETED AND UNSOLD UNITS
35
30
25
20 17 16 15
15 13
10
10
5 4
5
1 0 0 0 1
0
Chart 9
A 62 percent drop in the number of new concrete condominium units released to the market in the
second quarter of 2018 compared to the first quarter resulted in a drop in the amount of unsold
Metro Vancouver UA Take – Q2‐2018 urbananalytics.ca
7inventory in the pre‐construction phase. Moderate increases in the amount of unsold inventory at the
‘under construction’ phase of marketing is not at all concerning given much of this product remains
several months from completion. It’s also worth noting that of the 10,467 condominium and townhome
units scheduled to complete in the second half of 2018, just 474 units (5 percent) were unsold at the end
of the second quarter.
I N V E N TO RY BY P ROD U C T T Y P E & CON ST R U C T I O N STAT U S
1,469
615
310
288
280
151
52
48
16
CONCRETE CONDOS WOOD FRAME CONDOS TOWNHOMES
Standing Under Construction Pre‐Construction
Chart 10
Chart 11 provides further evidence to support the suggestion we are unlikely to experience and
significant over‐supply of new multi‐family product in the market for the foreseeable future. Of the
34,805 concrete condominium units scheduled to complete between now and the fourth quarter of
2022, just seven percent remain unsold.
CON C R E T E CO N D O M I N I U M S COM PL E T I O N & U N S O L D I N V E N TO RY
A N A LYS I S FO R M E T RO VA N COU V E R
Q3‐2018 TO Q4‐2022
47
412
412
360
23
4,384
50
34
33
13
378
142
15
3,184
3,184
2,874
2,735
2,050
2,044
68
90
1,882
1,859
1,659
1,482
1,348
179 214
539 5
425 0
878
810
# of Sold Units # of Unsold Units
Chart 11 Source: UAI
Metro Vancouver UA Take – Q2‐2018 urbananalytics.ca
8Price Trends
The Q1‐2018 UA Take noted indications of growing price resistance in certain sectors of the market;
primarily luxury‐oriented projects in higher valued locations such as Vancouver West, North and West
Vancouver and White Rock. This price sensitivity spread to more sectors of the market in the second
quarter of year, particularly those targeting end‐user buyers most impacted by the higher borrowing
costs caused by the Stress Test rules and higher mortgage rates. Lower values in the detached home
resale market have also continued to affect absorptions and achievable values in the higher valued
downsizer‐oriented sector of the market. The growing uncertainty these buyers feel about the
achievable value of their current home is making some reluctant to commit to a presale purchase, which
in turn has slowed absorptions at some projects, particularly those seeking above market‐average
absorptions.
Some developers who recognized the shifting market conditions and adjusted their revenue
expectations accordingly for projects launching in the second quarter continued to achieve strong
absorptions. These developers realized they would not meet their absorption targets if they positioned
projects assuming the recent trend of achieving higher average sale values than was attained by
previously marketed projects. Some developers positioned their projects such that the overall average
sale value was lower than previously launched developments in the same area. These projects have
managed to achieve strong absorption rates while developments positioned assuming prices were
continuing to rise have reported much slower absorptions. Developers of these latter projects are
subsequently offering generous buyer incentives and realtor bonuses to generate buyer interest and
higher sales activity.
Despite the sales success at various projects throughout the region, there is a growing sense of caution
among development industry stakeholders that market conditions are likely to remain flat through the
balance of 2018 and potentially beyond. The appropriate positioning of launching projects will be
increasingly important for developers to meet their absorption targets.
The following provides a summary of average sale values being sought for various product forms in the
more active Metro Vancouver sub‐markets and neighbourhoods:
Vancouver West – New concrete condominium product along the Cambie Corridor continues to
seek average sale values of $1,500 while projects in the Dunbar and Kerrisdale neighbourhoods
are seeking average sale values in the $1,600 to $1700 per square foot range.
Richmond – Concrete condominium product positioned between $1,000 and $1,100 per square
foot are achieving the highest absorptions. There is strong demand for recently launched wood
frame condominium product seeking average sale values between $800 and $850 per square
foot.
Burnaby – Good sales activity at recently launched concrete condominium projects seeking
between $1,000 and $1,100 per square foot in the Brentwood neighbourhood.
Metro Vancouver UA Take – Q2‐2018 urbananalytics.ca
9 North Shore – Recently launched concrete condominium product priced between $1,200 and
$1,300 per square foot is experiencing reasonable absorptions. Recently launched townhome
projects are seeking average sale values below $900 per square foot after seeing the slow
absorptions at projects seeking closer to $1,000 per square foot. New wood frame condominium
product launching in Q3‐2018 is expected to seek between $850 and $900 per square foot.
Tri‐Cities – Recently launched wood frame condominium product in Port Moody seeking average
sale values in the $750 per square foot range has achieved strong absorptions. There was strong
demand for townhome product in Burke Mountain seeking average sale values of $500 to $550
per square foot.
Fraser Valley – Demand has softened somewhat for concrete condominium product in Surrey
City Centre seeking average sale values above $800 per square foot. The concrete condominium
sector of the South Surrey/White Rock market remains soft for product seeking above $950 per
square foot.
o Recently launched wood frame condominium projects achieving strong sales activity are
seeking the following average sale values:
Surrey/North Delta ‐ $630 to $650 per square foot
South Surrey/White Rock ‐ $600 per square foot
Langley/Cloverdale ‐ $590 to $610 per square foot
o The better selling new townhome projects launched in Fraser Valley sub‐markets in Q2‐
2018 are seeking the following average values:
Surrey/North Delta – $390 to $440 per square foot
South Surrey/White Rock – $400 to 440 per square foot
Langley/Cloverdale – $425 to $475 per square foot
Abbotsford – Wood frame condominium projects seeking average sale values between $475 to
$525 per square foot have experienced strong demand. Successful townhome projects are
achieving average sale values of $370 to $400 per square foot.
Buyer Trends
There was little change in the profile of active buyers in Metro Vancouver’s new multi‐family home
market. However, project representatives throughout the market reported some changes in the
behaviour and expectations of some buyer groups. Downsizing buyers are far more cautious about their
presale purchase given the uncertain conditions in the detached home resale market. Younger end user
buyers are slowly adjusting to the new reality of their purchasing power after the implementation of the
new stress test rules and higher mortgage rates.
An interesting trend noted for end user buyers is what some project representatives described as a flight
to quality and brand. Prospective end user purchasers are more frequently inquiring about a developer’s
history of completion and execution of previous developments. UA anticipates this trend will continue
Metro Vancouver UA Take – Q2‐2018 urbananalytics.ca
10as competition increases and less experienced developers encounter issues with timely completion of
and satisfactory execution of projects.
Investor purchasers are also reportedly more cautious about the price of the product they’re purchasing;
they’re more carefully considering how the product is positioned given the changing market conditions
and are more reluctant to purchase product they don’t feel offers appropriate value relative to
competing product in locations with comparable amenities. Investor purchasers’ flight to value has been
most apparent in the Fraser Valley where some developers report a high proportion of the buyer mix is
comprised of investors seeking product priced to allow for positive cash flow if they decide to hold the
unit for rental purposes.
As was the case when the initial 15 percent Foreign Buyers Tax was introduced in 2016, demand from
off‐shore buyers softened in Q2‐2018 after the tax was increased to 20 percent by the current NDP
government. As noted in the Q1‐2018 UA Take, the increase in the tax and the resulting softer demand
from off‐shore buyers will have minimal impact on the market as a whole given this buyer group
generally comprises less than 10 percent of the overall buyer mix.
Looking Ahead
The second quarter of 2018 was extremely busy for developers and municipal planning departments.
There was additional urgency to have projects approved ahead of this fall’s municipal elections. While
UA does not anticipate any significant increase in the number of new project launches during the first
two months of Q2‐2018, there will likely be an increase in the number of projects launched during the
final four months of the year. This increased competition combined with the lower urgency among some
buyer groups will make it increasingly important for developers to carefully position their projects to
match market conditions. Some of the more noteworthy projects UA expects to launch over the next
two quarters and will be monitoring closely include:
Fifteen Fifteen – Downtown Vancouver
The Harwood – Downtown Vancouver
Cambie Gardens – Vancouver West
Chelsea – Vancouver West
Duet – Vancouver West
The Granville Residences – Vancouver West
Winston – Vancouver West
Atmosphere – Richmond
The Paramount ‐ Richmond
Berkeley House ‐ Richmond
Peregrine – South Delta
Beaufort Landing – South Delta
Gilmore Place – Burnaby The Granville Residences – Aoyuan Int’l
City of Lougheed (Tower 3) – Burnaby
Metro Vancouver UA Take – Q2‐2018 urbananalytics.ca
11 Forte ‐ Burnaby
Arcola – Burnaby
Ovation – New Westminster
Amira – New Westminster
Park West – North Vancouver
Marine + Fell – North Vancouver
Toppen Ridge – North Vancouver
The Sentinal – West Vancouver
Redbridge – Squamish
Aalto ‐ Coquitlam
Creekside – Ridge‐Meadows
University District – Surrey
Centra – Surrey
Soleil – South Surrey/White Rock
Union Park – Langley/Cloverdale
Yorkson Park – Langley Cloverdale
Clayton Street – Langley Cloverdale
Xander – Langley/Cloverdale
Court – Abbotsford
As always, UA looks forward to monitoring the sales progress of these and all other actively selling new
home projects and updating the data as it is collected on nhslive.ca.
UA maintains the most current database of actively selling and contemplated new multi‐family home
projects in Metro Vancouver, Calgary and Edmonton on NHSLive.ca. UA analysts are constantly
updating the data for the most active projects to ensure our subscribers are as current as possible. In
addition to the Multi‐Family Home platform on NHSLive.ca, UA also offers subscription access to new
purpose built rental data and land transaction data on NHSLive. Please call for a demonstration of both
these products and to inquire about our advisory services to help you appropriately design and
position your next project.
URBAN ANALYTICS INC.
(604) 569‐3535
info@urbananalytics.ca
nhsrental@urbananalytics.ca
nhsland@urbananalytics.ca
Metro Vancouver UA Take – Q2‐2018 urbananalytics.ca
12You can also read


