BRISBANE APARTMENT MARKET REVIEW - February 2019 - Ferrier Hodgson
←
→
Page content transcription
If your browser does not render page correctly, please read the page content below
BRISBANE
          APARTMENT
          MARKET
          REVIEW

          February 2019

                                   ferrierhodgson.com.au
Brisbane Apartment Market Review
                                          azurium.com.au
Brisbane Apartment Market Review 2

CONTENTS

                                   Section                              Page

                                    Introduction                         4

                                    Methodology                          4

                                    Summary                              5

                                    Supply                               6

                                    Project funding                      8

                                    Demand                               10

                                    Increasing unsold developer stock    11

                                    Other trends                         13

                                    Managing settlement risk             13

                                    Expectations for the future          14

                                    Snapshot of the market               14

                                    Our Queensland property team         15

Brisbane Apartment Market Review                                               3
Introduction
In this review, we provide the latest insights on the Brisbane Apartment Market, based on our ongoing research of
the market over the past two years.
This research emanates from our database of 162 projects of greater than 25 apartments in size, and in turn 19,230
apartments, which are currently under construction or recently completed.

Methodology
In preparing this publication we have collated information from a variety of sources including Core Logic RP Data,
Cordells, Queensland Titles Office, developer websites and kerbside inspections.
The data is for residential apartment projects completed during 2017 or under construction at 31 December 2017
with 25 or greater apartments situated in identified localities within 12 kilometres of the Brisbane CBD as shown in
the map below. It does not take into consideration development approvals and projects awaiting commencement of
construction.
Data has been collated over a period of time and therefore settlements in a number of projects may have
subsequently completed or be currently underway.

Inner East                                                       Outer North
Balmoral, Bulimba, Cannon Hill, Coorparoo, East Brisbane,        Alderley, Ascot, Aspley, Chermside, Clayfield, Enoggera,
Kangaroo Point and Stones Corner.                                Everton Hills, Everton Park, Gaythorne, Grange, Hendra,
                                                                 Kedron, Lutwyche, McDowall, Mitchelton, Northgate, Nundah,
Inner North                                                      Wooloowin and Zillmere.
Albion, Bowen Hills, Fortitude Valley, Hamilton, Kelvin Grove,
New Farm, Newmarket, Newstead, Spring Hill, Teneriffe and        Outer South
Windsor.                                                         Annerley, Archerfield, Coopers Plains, Eight Mile Plains,
                                                                 Moorooka, Sherwood, Sunnybank, Yeerongpilly and Yeronga.
Inner West
Auchenflower, Bardon, Milton, Paddington, St Lucia and           Outer East
Toowong                                                          Carina, Carina Heights, Holland Park, Holland Park West,
                                                                 Morningside, Mount Gravatt, Mount Gravatt East, Murarrie,
Inner South                                                      Seven Hills and Upper Mount Gravatt.
Dutton Park, Greenslopes, Highgate Hill, Norman Park, South
Brisbane, West End and Woolloongabba.                            Outer West
                                                                 Ashgrove, Enoggera, Indooroopilly, Kenmore, Taringa and The
                                                                 Gap.
Brisbane Apartment Market Review                                                                                               4
Summary
The key findings from our database of 19,230 apartments within 162 projects that were under construction as at 31
December 2017, or were completed during 2017, are:
—       8,032 apartments completed in 2017 with a number of settlements pending, compared to our forecast of
        10,169 apartments to complete during 2017 in our report as at 31 December 2016. This decrease can be
        attributed to slower than expected construction progress across several projects.
—       11,198 apartments were under construction as at 31 December 2017, of which:
            •      7,750 are forecast to complete in 2018
            •      1,967 are forecast to complete in 2019
            •      1,481 are forecast to complete in 2020 and beyond.
—       The market is awash with incentives for purchasers ranging from deferred settlement periods to price
        reductions and other arrangements including vendor finance, payment of stamp duty, furniture packages and
        rent guarantees.
—       An increasing reliance on other financing arrangements with only 38% of financing coming from the big 4
        banks. This contrasts to Sydney where our research shows 67% of all apartment projects are financed by the
        big 4 banks.
—       There is a considerable number of projects with no mortgagee, further demonstrating that developers are
        pursuing alternative methods to fund their projects as the major banks have pulled back, due to highly
        publicised supply concerns.

  Number of apartments under construction – 12 month comparison by mortgagee

  7,000

                   6,008
  6,000

  5,000                                                                       4,825
                                                                                        4,748

                               4,192     4,250
                                                                                                3,994
  4,000

  3,000
                                                                                                                        2,485

                                                                                                        2,080
  2,000
                                                                                                                1,402

  1,000                                                   701
                                                  567
                                                                   469

       -0
                           Big 4 banks           Other Australian banks       Other banks and private      No mortgagee
                                                                                      lenders

                                                    31-Dec-16     30-Jun-17      31-Dec-17

Brisbane Apartment Market Review                                                                                                5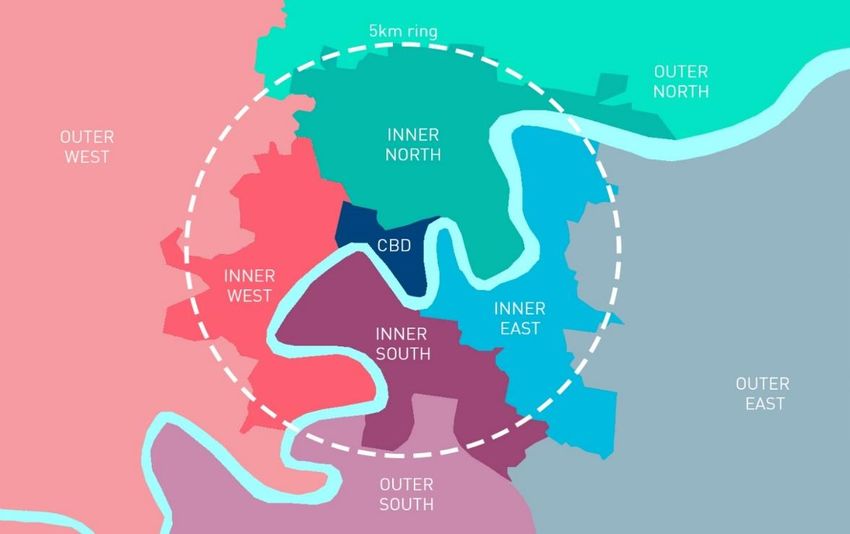
Supply
Building approvals for non-house residential construction in Brisbane decreased for the second year running during
2017, after the substantial increase between 2013 and 2015.

Brisbane building approvals, dwellings excluding houses

  25,000

                                                                                                                                      20,300
  20,000

                                                                                                                                               16,437

  15,000

                                                                                                                             12,208

                                                                                                                    10,546                              10,725

  10,000

                                                                                            7,413   7,290
                            6,755           6,557   6,625
                                    6,196                           6,391
                                                                                                            6,035
                                                                            5,413
                                                            4,806                   4,659
    5,000

                  2,140

         -0
                 2001 2002 2003 2004 2005 2006 2007 2008 2009 2010 2011 2012 2013 2014 2015 2016 2017
  Source: ABS

Building approvals peaked in 2015 following the introduction of Brisbane City Plan 2014 which allowed higher
density development in areas close to the Brisbane CBD and public transport hubs coupled with increased risk
appetite from developers and investors in a low interest rate environment.
However, as shown above, 2016 and 2017 have demonstrated a steady decrease in approvals. Factors working to
constrain future supply, include:
—       Oversupply concerns, as evidenced by the level of recent completions with residual unsettled (developer
        owned) stock
—       Increased construction costs
—       Expectations for price discounts, following increased provision of marketing incentives.
Based upon available 2018 data we project that building approvals will plateau in the short to medium term.
However, given the significant lag time between approvals and apartment completion there remains some time to
go before the Brisbane apartment market returns to sustainable levels.

Brisbane Apartment Market Review                                                                                                                                 6
The most recent RLB Crane Index reflects the decrease in activity with the number of cranes used in apartment
construction in Brisbane decreasing from 91 (Q2 2016) to 43 (Q2 2018).

Number of cranes used in residential sector

 300

 250

 200

 150

 100

   50

     0
               Q3 2014                Q2 2015         Q2 2016       Q3 2016             Q2 2017         Q4 2017        Q2 2018

                                           Brisbane        Sydney           Melbourne             Gold Coast
  Source: RLB

While there has been a slow down in approvals, there are still 11,198 apartments within 12km of the Brisbane CBD
currently under construction due for completion between 2018 to 2020.

Forecast completion dates

9,000
                                   7,750
8,000

7,000

6,000

5,000

4,000

3,000
                                                                    1,967
2,000                                                                                                      1,481

1,000

     -0
                                   2018                             2019                             2020 and beyond

Source: Cordell Connect, Azurium Real Estate

A total of 8,032 apartments were completed during 2017 which compares to our estimate of 10,169 made at the
beginning of the year. This decrease is largely the result of slower than expected construction progress on a
number of projects.

Brisbane Apartment Market Review                                                                                                 7
Project funding

From our research across the Brisbane, Gold Coast and Sydney apartment markets, we have identified the
following bank and other financier exposures.

Percentage of apartments under construction – as at 31 December 2017 by mortgagee

  Mortgagee                            Brisbane                      Sydney                    Gold Coast

  Big 4 bank                             38%                           67%                         28%

  Non-Big 4 bank                         40%                           22%                         41%

  No mortgagee                           22%                           11%                         31%

Source: Azurium

There is an increasing reliance on other financing arrangements with only 38% of financing coming from the Big 4
banks in Brisbane. This contrasts to Sydney where our research indicates 67% of all major projects (over 50
apartments) are financed by the Big 4 banks.
There is also a considerable number of projects with no mortgagee, further demonstrating developers are pursuing
alternative methods to fund their projects as the major banks have pulled back, due to highly publicised supply
concerns.

Financier exposure by locality

The charts opposite show the percentage of all apartments under construction by locality.
Our research confirms that the Inner South is the current hotspot for development with the suburbs of West End
(742 apartments), South Brisbane (1,821 apartments) and Woolloongabba (991 apartments) seeing considerable
new development.
As forecast in our report as at 31 December 2016, the number of apartments under construction in the Inner North
has decreased from 32% (4,264 as at 31 December 2016) to 26% (2,926 as at 31 December 2017). This is in part
due to the completion of high profile developments, FV – Valley House and Flatiron (combined 594 apartments),
Newstead Central – St Tropez and Laguna (combined 420 apartments) and The Yards development (combined
390 apartments). The Big 4 banks in particular have been highly active in the Inner North with 43% of the Big 4
banks’ exposure in the Inner North.
Contrastingly, whilst the number of apartments under construction in the Inner South has decreased from 4,215 (as
at 31 December 2016) to 3,879 (as at 31 December 2017), this locality represents the highest percentage of stock
under construction (35% as at 31 December 2017).

Brisbane Apartment Market Review                                                                                    8
2% 14%
3%
3%
CBD Outer North
4%
26% Inner North Outer South
5% Inner South Outer East
All projects Inner East Outer West
11,198 apartments
8% Inner West
35%
1%
1%
5% 43%
18%
No mortgagee 6% Big 4 banks
2,485 apartments 4,250 apartments
46% 7%
29%
29%
10%
5%
21% 28%
3%
22% 7% 14%
26%
Other Australian
Other financiers
banks 3,994 apartments
469 apartments 7%
13%
17% 27%
14%
Brisbane Apartment Market Review 9Demand
The graph below shows the volume of apartments sold from December 2011 to March 2018, together with the
weighted average price of apartment sales within Inner Brisbane (0-6km).
Inner Brisbane apartment sales
Sale Price $ Sales (#)
750,000 2,000
700,000 1,600
650,000 1,200
600,000 800
550,000 400
500,000 0 -0
Sep-15
Dec-11
Jun-12
Sep-12
Dec-12
Jun-13
Sep-13
Dec-13
Jun-14
Sep-14
Dec-14
Jun-15
Dec-15
Jun-16
Sep-16
Dec-16
Jun-17
Sep-17
Dec-17
Jun-18
Mar-12
Mar-13
Mar-14
Mar-15
Mar-16
Mar-17
Mar-18
Weighted average sale price Number of Sales
Source: Place Projects
The weighted average sales price has fallen during the year whilst sales volumes have remained at record lows.
Owner occupier demand has continued relative to investor demand over the past year, noting the peak volume of
sale contracts in late 2014 and early 2015, was driven primarily by interstate and foreign investors.
Many of these investors were sourced by investment marketeers who typically charge commissions of 5% to 8%
per apartment.
The total cost to some of those developers is up to 14%, once seminar costs are paid and investors are offered
various monetary / promotional incentives,
These rental incentives include free Wi-Fi, rent free periods and furniture packages amongst others.
Brisbane does however remain an attractive investment option due to its comparative affordability relative to both
Sydney and Melbourne.
Brisbane Apartment Market Review 10Increasing unsold developer stock
There has been increasing concern with regard to Unsettled apartments as at 31 December 2017 as a
settlement risk over the past year. percentage of total apartments completed
In order to gain a deeper understanding of this risk for 40%
developers and financiers we investigated the number of
apartments within completed projects that were yet to
settle as at 31 December 2017.
To do this we undertook searches to identify which 35% 34%
apartments in projects completed during 2017 were still
recorded in the name of the developer as at 31
December 2017. We acknowledge that some of the
30%
apartments may be contracted with settlements yet to
occur.
26%
Our findings show that settlements are taking longer to
finalise with 19% of apartments completed in the first 25%
half of 2017, 34% of apartments from the second half of
2017 and 26% of all apartments completed during the
year remaining unsettled as at 31 December 2017.
20% 19%
These settlement delays, at a time of peak debt for the
developer, add substantial interest costs, diminishing the
return to mezzanine providers and eroding the
developer’s equity position. We are also aware of 15%
developers being charged roll over fees where their
facility was not paid back on time.
Our research demonstrates that some localities have a 10%
higher number of unsettled apartments. In particular, the
following suburbs have the highest number of unsettled
apartments as at 31 December 2017:
5%
— South Brisbane (410 apartments)
— West End (280 apartments)
— Chermside (181 apartments) 0%
— Albion (141 apartments) 1st half 2017 2nd half 2017 All of 2017
— Bowen Hills (121 apartments)
Number of apartments completed vs number of apartments unsettled in 2017 by locality
2,926
3,000
2,695
2,500
2,000
1,500
937
1,000 800
583
487 481
500 288
197 150
120 85 54 109 50
45 44 5
0
CBD Inner North Inner South Inner East Inner West Outer North Outer South Outer East Outer West
Number of apartments completed in 2017 Number of apartments completed in 2017 that are unsettled
Brisbane Apartment Market Review 11Despite fewer apartments being completed in the Inner South than the Inner North during 2017, the Inner South
had a higher number of unsettled apartments as at 31 December 2017.
Further, while the number of apartments completed in the Outer North in 2017 was approximately a third of the
number of apartments completed in the Inner North, the number of apartments unsettled in the Outer North was
half of the number of apartments unsettled in the Inner North.
Unsettled apartments as a percentage of total apartments completed in each locality as at 31
December 2017
45%
40%
40%
35%
31% 30%
30%
30% 27%
25%
25%
20%
20% 18%
15%
10%
10%
5%
0%
CBD Inner North Inner South Inner East Inner West Outer North Outer South Outer East Outer West
Settlement risk is certainly not confined to the Inner North, Inner South and Outer North. As the following graph
shows, there were projects with greater than 25% of unsettled apartments in all localities.
Number of projects completed in 2017 vs number of projects completed in 2017 with greater than 25%
of apartments unsettled as at 31 December 2017 by locality
25
25
20
20 19
15
11 11
10 8
6
5 4
3 3 3
2 2 2
1 1
0
CBD Inner North Inner South Inner East Inner West Outer North Outer South Outer East
Number of projects Number of projects with greater than 25% unsettled apartments
Although the Inner South had the highest number of apartments yet to settle as at 31 December 2017, the number
of projects with greater than 25% of apartments unsettled was relatively low at 44% of all projects completed in the
Inner South.
As demonstrated above, the outer localities had a higher proportion of projects with greater than 25% of apartments
unsettled as at 31 December 2017.
Brisbane Apartment Market Review 12Unsettled apartments as at 31 December 2017 as a percentage of total apartments for projects completed in
2017 by development size
The following graph demonstrates an inverse relationship between a project’s size and settlement risk. That is, as a
project’s size increases the percentage of apartments within the project that are unsettled decreases. While not
within the scope of this report, we see this relationship extending to projects of less than 25 apartments.
40%
31%
30%
25%
21%
20%
10%
0%
Large (>100 apartments) Medium (50-99 apartments) Small (25-49 apartments)
While high profile developments in inner city areas such as Newstead and South Brisbane may attract the majority
of attention, we retain our concerns for smaller projects located in the middle to outer ring suburbs.
It is here that the headwinds facing the apartment market will be felt most strongly as buyers become more
discerning due to increased supply.
Other trends
Other noticeable trends include:
— Foreign (particularly Chinese) purchasers who are unable to obtain finance from Australian lenders rescinding
contracts, with new contracts being entered into by local residents, usually family members.
— Early discounting of some projects to clear residual stock.
— Pre-sales on yet-to-commence projects are not meeting expectations resulting in project deferrals
— The quantity of new stock resulting in significant losses upon resale on recently purchased off-the plan prices
of up to 30%.
Managing settlement risk
To manage settlement risk, it is critical to comprehend:
— Current market conditions and how buyers may be positioned
— The supply and demand for similar competing products
— The advantages and disadvantages of given product compared to the competition including other new stock
and older stock
— Legal disputes such as the enforceability of pre-sale contracts relating to:
• Building specification differences to marketing plans
• Any looming sunset dates
• Body corporate disclosure statement variances
— Level of deposit
— Buyer origin, being either local, interstate or foreign
— Nature of purchasing entity
Brisbane Apartment Market Review 13Expectations for the future The pressure on owners of older stock will continue to intensify as the choice for buyers and renters, who hold the higher ground in rental property negotiations, increases. Anecdotally, owners are preferring to hold on to properties for a longer time period, rather than crystallise losses. The longer this downward trend in apartment values continues, the greater the likelihood that off the plan purchasers simply elect to walk away. If this eventuates, it will not only be the equity and mezzanine funders who will incur losses, but senior lenders may also be at risk, depending on their exposure. Those developers with an effective and streamlined approach to managing settlements are faring better than those developers who do not have an appropriate strategy in place to work with purchasers. With all the headwinds facing the residential apartment sector in Brisbane, we anticipate sales prices for new apartments will decline following decreases in sales volumes for off-the-plan apartments, with settlement risk being a significant concern. While both inner city and middle ring suburban areas have large numbers of projects completing throughout 2018, we retain confidence in high quality projects. Specifically, we consider the defining factors of successful projects to include: — Location — Building quality and visual appeal — Number of apartments — Size — Layout — Extent of allocated and unallocated parking — Views — Amenity — Price point — Purchase price compared to valuation The flight to quality will pick up speed as buyers and renters begin leveraging their negotiating positions. This phenomenon will be felt the most in the middle ring suburban areas such as Albion, Nundah, Cannon Hill and Chermside. Financiers exposed to the larger residential projects in this sector need to be prepared to work closely with developers to mitigate the risk of loss. Snapshot of the market From our research, we have formed the opinion that sale prices have fallen, the volume of sales has decreased, greater measures are being offered to motivate agents and buyers to act, and settlement periods are lengthening. Brisbane Apartment Market Review 14
Our Queensland                                              In Queensland we have a team of experienced real estate
real estate team                                            professionals with extensive experience in the residential
                                                            apartment sector. We can provide a detailed private briefing on
                                                            the market, and where appropriate, advise developers and
                                                            financiers on updated options analysis of any exit, hold or develop
                                                            out strategies, project completion, mitigating settlement risk and
                                                            project marketing.

                                                            To find out more, or for further information as to how we can
                                                            assist, please contact one of our real estate team today.

                          Will Colwell                                                                    Brett McAuliffe
                          Queensland Practice Head                                                        Executive Director
                          Ferrier Hodgson                                                                 Azurium Real Estate

                          +61 7 3834 9205                                                                 +61 7 3834 9233
                          will.colwell@fh.com.au                                                          brett.mcauliffe@azurium.com.au

                          Tim Michael                                                                     Peter Gumbley
                          Partner                                                                         Director – Sales & Project Marketing
                          Ferrier Hodgson                                                                 Azurium Real Estate

                          +61 7 3834 9228                                                                 +61 7 3834 9222
                          tim.michael@fh.com.au                                                           peter.gumbley@azurium.com.au

                          Sallyanne Pitt                                                                  Cameron Mana
                          Director                                                                        Director – Development
                          Ferrier Hodgson                                                                 Azurium Real Estate

                          +61 7 3834 9214                                                                 +61 7 3834 9222
                          sallyanne.pitt@fh.com.au                                                        cameron.mana@azurium.com.au

                          Campbell Munro                                                                  Andrew Willsford
                          Property Senior Analyst                                                         Valuation Specialist
                          Ferrier Hodgson                                                                 Azurium Real Estate

                          +61 7 3834 9235                                                                 +61 7 3834 9222
                          campbell.munro@fh.com.au                                                        andrew.willsford@azurium.com.au

                          Jackson Adcock                                                                   Andrew Keeble
                          Property Analyst                                                                 Retail Leasing Specialist
                          Ferrier Hodgson                                                                  Azurium Real Estate

                          +61 7 3834 9247                                                                  +61 7 3834 9222
                          jackson.adcock@fh.com.au                                                         andrew.keeble@azurium.com.au

  Disclaimer:
  This publication is produced by Ferrier Hodgson and Azurium Real Estate. It is intended to provide general information in summary form on real estate
  topics, current at the time of publication. The contents do not constitute advice and should not be relied upon as such. Formal advice should be sought in
  particular matters.

  This publication is subject to copyright. No part of it may be reproduced, adapted or transmitted without the written permission of the copyright owner.

  Brisbane Apartment Market Review                                                                                                                             15
Level 7, 145 Eagle Street
Brisbane, QLD 4000
Brisbane Apartment Market Review T +61 7 3831 14833
February 2019 16You can also read