A grey-forecasting based multiple linear regression model for planning nursing homes
←
→
Page content transcription
If your browser does not render page correctly, please read the page content below
E3S Web of Conferences 283, 02038 (2021) https://doi.org/10.1051/e3sconf/202128302038
ICCAUE 2021

 A grey-forecasting based multiple linear regression model for
 planning nursing homes
 Tianyi Xu1, *, Sheng Li1
 1School of Transportation Engineering, Nanjing Tech University, Nanjing, Jiangsu, China

 Abstract. With the increasing demand for elderly care institutions in society, the issue of elderly care has
 become a serious social problem and a widely publicised livelihood issue. In order to actively respond to the
 trend of a deeply ageing population, the infrastructure of urban elderly care services is being strengthened.
 Led by relevant government departments, many scholars are exploring a model suitable for the development
 of elderly care in China, taking into account the experience of elderly care services at home and abroad. This
 paper proposes a universal planning model for elderly institutions based on multivariate integer linearity,
 introducing the zoning method and grey forecasting. It solves the problem of deciding the number of elderly
 institutions to be built in each district of a particular city in the government's future planning. Using Nanjing
 as an example, the model is then substituted with data from the Nanjing Rating Standards for Nursing Homes
 (for Trial Implementation) to obtain a table of construction plans for various types of nursing homes in five
 major stages during the period 2021-2035 and a map of the recommended distribution of nursing homes. The
 model simplifies complex calculations by transforming multivariate non-linear problems into linear ones. The
 simulation results have been proved to be practical and universal. The research results of the thesis can provide
 a theoretical basis and decision-making reference for the construction projects of elderly institutions and other
 functional infrastructures where the population gathers, which is conducive to the promotion of urbanisation
 and pulling economic growth, and provides material guarantee for the improvement of people's living
 standards..

 1 Introduction Against this background, it is of great practical
 significance to study the current situation of the utilization
 Under the background of the aging of the population, the of elderly care institutions and the factors influencing
 social structure and patterns of China's society have them. It will help the government grasp the current
 undergone a major transformation, and China has become situation of social elderly care services and improve the
 one of the fastest aging countries in the world. At the same shortcomings of the existing service system.
 time, demographically, the parents of the first generation
 of only children have entered old age and will
 successively enter a stage where they need support and 2 Planning model for nursing homes
 care. Therefore, it is a national concern to find a solution
 for planning access to elderly care institutions in line with 2.1. Model for population forecast
 the national context and the people's situation. In line with
 the policy, in recent years, scholars in China have been The number of elderly people is discrete data, which is
 conducting more comprehensive studies on the planning relatively deterministic and difficult to predict and
 of elderly care institutions. Previously, scholars have requires a dynamic model in differential equations.
 combined the current situation of planning and design of The method of predicting this model can be the grey
 county-level regional centers for the elderly, carried out forecasting method. Grey forecasting is a method of
 rationalization analysis, and put forward the key points of predicting systems with uncertainty by identifying the
 architectural design for county-level regional centers for degree of dissimilarity between the trends of aging
 the elderly. The relevant literature covers three major population growth factors, i.e., correlation analysis, and
 levels: macro, meso, and micro [1]. However, due to the generating raw population data to find the pattern of
 diversity of regional characteristics, most scholars' system changes. It can generate data series with strong
 research results are only specific to particular counties and regularity, and then build the corresponding differential
 cities and are not universally applicable. Moreover, most equation model, to predict the future development trend
 scholars do not have a systematic theoretical framework [2].
 to support them, and no scholars have yet summarized a The GM (1,1) model is the basic model of grey
 standardized model for planning elderly institutions. forecasting theory. It does not require a large sample size,

 * Corresponding author: Guanghua.ren@gecacademy.cn

© The Authors, published by EDP Sciences. This is an open access article distributed under the terms of the Creative Commons Attribution
License 4.0 (http://creativecommons.org/licenses/by/4.0/).
E3S Web of Conferences 283, 02038 (2021) https://doi.org/10.1051/e3sconf/202128302038
ICCAUE 2021

 and there is no requirement for the distribution of the A� A� A� A� A�
 sample to be regular or not [3]. In data processing, the B B� B� B� B�
 X* � � � � �, 、 、 、 ∈
 workload is relatively small, and the results of qualitative C� C� C� C� C�
 and quantitative analysis are usually close to each other. D� D� D� D� D�
 It is mostly used for medium and long-term forecasting ∗ (3)
 and has a wide range of applications.
 � �
 � ��� � � 1� � � ��� �1� � �� ��� � � � � ��1� � � � � 1� �
 2.2.3 Constraint analysis
 (1)

 � ��� � � 1� � � ��� � � 1� � � ��� � �� � 1��� � � �� ��� 2.2.3.1 Economic income
 (2)
 In the process of building elderly care institutions, a
 minimum number of institutions will be built, taking into
 Where x ̂^((1) )( ) denotes the new series after
 account the needs of elderly people with low, lower,
 accumulation, k denotes the ordinal number of the data
 middle, upper middle, and high disposable incomes, to
 and n denotes the number of data
 prevent the lack of a specific class of elderly care
 By analyzing this model, we can get the data of the
 institutions due to competition in the market economy and
 future elderly population in each district of a city and then
 to cater for the needs of various income groups [6]. The
 get the data of the density of the elderly population in each
 institutions will provide exclusive and customized
 district of a city by density = population/area.
 services for such elderly people for the AAAA and
 AAAA categories. According to the National Bureau of
 2.2 Model for planning nursing homes Statistics, 5% of society's population holds wealth well
 above the average, and they tend to demand customized
 2.2.1 Criterions services in their residences.

 �� ��� ��� ��� ��� ��� ��� ���
 ∑� � � � � ���� (4)
 2.2.1.1 Criterion 1: Integration. When considering the � �� �∑� �� �∑� �� �∑� ��
 number of institutions to be built, a "zoning decision is
 made, and the arrangement is coordinated". The process � � ��� � � � �1���������
 of building institutions in each of the major districts will
 be arranged in an integrated manner. � � ��� � � � �1���������

 � � ��� � � � �1���������
 2.2.1.2 Criterion 2: Scope. The number of institutions
 must be set within the area of the local area.
 � � ��� � � � �1���������

 2.2.1.3 Reasonableness. As far as possible, the needs
 2.2.3.2 Economic income
 of the elderly population in different areas and at different
 consumption levels should be taken into account [4]. The central urban area has been influenced by favorable
 policies and is developing faster with a higher per capita
 The main factors influencing the number of nursing
 disposable income. Considering the future development
 homes are economic income, social humanities, and
 plan of the main urban area, it is artificially stipulated that
 health care. With total cost as the dependent variable and
 there will be no low-grade elderly care institutions in this
 the number of nursing homes and falsification in each
 urban area. Considering the limited area of land available
 district as the independent variables, multiple linear
 in the urban areas, it is impossible to increase the number
 regression can be used to investigate the relationship
 of elderly institutions indefinitely [4]. For this reason, the
 between a dependent variable and multiple independent
 number of capped elderly institutions is set separately
 variables [5].
 according to the difference in population density and
 economic development level of each urban area.
 2.2.2 Matrix analysis of variable Except for the central city, the other sub-centers are at
 roughly the same level of economic development. To
 The analysis of the influencing parameters shows that this facilitate uniform planning in these sub-centers, we have
 development planning model is a multi-objective non- set the number of high-grade institutions in these areas to
 linear integer programming. For the sake of the text be roughly equal.
 convenience of the chapter narrative, the number of As an important part of a residential care home,
 proposed aged care institutions within zone one is denoted Catering facilities are essential for communication and
 as , zone two as , zone three as , and the fourth zone social interaction among the elderly.
 as , where the subscript denotes the rank of the ∑�� �� ��
 institution. The variable matrix is then. ∑� �� �∑� �� �∑�
 � � � � � (5)
 � �� �∑� ��

 Where � donates the size of catering facilities in level
 nursing homes, and � donates the standard area data

 2
E3S Web of Conferences 283, 02038 (2021) https://doi.org/10.1051/e3sconf/202128302038 ICCAUE 2021 required by policies. Meanwhile, = + + + , 2.2.4.2 Levels of fees for elderly care facilities = 1,2,3,4,5. The same applies to active recreational areas, for By fitting the levels of fees charged by each level of care, which we have kept the average communal area of each it can be concluded that the levels of fees charged by residential care facility above the minimum required by institutions approximately satisfy the following equation. the comfort standards and the needs of the actual situation. � � �� � � ���� � � (10) ∑� � �� �� ∑� � � � � �� (6) � �� �∑� �� �∑� �� �∑� �� where denotes the level of fees charged by the nursing facility at year , denotes the average annual fee growth Where E_i donates the size of recreational areas in rate, and 0 denotes the price charged in the initial year. level i nursing homes, and E_0 donates the standard area data required by policies. 2.2.5 Objective function 2.2.3.3 Health Care ∑�� � � The number of nurses varies between the different levels of care according to the hierarchy norms. For planning denotes the total number of institutions at level in a purposes, the number of medical staff: the number of city, = + + + , denotes the rate per bed for medical and nursing staff in the average area needs to different levels of institutions, = 1,2,3,4,5. exceed the required number for the corresponding level of urban development. 2.3 Solution Strategy ∑� � �� �� ∑� � � � � �� (7) � �� �∑� �� �∑� �� �∑� �� The model has many variables and complex parameters. Where N_i donates the number of medical and nursing To simplify the calculation process, the figures of the two staff in level i nursing homes, and N_0 donates the exponential functions of pensions and fees of elderly standard number required by policies. institutions are calculated. The forecast data last year is taken every three years of planning as the data used in this 2.2.3.4 Summary of Constraints planning [7]. In this way, multivariate integer non-linear planning can be transformed into multivariate integer ��� � � � ��� linear planning. For purely linear models, the standard ⎧�� ������ ��������������� solution method can be used. ⎪ ∑�� �� �∑�� �� �∑�� �� �∑�� �� � �� ⎪ ⎪ ∑�� �� �� � �� 3 Case study . ∑� �� �∑� �� �∑� � � � � �� �∑� �� ⎨ ∑�� �� �� ⎪ ∑�� �� �∑�� �� �∑�� �� �∑�� �� � �� 3.1 Division of city ⎪ ⎪ ∑�� �� �� ⎩ ∑�� �� �∑�� �� �∑�� �� �∑�� �� � �� In accordance with the principle of "zoning planning and co-ordination", Nanjing is used as an example for Where = + + + , = , , , , = 1,2,3,4,5 validating the planning model. As the division of Nanjing's urban areas is too detailed, 2.2.4 Analysis of growth in pensions, institutional fee and the areas are too trivial, to improve the efficiency of levels the study, it is proposed to combine the areas with similar economic development levels, population density, and geographical proximity, as shown in Table 1. 2.2.4.1 Pension increases TABLE I. The division of Nanjing Pension income is the income available to the elderly population for discretionary use. It is often used as a Original district New measure of the aging population of changes in their district 1 Qinhuai,Gulou,Jianye,Xuanwu,Yuhuatai No1. standard of living. In economics, it is often approximated Main by an exponential formula. district � � �� � � ���� � � (9) 2 Pukou, Luhe No2. Jiangbei where denotes the old-age population pension at year , district denotes the average annual pension growth rate, 0 3 Jiangning, Qixia No3. denotes the initial year pension, and Ydenotes the initial Jiangqi year. district 4 Lishui, Gaochun No4. Nancheng district 3
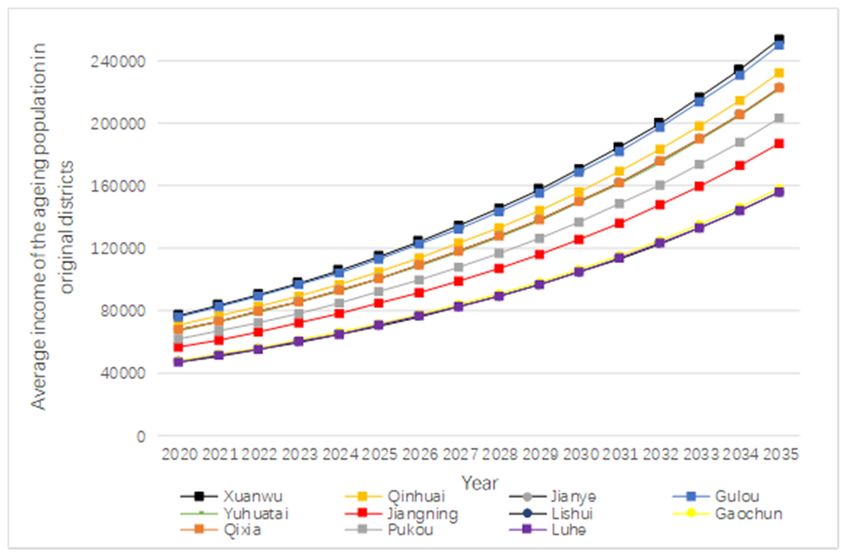
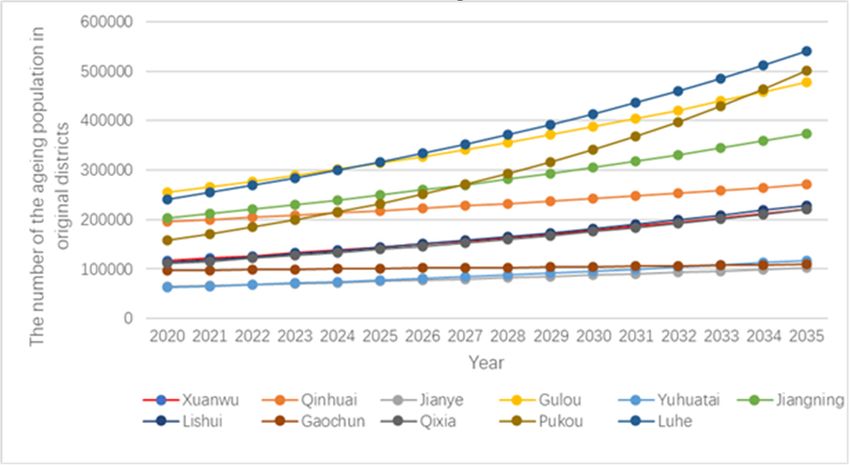
E3S Web of Conferences 283, 02038 (2021) https://doi.org/10.1051/e3sconf/202128302038
ICCAUE 2021

 3.2 Population forecast of Nanjing After consolidation and processing, the growth in the
 number of elderly people by region in Nanjing from 2020
 to 2035 can be obtained, as shown in Fig. 1 [8]. It can be
 3.2.1 Results of grey forecasting
 seen that the total number and proportion of the elderly
 population in Nanjing, Jiangsu Province is high and on an
 upward trend.

 Figure 1. Forecast of the number of the aging population in original districts of Nanjing from 2020 to 2035

 prediction accuracy grade excellent [9]. Therefore, the
 3.2.2 Posterior-Variance-Test prediction results of the model have a high degree of
 confidence, and the prediction of the aging population in
 Taking Gulou District as an example, the probability of
 Nanjing, Jiangsu Province, is effective.
 small error P>0.95 for most values of the aging population
 in Gulou District, Nanjing, between 2013 and 2020. The
 posterior difference ratios C are all less than 0.45. That 3.2.3 Results of the planning model
 makes the model establishment more scientific and the

 Figure2. The average income of the aging population in original districts

 4
E3S Web of Conferences 283, 02038 (2021) https://doi.org/10.1051/e3sconf/202128302038
ICCAUE 2021

 Figure3. The average income of the aging population in new districts

 Based on the economic development of Nanjing in Implementation), the multivariate integer linear planning
 recent years, we have calculated an average annual results for future nursing homes in Nanjing can be
 growth rate of of 8.25% and a fee level growth rate of obtained by substituting the data as shown in the table
 of 5.3%. below.
 Based on the notice and relevant requirements of the
 Nanjing Rating Standards for Nursing Homes (for Trial

 Figure4. The number of proposed elderly care facilities in No1. Main district

 5
E3S Web of Conferences 283, 02038 (2021) https://doi.org/10.1051/e3sconf/202128302038
ICCAUE 2021

 Figure5. The number of proposed elderly care facilities in No2. Jiangbei district

 Figure6. The number of proposed elderly care facilities in No3. Jiangqi district

 6
E3S Web of Conferences 283, 02038 (2021) https://doi.org/10.1051/e3sconf/202128302038
ICCAUE 2021

 Figure7. The number of proposed elderly care facilities in No4. Nancheng district

 (ageing). It is therefore necessary to study how to
 maximise the benefits of elderly resources in an integrated
 3.2.4 Discussion and analysis
 and efficient manner. The model transforms a non-linear
 It can be seen that due to the high per capita wage level problem into a linear one, and the model is relatively
 and high population density in the main urban area, most simple to solve. Facing different subjects, collecting
 of the proposed elderly care institutions are of 4A and 5A information about the subjects under study, and
 grades. In view of the limited area of the main urban area, understanding the current number, growth trends, and
 A and 2A grade institutions are not built. Jiangqi District influencing factors of the population to be studied, it is
 and Nancheng District, due to their relatively large areas possible to simulate the needs of that population over a
 and relatively low wage levels, are mostly building low- certain period and thus make planning. The planning and
 grade elderly institutions to meet demand as far as forecasting model has good universality and can be
 possible. Jiangbei District has a high number of low-grade applied to various spatial scales such as counties, districts,
 elderly care institutions due to its relatively dense cities, and even provinces. At the same time, the model
 population. In contrast, many high-grade elderly care can be used to forecast not only elderly institutions but
 institutions have been built in the long-term planning of also public facilities such as schools, hospitals, and other
 Jiangbei New District due to the influence of favorable public facilities. Future scholars could improve this
 national policies, the rapid rise in wage levels and the study's zoning method by introducing uninclusive social
 steady improvement in people's living standards. factors in various ways, effectively improving the
 Considering the actual topography and economic accuracy of the zoning and reducing the impact of
 development level of each region, the higher-grade subjective factors. In addition, in the multivariate linear
 elderly institutions are placed in the more economically model section, the effects of the constraints can also be
 developed and densely populated areas while taking into explored in depth, so that the tight constraints of the
 account that the distribution of each grade of elderly planning model can be listed and the model can be
 institutions is as equal as possible. optimised and simplified at the same time
 The prediction results of this model are consistent with
 the policy decisions related to the planning of elderly care References
 institutions in Nanjing, thus verifying the reasonableness
 of the model. 1. Hu Yuhan, Li Guorui, Zhong Xinyi, Ye Xinchen, Qiu
 Hengjia. Using Status and Influencing Factors of
 Home:Based Care Services for The Elderly in Putian
 4 Conclusion
 City [J]. Northwest Population
 In the short term, China's elderly population will continue Journal,2019,40(06):101-113.
 to grow at a high rate, while at the same time the process 2. Wang Zhifeng, Ren Yanlin, Lu Yufeng, Sun Deqiang,
 of ageing will intensify and the rate of growth of the Feng Qi. Input-output characteristics and evaluation
 elderly will increase significantly. During this period, the methods of petroleum engineering science and
 ageing of our population will enter an unprecedentedly technology projects [J]. China Petroleum and
 aggressive phase, in terms of scale, speed and depth Chemical Standard and Quality,2018,38(06):140-141.

 7
E3S Web of Conferences 283, 02038 (2021) https://doi.org/10.1051/e3sconf/202128302038
ICCAUE 2021

 3. Li Lu. Prediction and Analysis of Population Aging in
 Anhui Province——Based on Grey GM (1,1) Model
 [J]. Journal of Luoyang Institute of Science and
 Technology (Social Science Edition), 2020, 35(01):
 25-31+79.
 4. Chen Jiangyun. Study on the aged care and medical
 care integrated mode and health security of the
 elderly under the background of healthy aging[D].
 Huazhong University of Science and
 Technology,2019.
 5. Shi Fei,Ju Yang. Towards Sustainable Cities: Using
 Multiple Linear Regression Model to Identify
 Influencing Factors to Promote the Use of Public
 Transport in Downtown Nanjing, China[J]. China
 City Planning Review,2017,26(04):17-24.
 6. Ma Qianqian, Liang Like, Zhang Gaisu, Zhang
 Jingjing, Li Yang. Research on Spatial Differences of
 Population Economic Density in Henan Province
 Based on the County Unit [J]. Journal of Henan
 University (Natural Science),2017,47(01):1-7+47.
 7. Li Peng, Liu Feiyan. Multiple-index Comprehensive
 Regression Scoring [J]. Journal of Applied Statistics
 and Management,2014,33(03):408-415.
 8. Wang Xiaolong, Yang Guang, Zhang Baohua, Xia Bo,
 Sun Shouqiang. Application of Gray and Improved
 Model in Population Forecast [J]. World Sci-Tech R
 and D,2009,31(04):757-758.
 9. Liang Qin. Prediction of Aged Population Based on
 Grey Prediction Model[D]. Harbin Institute of
 Technology,2017.

 8
You can also read