EMPIRICAL MOBILE NETWORK TRAFFIC PREDICTION: STATISTICAL COMPARATIVE PERFORMANCE ANALYSIS USING MIMO RBFN NETWORK MODEL
←
→
Page content transcription
If your browser does not render page correctly, please read the page content below
Kwabena: Empirical mobile network traffic prediction: Statistical comparative
                                                                 performance analysis using Mimo RBFN network model.
                                                                                                                     - 37 -

     EMPIRICAL MOBILE NETWORK TRAFFIC PREDICTION:
     STATISTICAL COMPARATIVE PERFORMANCE ANALYSIS
             USING MIMO RBFN NETWORK MODEL
                             ODURA-GYIMAH, F. K.1* – BOATENG, K. O.2
    1
        Faculty of Engineering, Ghana Communication Technology University, Accra, Ghana.
         2
             Department of Computer Engineering, Kwame Nkrumah University of Science and
                                    Technology, Kumasi, Ghana.

                                         *Corresponding author
                                      e-mail: foduro[at]gctu.edu.gh
                                 (Received 17th April 2021; accepted 26th June 2021)

Abstract. The exponential demand of telecommunication traffic require the development of different
forecasting models in order to help industry players to plan for the future. The available forecasting traffic
models are mostly developed for single-input single-output traffic data. The study applies multiple-input
multiple-output (MIMO) radial basis neural network (RBFNN) model to instantaneously forecast five
different time spans of telecommunication network traffic obtained from 4G and 3G networks operators.
The data was taken from 3G uplink hourly, 3G daily voice, 4G weekly, 3G downlink monthly and 3G
downlink quarterly from 2015 to 2017. The results prove that MIMO RBFNN (5-10-5) gives higher
prediction accuracy than the other three MIMO models when subjected to different statistical tests.
Keywords: 4G, 3G, radial basis function neural network, multiple-input and multiple-output, forecasting

Introduction
    The rise in the volume of telecommunication network traffic due to enhanced
services provided by operators well continue in the future. The forecast figures indicate
an increase in subscription to 5.7 billion in 2023. This figure represent about 71% of the
world population. The Middle East and Africa figure for monthly data traffic from
mobile is expected to be 14 exabytes by 2023 (CISCO Official Portal, 2020). In the past
several different forecasting models have been proposed to estimate the ever increasing
volumes of telecommunication network traffic data (Zhang and You, 2020; Iqbal et al.,
2019; Zhang et al., 2019; Zhang et al., 2017). However the concentration has centred on
single-input single output models Multiple-input multiple-output (MIMO) models have
also received massive attention by researchers in other fields. For example Soares
Mayer et al. (2020) used MIMO Radial Basis Function Neural Network (RBFNN) to
predict transmitter beamforming, Tripura et al. (2018) compared MIMO Nonlinear
Autoregressive with Exogenous Inputs (NARX) and MIMO RBFNN models to forecast
river flow with MIMO NARX model performing better than MIMO RBFNN.
    The study adopted the MIMO RBFNN that integrated the direct MIMO method since
it is capable of taking sequential stochastic dependencies of past data and generating
forecast. The 5-input 5-output MIMO RBFNN provides another method for the
prediction of different time spans of telecommunication network traffic data. RBFNN
prediction is found in different fields such as pattern classification (Anifowose, 2010),
network traffic (Szmit et al., 2013), telephone traffic prediction (Li et al., 2013), energy
consumption (Staiano and Inneguale, 2017), financial time series (Wang et al., 2016),
(Franco and Steiner, 2017). Biernacki (2017) used ARIMA, MLP, RBFNN and

QUANTUM JOURNAL OF ENGINEERING, SCIENCE AND TECHNOLOGY 2(4): 37-48.
http://www.qjoest.com
© 2021 Quantum Academic Publisher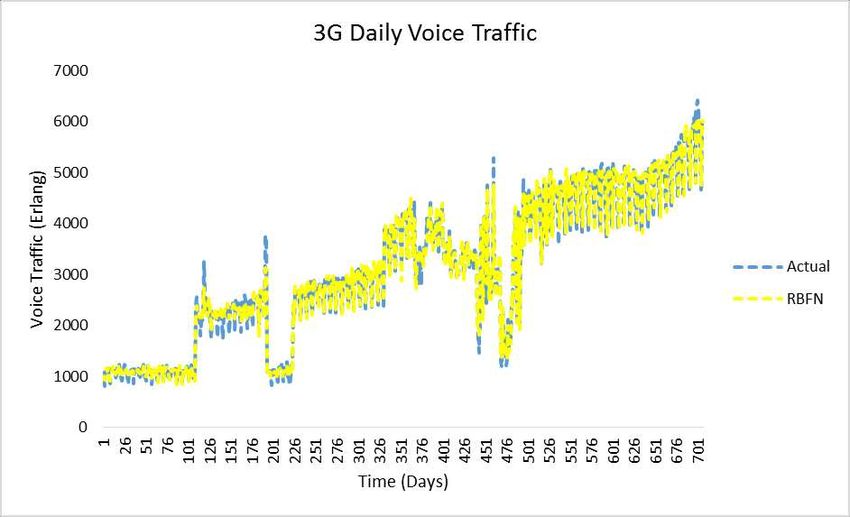
Kwabena: Empirical mobile network traffic prediction: Statistical comparative
                                                         performance analysis using Mimo RBFN network model.
                                                                                                             - 38 -

FARIMA to forecast internet traffic and concluded that MLP, RBFNN and FARIMA
models generally produced similar results which were better than ARIMA models.
Wysocki and Ławryńczuk (2016) as well as Marček and Square (2015) suggested a
hybrid ARIMA/RBFN network to forecast stock index data. ARIMA-RBFN for
hydrological data (Xing and Lou, 2019).
   Mohanty et al. (2014) also used a momentum based RBFNN for the pitch controller
of an aircraft to obtain the desired pitch angle which is an important parameter for
pilots. Huang (2014) applied the capabilities of RBFNN and Elman neural network in
the analysis and design of hybrid generation system. The two neural networks were
providing complimentary services to each other but not merely comparing their
efficiency. Santhanam and Subhajini (2011) developed RBFNN and Back Propagation
neural network (BPNN) models in forecasting the rainfall pattern using meteorological
data. Zaleski and Kacprzak (2010) applied RBFNN model to predict short-term values
of traffic volume generated by Transmission Control Protocol/Internet Protocol
(TCP/IP) packet network users. Ozovehe et al. (2018) employed RBFNN, MLP, ANFIS
models and Group Method of Data Handling (GMDH) to analysed the traffic of base
station cells of GSM/GPRS. The prediction results showed that GMDH performed
better than the three models.

Materials and Methods
Modelling multiple-input multiple-output radial basis function neural network for 4G
and 3G network
   Multiple-Input Multiple-Output (MIMO) method is basically the inter-relations of
variables between inputs and outputs instantaneously. The MIMO methods are
classified into two: (a) multi-stage MIMO (b) single-stage or direct MIMO.

Multi-stage MIMO
   This approach is established on forecasting horizons which generates multi-step
outputs at different horizons where learning is carried out by one multiple-output mode.
The process is determined by Equation (1) as;

                                                                         (Eq. 1)

   where; yn+(.) are the multiple-output and multiple-input per cycle; k is an integer
(k>1), w represent the vector noise for zero mean and non-diogonal covariance; and d is
the maximum embedded order. To determine k steps after learning process the Equation
(2) is applied;

                                                                         (Eq. 2)

   In the process model restriction are encountered because prediction horizons are
inside the same model structure.

Single-stage or direct MIMO

QUANTUM JOURNAL OF ENGINEERING, SCIENCE AND TECHNOLOGY 2(4): 37-48.
http://www.qjoest.com
© 2021 Quantum Academic Publisher
Kwabena: Empirical mobile network traffic prediction: Statistical comparative
performance analysis using Mimo RBFN network model.
- 39 -
In this method one-step forecasting is provided in one segment in spite of the number
of multiple outputs considered and the prediction is direct under varying time horizon.
The factor of model restriction is non-existent with this method. The direct MIMO
approach is determined from Equation (3) as;
(Eq. 3)
where; u(n) = [u1(n), ... ... ..., ur(n)]T and y(n) = [y1(n), ... ... ..., yr(n)]T are the input
and output vectors, dy and du represent the input and output time lags, h represents the
prediction time horizon and f(n) = [f1(n), ... ... ..., fr(n)]T is the nonlinear relation to be
estimated. The basic architecture of the RBFN is a three layer (Suzuki, 2011) supervised
feed-forward network (Xu et al., 2012) applied in interpolation, probability density
function prediction etc. The input layer is composed of n input data. It is fully connected
to the neurons in the second layer. The hidden layer transforms the data from the input
space to the hidden space using a non-linear function (Anifowose, 2010). A hidden node
has a radial basis function (RBF) as an activation function. The output layer, which is
linear, yields the response, where the output value is determined from the weighted sum
method and node number in the hidden layer network (Anifowose, 2010).
RBF is a real-valued function whose value depends only on the distance from some
other point c called a centre (Giveki and Rastegar, 2019) and is given in Equation (4);
f(x, c) = f ( || x - c || ) (Eq. 4)
where; || x - c || is the Euclidean distance between vector x and centre ci. The norm is
often Euclidean distance, however other distance functions are also possible. The output
of i’th neuron in the output layer of the RBFN is given in Equation (5) as (Suzuki
2011):
(Eq. 5)
The φ(.) is the basis function which is described using ||x-cj||. (w1i . . . ,wni) of
connection weights between the n input nodes and the hidden node i.
Training of MIMO RBFNN model
The RBFN network training is in two phases (Dash et al., 2016): (1) the
unsupervised learning phase which involves input layer and the hidden layer; and (2)
the supervised learning phase which is applied from the hidden layer to the output layer.
For this study, the LM algorithm was adopted as a learning rule to train the RBF
network. LM is the most popular optimization algorithm. The LM algorithm provides a
solution for nonlinear least squares minimization problem and the function to be
minimized is given in Equation (6) as (Al-Mayyahi et al., 2015);
QUANTUM JOURNAL OF ENGINEERING, SCIENCE AND TECHNOLOGY 2(4): 37-48.
http://www.qjoest.com
© 2021 Quantum Academic PublisherKwabena: Empirical mobile network traffic prediction: Statistical comparative
performance analysis using Mimo RBFN network model.
- 40 -
(Eq. 6)
where; x = (x1, x2, ..., xn) is a vector and rj are residuals. The derivatives of f can be
written using Jacobian matric J of r defined as (Equation 7);
(Eq. 7)
The output of i’th neuron in the output layer of the RBFN is given as (Suzuki,
2011)(Equation 8);
(Eq. 8)
For non-linear least squares, the minimization problems can be solved using LM
algorithm. When the performance function has the form of a sum of squares, then the
Hessian matrix, H can be approximated in Equation (9) as (Ramesh et al., 2008);
(Eq. 9)
where J is the Jacobian matrix that contains the first derivatives of network errors
and the gradient, gw can be computed in Equation (10) as;
(Eq. 10)
where e is a vector of network errors. The LM algorithm uses the approximation to
the Hessian matrix Equation (11) (Ebrahimzadeh and Khazaee, 2010);
(Eq. 11)
where I is the identity matrix and is a constant. decreases after each successful
step and increases only when a tentative step would increase the performance function.
The RBF uses a radially symmetric function (e.g., Gaussian) expressed in Equation
(12);
(Eq. 12)
where M and σ are the mean and the standard deviation of the input variable x. The
value on j output neuron network may be described as a function of the input vector x
given by the Equation (13) (Suzuki, 2011);
QUANTUM JOURNAL OF ENGINEERING, SCIENCE AND TECHNOLOGY 2(4): 37-48.
http://www.qjoest.com
© 2021 Quantum Academic PublisherKwabena: Empirical mobile network traffic prediction: Statistical comparative
performance analysis using Mimo RBFN network model.
- 41 -
(Eq. 13)
Where; N is the number of neurons in the hidden layer; x is the input vector; ci is the
centre vector for neuron i and wi is the weight of neuron i in the linear output neuron.
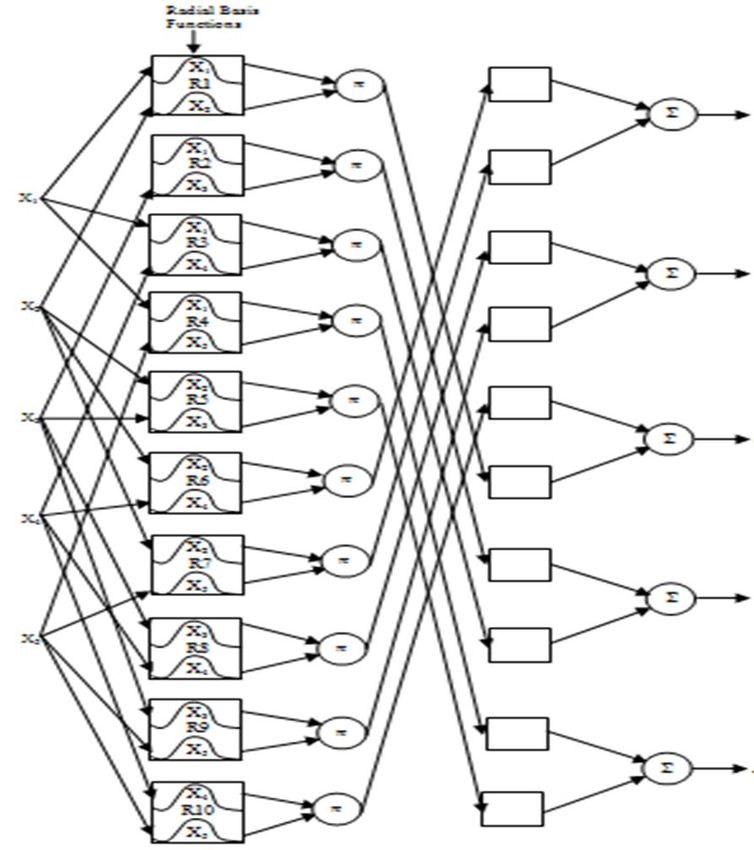
Creation and configuration of 5-input 5-output MIMO RBFNN
In the study, RBFN model of three layers was configured as multiple-input multiple-
output (MIMO) that accepts five inputs of telecommunication network traffic of hourly,
daily, weekly, monthly and quarterly time spans. The architecture for this study is
illustrated in Figure 1 with five inputs labelled as X1, X2, X3, X4 and X5. The inputs
denote telecommunication network traffic of five different time spans; X1 = traffic
measurement in hours; X2 = traffic measurement in days; X3 = traffic measurement in
weeks; X4 = traffic measurement in months; and X5 = traffic measurement in quaters.
The 5-input 5-output MIMO RBFN network model applied 3G uplink hourly traffic, 3G
daily voice traffic, 4G weekly traffic, 3G monthly downlink traffic and 3G quaterly
downlink as the input data. The normalisation procedure was performed on each data
set which eventually gave the division of training = 70%, testing = 15%, and validation
= 15%.
Figure 1. RBFNN Architecture with 5-Input 5-Output Configuration.
Training of 5-input 5-output MIMO RBFNN
The parameters utilised in the training of the MIMO RBFNN is given in Table 1. In
the unsupervised phase, weight change was used for termination with a threshold value
QUANTUM JOURNAL OF ENGINEERING, SCIENCE AND TECHNOLOGY 2(4): 37-48.
http://www.qjoest.com
© 2021 Quantum Academic PublisherKwabena: Empirical mobile network traffic prediction: Statistical comparative
performance analysis using Mimo RBFN network model.
- 42 -
of 0.0001. The learning rate began at 0.01 and decayed to a low value of 0.001. With
the MSE termination of the supervised phase, the increase function was utilised since
the cross validation (CV) set was used. This was employed to monitor the generalisation
process to be able to stop the network whenever the MSE of the CV set starts to rise.
Table 1. Data used to calculate water demand.
Parameters 5-input 5-output
Input PE 5
Output PE 5
Exemplars 1318
Hidden layer 1
Cluster centre 25
Competitive Rule Conscience full
Metric Euclidean
Supervised Learning 1100 Epochs
Unsupervised Learning 100 Epochs
Hidden layer -
PE in Hidden layer 9
Transfer function TanhAxon
Learning rule LM
Output layer -
Transfer function TanhAxon
Learning rule LM
Termination MSE (Increase)
Weight update Batch (supervised)
Results and Discussion
Measurement of mobile network data
The 4G network traffic data for the study was collected in 2017 from a network
operator in Ghana (Table 2). The data was measured from the S5/S8 interface of the
Packet Data Network Gateway (P-GW) in the 4G Evolved Packet Core where mobile
data traffic is monitored from GPRS Tunnelling Protocol user plane (GTP-U). With the
3G data, it was collected on a large network in Ghana from 2015 to 2017. The network
has three RNCs, two SGSNs and two MSCs. The study area covered the whole country
which was divided into three (3) clusters (Northern Sector, Western Sector and Eastern
Sector). The clusters were each designated with a Radio Network Controller (RNC).
The descriptive statistics of the two networks and the corresponding values are provided
in Table 2.The breakdown are 957 samples of 3G hourly uplink traffic, 707 samples of
3G daily voice traffic, 28 samples of 4G weekly traffic, 72 samples of 3G monthly
downlink traffic and 15 samples of 3G downlink quarterly traffic. Table 3 shows the
division of the samples into 70% for training, 15% for testing and 15% for validation
and NeuroSolutions software was applied in the analysis.
Table 2. Descriptive statistics of aggregated 4G and 3G network traffic data.
Statistics 957 samples 707 samples 28 samples 72 samples 15 samples
(hourly) 3G (daily) 3G (weekly) 4G (montlhy) 3G (quarterly)
uplink voice downlink 3G downlink
Mean 71061.59 3121.063 82067313 3114591.0 13919290
Median 71967.59 3036.377 78350251 2383673.0 14087025
QUANTUM JOURNAL OF ENGINEERING, SCIENCE AND TECHNOLOGY 2(4): 37-48.
http://www.qjoest.com
© 2021 Quantum Academic PublisherKwabena: Empirical mobile network traffic prediction: Statistical comparative
performance analysis using Mimo RBFN network model.
- 43 -
Maximum 235352.3 6424.421 2.16e+08 10691053 20920417
Minimum 14897.16 804.6220 3898517 270005.7 6388322.0
Std. Dev. 30059.34 1431.494 44639601 2839062 6582633.0
Skewness 0.702113 0.041234 0.605163 0.794602 -0.019465
Kurtosis 4.038581 1.925203 --- 2.295719 1.100051
Jarque-Bera 121.6387 34.23028 4.440969 9.064749 2.257075
Table 3. Training, testing and validation sample of 3G downlink traffic data.
Data 3G uplink 3G monthly 3G quarterly
3G daily voice 4G weekly
hourly downlink downlink
(707 samples) (28 samples)
(957 samples) (72 samples) (15 samples)
Training (70%) 671 495 20 50 9
Validation (15%) 143 106 4 11 3
Testing (15%) 143 106 4 11 3
MIMO RBFN network training for 4G and 3G traffic
The initial rate of unsupervised learning was 0.01 which decayed to 0.001 with an
iteration of 100. In the modelling of the MIMO RBFN network, several configurations
were performed each with 5-input and 5-output and application of varied cluster centres
from 1 to 25. The Tanhaxon transfer function and LM learning rules were also applied
in both hidden and output layers. In total four different MIMO RBFN networks were
developed and the goodness of fit statistics values were compared as illustrated in Table
4. The MIMO RBFN network model is represented in bracket as first digit for input
traffic, second digit for cluster centre and third digit for output traffic. For example,
MIMO RBFN (5-13-5) implies 5 time spans as input traffic data, 13 as cluster centre
and 5 time spans as output traffic data. From Table 4 the best model selected from the
four obtained is MIMO RBFN (5-10-5) network.
Table 4. 5-input 5-output RBFN model selection criteria with 4G and 3G traffic data.
MIMO RBFN architecture MSE NRMSE R
5-13-5 0.00166 0.0226 0.9799
5-18-5 0.00415 0.0358 0.9699
5-10-5 0.000360 0.0105 0.9888
5-5-5 0.00151 0.0216 0.9537
MIMO RBFN network model forecasting
The predicted traffic of the MIMO RBFN (5-10-5) network model for five time span
traffic are shown in Figure 2, Figure 3, Figure 4, Figure 5 and Figure 6. The
performance of the model was validated with 3G hourly uplink traffic, 3G daily voice
traffic, 4G weekly traffic, 3G monthly downlink traffic and 3G downlink quarterly
traffic.
QUANTUM JOURNAL OF ENGINEERING, SCIENCE AND TECHNOLOGY 2(4): 37-48.
http://www.qjoest.com
© 2021 Quantum Academic PublisherKwabena: Empirical mobile network traffic prediction: Statistical comparative
performance analysis using Mimo RBFN network model.
- 44 -
Figure 2. Prediction performance of five model using 3G hourly uplink traffic data.
Figure 3. Perdiction performance of five models using 3G daily voice traffic data.
QUANTUM JOURNAL OF ENGINEERING, SCIENCE AND TECHNOLOGY 2(4): 37-48.
http://www.qjoest.com
© 2021 Quantum Academic PublisherKwabena: Empirical mobile network traffic prediction: Statistical comparative
performance analysis using Mimo RBFN network model.
- 45 -
Figure 4. Prediction performance of five models using 4G weekly traffic data.
Figure 5. Prediction performance of five models using 3G monthly downlink traffic data.
QUANTUM JOURNAL OF ENGINEERING, SCIENCE AND TECHNOLOGY 2(4): 37-48.
http://www.qjoest.com
© 2021 Quantum Academic PublisherKwabena: Empirical mobile network traffic prediction: Statistical comparative
performance analysis using Mimo RBFN network model.
- 46 -
Figure 6. Prediction performance of five models using 3G quarterly downlink traffic data.
Conclusion
The study developed the direct MIMO RBFN model of 5-input 5-output
configuration with Tanhaxon transfer function and learning rule of Levenberg-
Marquardt in both the hidden and output layers. The four best fit models chosen for the
five time spans of 3G uplink hourly, 3G daily voice, 4G weekly, 3G downlink monthly
and 3G downlink quarterly were MIMO RBFN (5-13-5), MIMO RBFN (5-18-5),
MIMO RBFN (5-10-5) and MIMO RBFN (5-5-5). The goodness of fit statistics such as
MSE, NRMSE and R were used to select the best model out of the four provided.
Observing the goodness of fit statistics of all models, MIMO RBFN (5-10-5) model was
found with the least values and could be used to simultaneously predict five time spans
of 4G and 3G traffic.
Acknowledgement
This research was self-financed without any support.
Conflict of interest
The author confirm there are no conflict of interest involve with any parties in this
research.
REFERENCES
[1] Al-Mayyahi, A., Wang, W., Birch, P. (2015): Levenberg-Marquardt optimised neural
networks for trajectory tracking of autonomous ground vehicles. – International Journal
of Mechatronics and Automation 5(2-3): 140-153.
QUANTUM JOURNAL OF ENGINEERING, SCIENCE AND TECHNOLOGY 2(4): 37-48.
http://www.qjoest.com
© 2021 Quantum Academic PublisherKwabena: Empirical mobile network traffic prediction: Statistical comparative
performance analysis using Mimo RBFN network model.
- 47 -
[2] Anifowose, F.A. (2010): A Comparative Study of Gaussian Mixture Model and Radial
Basis Function for Voice Recognition. – International Journal of Advanced Computer
Science and Applications (IJACSA) 1(3): 9p.
[3] Biernacki, A. (2017): Analysis and modelling of traffic produced by adaptive HTTP-
based video. – Multimedia Tools and Applications 76(10): 12347-12368.
[4] CISCO Official Portal (2020): Cisco Annual Internet Report (2018-2021). – CISCO
Official Portal. Available on:
https://www.cisco.com/c/en/us/solutions/collateral/executive-perspectives/annual-
internet-report/white-paper-c11-741490.html
[5] Dash, C.S.K., Behera, A.K., Dehuri, S., Cho, S.B. (2016): Radial basis function neural
networks: a topical state-of-the-art survey. – Open Computer Science 6(1): 33-63.
[6] Ebrahimzadeh, A., Khazaee, A. (2010): Detection of premature ventricular contractions
using MLP neural networks: A comparative study. – Measurement 43(1): 103-112.
[7] Franco, D.B., Steiner, M.T.A. (2017): New strategies for initialization and training of
radial basis function neural networks. – IEEE Latin America Transactions 15(6): 1182-
1188.
[8] Giveki, D., Rastegar, H. (2019): Designing a new radial basis function neural network by
harmony search for diabetes diagnosis. – Optical Memory and Neural Networks 28(4):
321-331.
[9] Huang, C.H. (2014): Modified neural network for dynamic control and operation of a
hybrid generation systems. – Journal of Applied Research and Technology 12(6): 1154-
1164.
[10] Iqbal, M.F., Zahid, M., Habib, D., John, L.K. (2019): Efficient prediction of network
traffic for real-time applications. – Journal of Computer Networks and Communications
11p.
[11] Li, J., Jia, Z., Qin, X., Sheng, L., Chen, L. (2013): Telephone traffic prediction based on
modified forecasting model. – Research Journal of Applied Sciences, Engineering and
Technology 6(17): 3156-3160.
[12] Marček, D., Square, B. (2015): Hybrid arima/rbf framework for prediction bux index. –
Journal of Computer and Communications 3(05): 9p.
[13] Mohanty, C.S., Khuntia, P.S., Mitra, D. (2014): Momentum Based radial basic function
neural controller for Pitch control of an Aircraft. – Computer Sciences and
Telecommunications 47(1): 30-37.
[14] Ozovehe, A., Okereke, O.U., Chibuzo, A.E., Usman, A.U. (2018): Comparative analysis
of traffic congestion prediction models for cellular mobile macrocells. – European
Journal of Engineering and Technology Research 3(6): 32-38.
[15] Ramesh, J., Vanathi, P.T., Gunavathi, K. (2008): Fault Classification in Phase‐Locked
Loops Using Back Propagation Neural Networks. – ETRI journal 30(4): 546-554.
[16] Santhanam, T., Subhajini, A.C. (2011): An efficient weather forecasting system using
radial basis function neural network. – Journal of Computer Science 7(7): 962-966.
[17] Soares Mayer, K., Aguiar Soares, J., Soares Arantes, D. (2020): Complex MIMO RBF
Neural Networks for Transmitter Beamforming over Nonlinear Channels. – Sensors
20(2): 378p.
[18] Staiano, A., Inneguale, F. (2017): An RBF neural network-based system for home smart
metering. – In 2017 IEEE International Conference on Fuzzy Systems (FUZZ-IEEE) 6p.
[19] Suzuki, K. (2011): Artificial Neural Network: Methodological Advances and Biomedical
Applications. – IntechOpen 374p.
[20] Szmit, M., Szmit, A., Kuzia, M. (2013): Usage of RBF Networks in prediction of network
traffic. – In FedCSIS (Position Papers) 3p.
[21] Tripura, J., Roy, P., Barbhuiya, A.K. (2018): Application of RBFNNs Incorporating
MIMO Processes for Simultaneous River Flow Forecasting. – Journal of Engineering &
Technological Sciences 50(3): 434-449.
QUANTUM JOURNAL OF ENGINEERING, SCIENCE AND TECHNOLOGY 2(4): 37-48.
http://www.qjoest.com
© 2021 Quantum Academic PublisherKwabena: Empirical mobile network traffic prediction: Statistical comparative
performance analysis using Mimo RBFN network model.
- 48 -
[22] Wang, J., Wang, J., Fang, W., Niu, H. (2016): Financial time series prediction using
elman recurrent random neural networks. – Computational Intelligence and Neuroscience
14p.
[23] Wysocki, A., Ławryńczuk, M. (2016): Elman neural network for modeling and predictive
control of delayed dynamic systems. – Archives of Control Sciences 26(1): 117-142.
[24] Xing, S., Lou, Y. (2019): Hydrological time series forecast by ARIMA+ PSO-RBF
combined model based on wavelet transform. – In 2019 IEEE 3rd Information
Technology, Networking, Electronic and Automation Control Conference (ITNEC) 5p.
[25] Xu, X.Z., Ding, S.F., Shi, Z.Z., Zhu, H. (2012): Optimizing radial basis function neural
network based on rough sets and affinity propagation clustering algorithm. – Journal of
Zhejiang University SCIENCE C 13(2): 131-138.
[26] Zaleski, A., Kacprzak, T. (2010): Packet switching networks traffic prediction based on
radial basis function neural network. – Journal of Applied Computer Science 18(2): 91-
101.
[27] Zhang, X., You, J. (2020): A gated dilated causal convolution based encoder-decoder for
network traffic forecasting. – IEEE Access 8: 6087-6097.
[28] Zhang, C., Patras, P., Haddadi, H. (2019): Deep learning in mobile and wireless
networking: A survey. – IEEE Communications Surveys & Tutorials 21(3): 2224-2287.
[29] Zhang, P., Wang, L., Li, W., Leung, H., Song, W. (2017): A web service qos forecasting
approach based on multivariate time series. – In 2017 IEEE International Conference on
Web Services (ICWS) 8p.
QUANTUM JOURNAL OF ENGINEERING, SCIENCE AND TECHNOLOGY 2(4): 37-48.
http://www.qjoest.com
© 2021 Quantum Academic PublisherYou can also read