PLANET ANALYTIC FEEDS - PERFORMANCE METRICS - April 2021
←
→
Page content transcription
If your browser does not render page correctly, please read the page content below
PLANET ANALYTIC FEEDS
PERFORMANCE METRICS

PLANET.COM              April 2021
Planet Analytic Feeds | Performance Metrics                                                April 2021

OVERVIEW

Planet Analytic Feeds leverages computer vision to transform our imagery into information feeds
that detect and classify objects, identify geographic features, and understand change over time
across the globe. This model performance guide is intended to help users access the Analytic Feeds
and leverage them to build applications and solutions. First, we detail model performance
characteristics of each feed. In the last section we detail our performance metrics methodology.

© Planet Labs Inc. 2020                                                                              2
Planet Analytic Feeds | Performance Metrics                                                                          April 2021

ROAD DETECTION
Planet’s Road Detection leverages a semantic segmentation computer vision model applied to Planet
Basemaps. Semantic segmentation analyzes an image and designates a “class” for each pixel in the image. In
this case, the model classifies if a pixel belongs to either the “road” or “not road” class. Planet offers 2 versions of
Road Detection Feeds:

    1.    Raw Road Detection - This feed analyzes one monthly basemap at a time, which means it is able to
          produce road detection results that align with the most recent imagery. This Feed should be used when
          recent development is important.
    2.    De-Noised Road Detection - This feed analyzes all of Planet’s monthly basemaps dating back to July of
          2017, requiring that a pixel be classified as a road multiple times in a row in order to ensure the highest
          possible accuracy. Because it requires multiple time periods, its results have a 2-3 month lag, meaning
          detections made in April may be correlated with roads that appeared in February. This Feed should be
          used when higher accuracy is needed and latency is not a concern.
              a. Note: This feed will assume any detected roads will remain roads moving forward - it only takes
                   into account new road development, so any road detections will persist even if the road is
                   demolished in the future.

The resulting classifications are merged into a single raster with the same resolution as the imagery. This raster
is packaged as a GeoTIFF file and is available for download through the Analytics API or to be streamed into a
GIS tool like QGIS through Planet’s Web Map Tile Service.

 Feature extracted                   Roads
                                     Defined as any path a truck could drive on not covered by snow and not in the
                                     cryosphere

 Model Type                          Semantic segmentation

 Input                               Planet Global Basemap

 Output                              GeoTIFF

 Refresh                             Monthly

 Delivery                            Analytics API
                                     WMTS

© Planet Labs Inc. 2020                                                                                                      3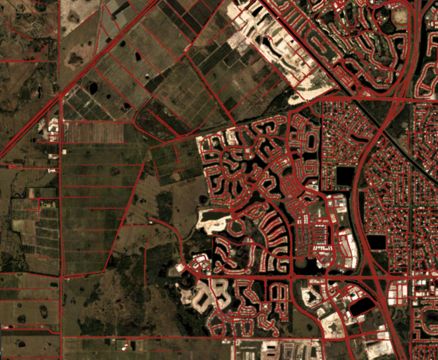
Planet Analytic Feeds | Performance Metrics                                                                  April 2021

PERFORMANCE

Overview

Planet’s models are generalized to work globally and have been tested and tuned extensively on specific AOIs
and object definitions. As the Earth is heterogeneous in both time and space, performance will vary
significantly depending on AOIs, object definitions and external factors. Metrics shown below may not be fully
representative of a specific AOI.

Due to a combination of factors, including atmospheric conditions and PlanetScope resolution, human
performance rarely exceeds 90 percent. Our analysis leads to the following results for Raw Road Detection:
precision ~75 percent; recall ~60 percent; and F1 ~65 percent. We see a bump of 5 points across the board for our
de-noised Road Detection Feed. We recommend that our products be used for applications in conjunction
with other data sources.

Key Factors

Our model will perform differently depending on key characteristics of the AOIs. Common false positives
include rivers, beaches, agricultural field lines, barren scruff, scattered snow, dry creeks, tidal sand, and choppy
water. Common false negatives include road occlusion and low contrast roads.. As a result, AOIs with a higher
proportion of objects as listed above will see lower performance.

Performance will also likely decrease in case of haze, clouds, or attenuated visibility due to bad atmospheric
conditions or snow. Besides AOI characteristics, shadows from neighboring buildings can affect road
boundaries, impacting performance. Typically, detection on smaller roads (width < 10m/3px) will not be
recognized. Our analysis on our own datasets leads to the following results for land type.

© Planet Labs Inc. 2020                                                                                                4
Planet Analytic Feeds | Performance Metrics                                         April 2021

Representative Examples

 AOI                                     Key Factors                  Performance

 San Diego, USA                               -   Great atmospheric
                                                  conditions
                                              -   Large roads
                                              -   No clouds
                                              -   Urban area

 Hyderabad, India                             -   Great atmospheric
                                                  conditions
                                              -   Small roads
                                              -   No clouds
                                              -   Urban area

 Port Saint Lucie, USA                        -   Great atmospheric
                                                  conditions
                                              -   Large roads
                                              -   No clouds
                                              -   Field lines
                                              -   Rural area

 Santa Rosa, USA                              -   Great atmospheric
                                                  conditions
                                              -   Large roads
                                              -   No clouds
                                              -   Forest
                                              -   Rural area

© Planet Labs Inc. 2020                                                                     5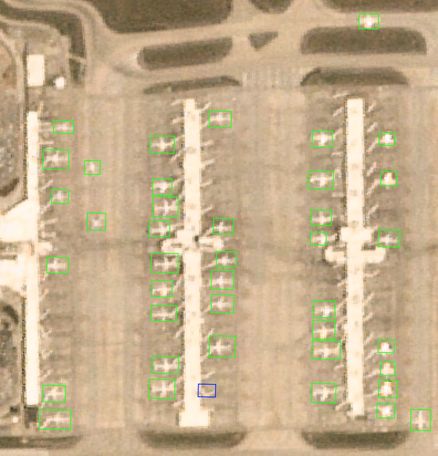
Planet Analytic Feeds | Performance Metrics                                                                                 April 2021

BUILDING DETECTION
Planet’s Building Detection leverages a semantic segmentation computer vision model applied to Planet
Basemaps. Semantic segmentation analyzes an image and designates a “class” for each pixel in the image. In
this case, the model classifies if a pixel belongs to either the “building” or “not building” class. Planet offers 3
versions of Building Detection Feeds:

    1.    Raw Building Detection - This feed analyzes one monthly basemap at a time, which means it is able to
          produce building detection results that align with the most recent imagery. This Feed should be used
          when recent development is important.
    2.    De-Noised Building Detection - This feed analyzes all of Planet’s monthly basemaps dating back to July
          of 2017, requiring that a pixel be classified as a building multiple times in a row in order to ensure the
          highest possible accuracy. Because it requires multiple time periods, its results have a 2-3 month lag,
          meaning detections made in April may be correlated with buildings that appeared in February. It
          requires at least 400 square meters to be classified as a building before it considers to confirm the
          classification. This Feed should be used when higher accuracy is needed, latency is not a concern and
          when only looking for buildings larger than 400 square meters.
              a. Note: This feed will assume any detected buildings will remain buildings moving forward - it
                   only takes into account new building development, so any building detections will persist even
                   if the building is demolished in the future.
    3.    De-Noised Building Detection for Small Buildings - This feed analyzes all of Planet’s monthly basemaps
          dating back to July of 2017, requiring that a pixel be classified as a building multiple times in a row in
          order to ensure the highest possible accuracy. Because it requires multiple time periods, its results have
          a 2-3 month lag, meaning detections made in April may be correlated with buildings that appeared in
          February. This Feed should be used when higher accuracy is needed and latency is not a concern.
              a. Note: This feed will assume any detected buildings will remain buildings moving forward - it
                   only takes into account new building development, so any building detections will persist even
                   if the building is demolished in the future.

The resulting classifications are merged into a single raster with the same resolution as the input image. This
raster is packaged as a GeoTIFF file and is available for download through the Analytics API or to be streamed
into a GIS tool like QGIS through Planet’s Web Map Tile Service.

 Feature extracted                   Buildings
                                     Defined as any single or group of structures that a person could stand beneath. E.g,
                                     Skyscraper, house, tent

 Model Type                          Semantic segmentation

 Input                               Planet Global Basemap

 Output                              GeoTIFF

 Refresh                             Monthly

 Delivery                            Analytics API
                                     WMTS

© Planet Labs Inc. 2020                                                                                                             6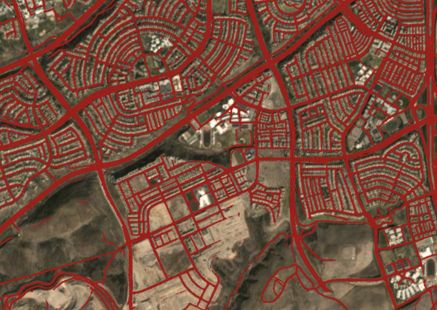
Planet Analytic Feeds | Performance Metrics                                                             April 2021

PERFORMANCE

Overview

Planet’s models are generalized to work globally and have been tested and tuned extensively on specific AOIs
and object definitions. As the Earth is heterogeneous in both time and space, performance will vary
significantly depending on AOIs, object definitions and external factors. Metrics shown below may not be fully
representative of a specific AOI.

Planet’s Building Detection models can detect small buildings more reliably in heavily populated areas than in
sparse ones. For areas with more than 12 buildings per hectare, Planet’s Building Detection can reliably detect
buildings as small as 150-200 square meters. In sparse areas with less than 4 buildings per hectare, Planet is
able to reliably detect buildings as small as 700 square meters.

Due to a combination of factors, including atmospheric conditions and PlanetScope resolution, human
performance rarely exceeds 90 percent. Our analysis leads to the following results for Building Detection:
precision ~60 percent; recall ~70 percent; and F1 ~65 percent. Our de-noised feeds result in a 5 point bump
across all metrics. We recommend that our products be used for applications in conjunction with other data
sources.

© Planet Labs Inc. 2020                                                                                           7
Planet Analytic Feeds | Performance Metrics                                                              April 2021

Key Factors

Our model will perform differently depending on key characteristics of the AOIs. Common false positives
include bare earth patches, dense buildings bleed together, covered crop fields, clouds and cloud shadows, tree
crowns, scattered snow, choppy water, shipping containers, and planes. As a result, AOIs with a higher
proportion of objects as listed above will see lower performance. Performance will also likely decrease in case of
haze, clouds, or attenuated visibility due to bad atmospheric conditions or snow. Besides AOI characteristics,
shadows can affect building boundaries and the size of buildings will impact performance. Typically, detection
on smaller buildings than 20m/6px will not be recognized. Our analysis on our own datasets leads to the
following results for land type.

© Planet Labs Inc. 2020                                                                                          8
Planet Analytic Feeds | Performance Metrics April 2021
Representative Examples
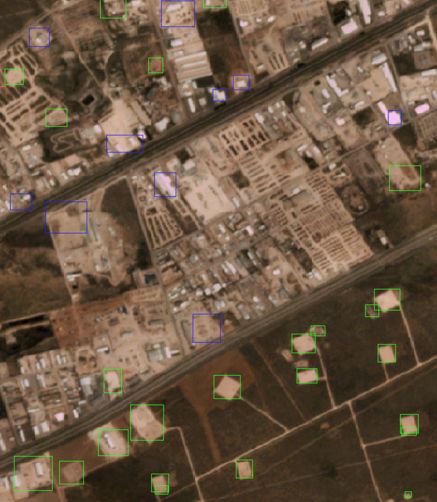
AOI Key Factors Performance
Hefei, China - Great atmospheric
conditions
- Large buildings
- No clouds
- Urban area
Dubai, UAE - Great atmospheric
conditions
- Large buildings
- No clouds
- Planes
- Urban area
Baikonur, Kazakhstan - Great atmospheric
conditions
- Small buildings
- No clouds
- Rural area
© Planet Labs Inc. 2020 9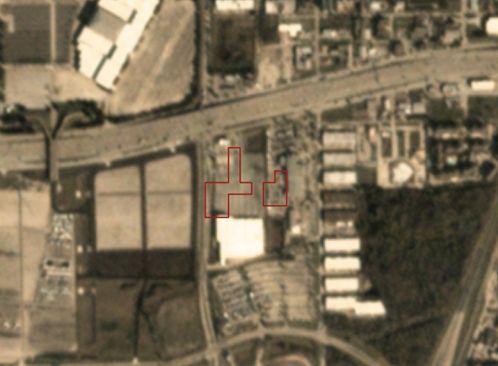
Planet Analytic Feeds | Performance Metrics                                                                             April 2021

 Hyderabad, India                             -   Bad atmospheric
                                                  conditions
                                              -   Small buildings
                                              -   No clouds
                                              -   Barren
                                              -   Suburban

VESSEL DETECTION
Planet’s Vessel Detection leverages an object detection computer vision model applied to Planet’s PlanetScope
imagery. Object detection is a computer vision approach that analyzes an image and generates a “bounding
box” around the relevant object.

The bounding boxes are recorded as vector data, which represent geographic coordinates for the object’s
location. This vector data is packaged in a FeatureCollection GeoJSON file format and is available for querying
through the Analytics API.

 Feature extracted                   Maritime Vessels
                                     Defined as man-made objects designed to move through the water, visible to non-expert
                                     humans.

 Model Type                          Object Detection

 Input                               3-band PlanetScope scenes

 Output                              GeoJSON Feature Collection

 Refresh                             Daily

 Delivery                            Analytics API

 Scale                               Global ports less than 15 km offshore; Does not include in-land water bodies such
                                     as lakes, rivers, etc.

© Planet Labs Inc. 2020                                                                                                        10
Planet Analytic Feeds | Performance Metrics April 2021 PERFORMANCE Overview Planet’s models are generalized to work globally in ports less than 15 km offshore and have been tested and tuned extensively on specific AOIs and object definitions.As the Earth is heterogeneous in both time and space, performance will vary significantly depending on AOIs, object definitions and external factors. It performs well within constrained areas of interest focused on the ports or areas close to shore. Metrics shown below may not be fully representative of a specific AOI. Due to a combination of factors, including atmospheric conditions and PlanetScope resolution, human performance rarely exceeds 90 percent. Our analysis leads to the following results for Vessel Detection: Precision ~70 percent; recall ~70 percent; and F1 ~70 percent. We thus recommend that our products be used for applications in conjunction with other data sources. Key Factors Our model will perform differently depending on key characteristics of the AOIs. Common errors include waves along shores, beach sand and waves, very small islands, end of piers, docked ships, bundled vessels, and clouds. As a result, AOIs with a higher proportion of objects as listed above will see lower performance. Performance will also likely decrease in case of haze, clouds, or attenuated visibility due to bad atmospheric conditions. Besides AOI characteristics, the size of vessels will significantly impact performance. Typically, detection on vessels smaller than 150m/50px have lower quality. Users can expect precision to decrease for smaller vessels. © Planet Labs Inc. 2020 11
Planet Analytic Feeds | Performance Metrics                                          April 2021

Representative Examples

 AOI                                     Key Factors                   Performance

 Nampo, North Korea                           -   Great atmospheric
                                                  conditions
                                              -   Large vessels only
                                              -   No islands
                                              -   No end of piers
                                              -   No docked ships

 Nampo, North Korea                           -   Great atmospheric
                                                  conditions
                                              -   Small vessels
                                              -   No islands
                                              -   No end of piers
                                              -   No docked ships

© Planet Labs Inc. 2020                                                                      12
Planet Analytic Feeds | Performance Metrics April 2021
Port Dalian, China - Poor atmospheric
conditions
- All vessels
- No islands
- End of piers
- Docked ships
Naples, Italy - Decent
atmospheric
conditions
- Small vessels only
- No islands
- Long piers
- Locked ships
PLANE DETECTION
Planet’s Plane Detection leverages an object detection computer vision model applied to Planet’s PlanetScope
imagery. Object detection is a computer vision approach that analyzes an image and generates a “bounding
box” around the relevant object.
The bounding boxes are recorded as vector data, which represent geographic coordinates for the object’s
location. This vector data is packaged in a FeatureCollection GeoJSON file format and is available for querying
through the Analytics API.
Feature extracted Airplanes
Defined as man-made objects designed to fly through the air
Model Type Object Detection
Input 3-band PlanetScope scenes
Output GeoJSON Feature Collection
Refresh Daily
Delivery Analytics API
Scale Global airports and airfields
© Planet Labs Inc. 2020 13Planet Analytic Feeds | Performance Metrics April 2021
PERFORMANCE
Overview
Planet’s Plane Detection model was trained on a distributed set of airfields and airports throughout the world,
designed to expose the model to different conditions. It performs well within constrained areas of interest
focused on the airport or airfield of interest, it cannot be used over broad areas.
Due to a combination of factors, including atmospheric conditions and PlanetScope resolution, human
performance rarely exceeds 90 percent. Our analysis leads to the following results for Plane Detection: Precision
~80 percent; recall ~75 percent; and F1 ~80 percent. We recommend that our products be used for applications
in conjunction with other data sources.
Key Factors
Our model will perform differently depending on key characteristics of the weather, imagery, and the planes
themselves. Performance will likely decrease in case of hazy or cloudy conditions. The size of planes will also
impact performance as typically, detection on planes smaller than 25m/7px long have lower quality and
shouldn’t be relied upon. In some cases, small bright white buildings can be mistaken for very small planes.
Representative Examples
AOI Key Factors Performance
Hartsfield–Jackson Atlanta - Good atmospheric
International Airport conditions
- Large planes
© Planet Labs Inc. 2020 14Planet Analytic Feeds | Performance Metrics April 2021
Beijing Capital International - Bad atmospheric
Airport conditions
- Large planes
Hartsfield–Jackson Atlanta - Good atmospheric
International Airport conditions
- Small planes and
large planes
© Planet Labs Inc. 2020 15Planet Analytic Feeds | Performance Metrics April 2021
WELL PAD DETECTION
Planet’s Well Pad Detection leverages an object detection computer vision model applied to Planet Basemaps.
Object detection is a computer vision approach that analyzes an image and generates a “bounding box” around
the relevant object.
The bounding boxes are recorded as vector data, which represent geographic coordinates for the object’s
location. This vector data is packaged in a FeatureCollection GeoJSON file format and is available for querying
through the Analytics API.
Feature extracted Well Pad
Defined as a square ground clearing within an oil basin
Model Type Object detection
Input Visual Basemaps Focused on the Permian Basin
Output GeoJSON Feature Collection
Refresh Monthly or Weekly
Delivery Analytics API
Scale Permian Basin, West Texas/New Mexico
PERFORMANCE
Overview
Planet’s Well Pad Detection targets the Permian Basin in West Texas and New Mexico, as this region has seen
high development in recent years. We have optimized this model for a higher recall than precision as we have
found it is more important to find all new well pads than to be sure each detection made is a true positive
detection. Our analysis over the Permian Basin leads to the following results: precision ~80 percent; recall ~95
percent; and F1 ~90 percent.
Key Factors
The model picks up certain types of buildings within cities as well pads fairly frequently. The model performs
best on new well pad development, picking up clean clearings. Fading well pads that have shrunk and dissolved
into the land around them are detected with less frequency.
© Planet Labs Inc. 2020 16Planet Analytic Feeds | Performance Metrics April 2021
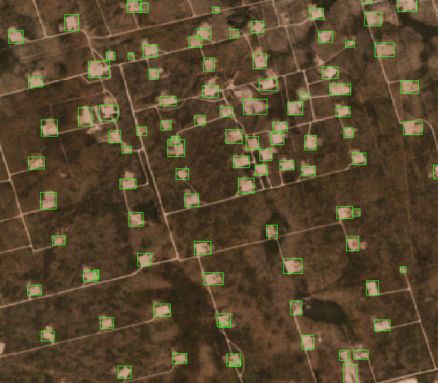
Representative Examples
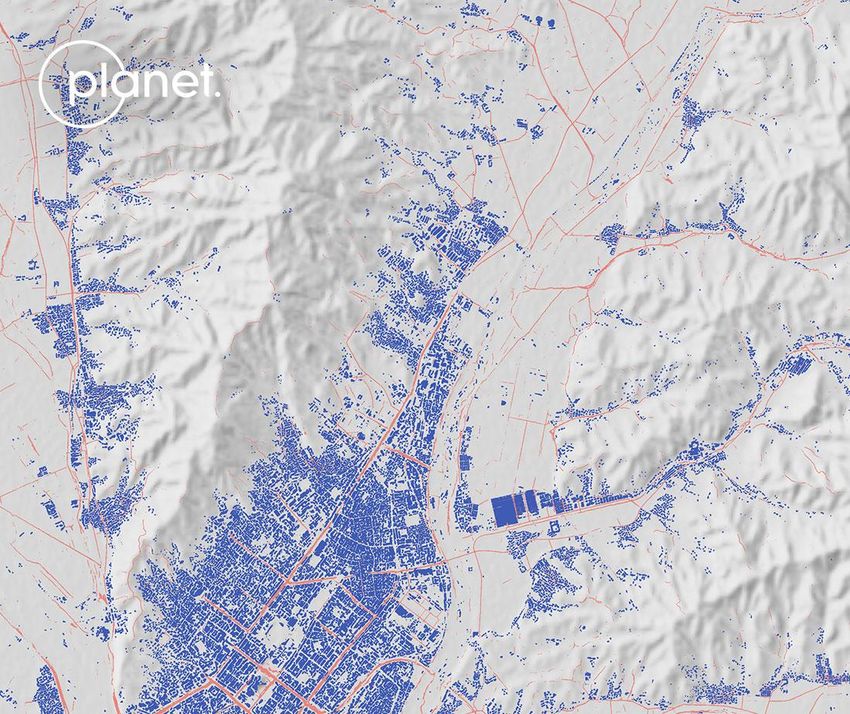
AOI Key Factors Performance
Permian Basin, USA - Clear well pads
- No building
- Rural area
Permian Basin, USA - Clear well pads
- Building
- Urban area
Permian basin, USA - Faint well pad
- No building
- Rural area
© Planet Labs Inc. 2020 17Planet Analytic Feeds | Performance Metrics April 2021
SILO BAG DETECTION
Planet’s Silo Bag Detection leverages an object detection computer vision model applied to Planet Basemaps
in Argentina. Object detection is a computer vision approach that analyzes an image and generates a
“bounding box” around the relevant object.
The bounding boxes are recorded as vector data, which represent geographic coordinates for the object’s
location. This vector data is packaged in a FeatureCollection GeoJSON file format and is available for querying
through the Analytics API.
Feature extracted Silo Bags
Defined as long white man-made objects designed to store grain or other crops
Model Type Object Detection
Input Visual basemaps
Output GeoJSON Feature Collection
Refresh Monthly
Delivery Analytics API
Scale Argentina
PERFORMANCE
Overview
Planet’s Silo Bag Detection has been trained in Argentina as silo bags have been prevalent in this country. We
can further extend the model to perform in these additional regions. Our analysis over Argentina leads to the
following results: precision ~80 percent; recall ~90 percent; and F1 ~85 percent.
Key Factors
The shape of silo bags makes it relatively straightforward for the model to have good detection performance.
Silo bags can resemble other features in our imagery, including some buildings and borders of structures, seen
below. There are also times where multiple silo bags will be detected within one detection, examples also
shown below.
© Planet Labs Inc. 2020 18Planet Analytic Feeds | Performance Metrics April 2021
Representative Examples
AOI Key Factors
- Example of silo bags off the side of farmland
- Edges of land features can resemble silo bags which can
cause false positives
Permian basin, USA - Multiple silo bags get detected within one detection
© Planet Labs Inc. 2020 19Planet Analytic Feeds | Performance Metrics April 2021
ROAD CHANGE DETECTION
Planet’s Road Change Detection leverages temporal de-noising techniques applied to our road rasters . Since
our road rasters are derived from our semantic segmentation models, which classify if a pixel belongs to either
the “road” or “not road” class, we polygonize the outputs such that we obtain grid cells representing where road
changes have occured.
The grid cells are recorded as vector data, which represent geographic coordinates for the location of the
change. This vector data is packaged in a FeatureCollection GeoJSON file format and is available for querying
through the Analytics API.
Feature extracted Road Change
Defined as any transition from land to a road (construction)
Model Type Semantic segmentation and temporal de-noising
Input Planet Global Basemap
Output GeoJSON Feature Collection
Refresh Monthly
Delivery Analytics API
PERFORMANCE
Overview
Planet’s models are generalized to work globally and have been tested and tuned extensively on specific AOIs
and object definitions. As the Earth is heterogeneous in both time and space, performance will vary
significantly depending on AOIs, object definitions and external factors. Metrics shown below may not be fully
representative of a specific AOI.
Due to a combination of factors, including atmospheric conditions and PlanetScope resolution, human
performance rarely exceeds 90 percent. Our analysis leads to the following results for Road Change Detection:
precision ~35 percent; recall ~35 percent; F1 ~35 percent; lag ~2.5 months. We recommend that our products be
used for applications in conjunction with other data sources.
© Planet Labs Inc. 2020 20Planet Analytic Feeds | Performance Metrics April 2021 Key Factors Our model will perform differently depending on key characteristics of the AOIs. Common false positives for detection of new roads include dirt roads, ephemeral streams, crop lines, dry creeks, roads with changing conditions such as foliage, snow or floods, and soil clearings. Common false negatives include new roads which are occluded or new roads that have low contrast. As a result, AOIs with a higher proportion of objects as listed above will see lower performance. Performance will also likely decrease in case of haze, clouds, or attenuated visibility due to bad atmospheric conditions, snow, land type or image blurring. Besides AOI characteristics, shadows from neighboring buildings in dense urban cores can affect road boundaries, significantly impacting performance. Typically, detection on smaller new roads (width < 10m/3px) will not be recognized. Our analysis on our own datasets leads to the following results for land type. © Planet Labs Inc. 2020 21
Planet Analytic Feeds | Performance Metrics                                                               April 2021

Representative Examples

 AOI                                          Key Factors

 Melbourne, Australia                           -   Examples of new roads correctly detected in the outskirts
                                                    of Melbourne

 Himalayas, Pakistan                            -   A dry creek incorrectly detected as a new road on a
                                                    rugged mountain terrain

 New Mexico, USA                                -   Fields line incorrectly detected as new roads on
                                                    agriculture terrain

 Texas, USA                                     -   Ephemeral streams with riparian vegetation incorrectly
                                                    detected as new roads on soil and vegetation terrain

© Planet Labs Inc. 2020                                                                                          22
Planet Analytic Feeds | Performance Metrics April 2021
BUILDING CHANGE DETECTION
Planet’s Building Change Detection leverages temporal de-noising techniques applied to our building rasters .
Since our building rasters are derived from our semantic segmentation models, which classify if a pixel belongs
to either the “building” or “not building” class, we polygonize the outputs such that we obtain grid cells
representing where building changes have occured.
The grid cells are recorded as vector data, which represent geographic coordinates for the location of the
change. This vector data is packaged in a FeatureCollection GeoJSON file format and is available for querying
through the Analytics API.
Feature extracted Buildings
Defined as any transition from land to a building (construction)
Model Type Semantic segmentation and temporal de-noising
Input Planet Global Basemap
Output GeoJSON Feature Collection
Refresh Monthly
Delivery Analytics API
PERFORMANCE
Overview
Planet’s models are generalized to work globally and have been tested and tuned extensively on specific AOIs
and object definitions. As the Earth is heterogeneous in both time and space, performance will vary
significantly depending on AOIs, object definitions and external factors. Metrics shown below may not be fully
representative of a specific AOI.
Due to a combination of factors, including atmospheric conditions and PlanetScope resolution, human
performance rarely exceeds 90 percent. Our analysis leads to the following results for Building Change
Detection: precision ~45 percent; recall ~40 percent; F1 ~45 percent; lag ~2 months. We recommend that our
products be used for applications in conjunction with other data sources.
.
© Planet Labs Inc. 2020 23Planet Analytic Feeds | Performance Metrics April 2021 Key Factors Our model will perform differently depending on key characteristics of the AOIs. Common false positives for detection of new buildings include mines, quarries, shipping containers, parking lots, existing buildings in varying shadows from other buildings, new wide cement structures, highly changing fields and agriculture structures, dynamic changes such as planes and docked ships, well pads and paved areas in dense urban cores. Common false negatives include new buildings which are occluded by other buildings or new buildings that are in very close proximity to other buildings. As a result, AOIs with a higher proportion of objects as listed above will see lower performance. Performance will also likely decrease in case of haze, clouds, or attenuated visibility due to bad atmospheric conditions, snow, land type or image blurring. Besides AOI characteristics, shadows from neighboring buildings in dense urban cores can significantly impact performance. Typically, detection on new buildings smaller than 20m/6px will not be recognized. Our analysis on our own datasets leads to the following results for land type. © Planet Labs Inc. 2020 24
Planet Analytic Feeds | Performance Metrics April 2021
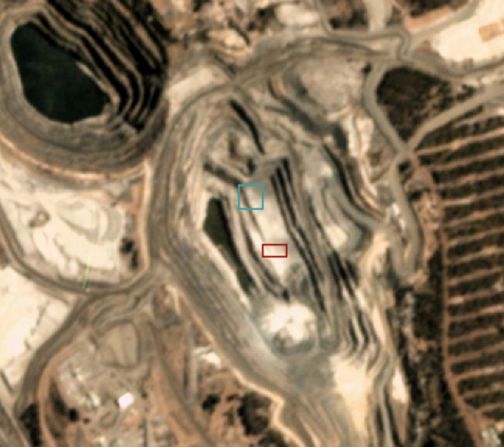
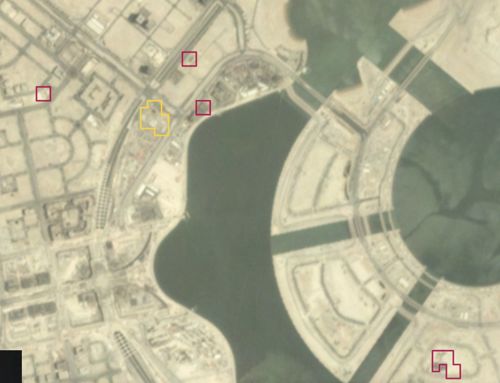
Representative Examples
AOI Key Factors
Doha, East Qatar - Examples of new buildings correctly detected in the
harbor near Lusail
Bridgetown, Australia - A mine / quarry incorrectly detected as a new building,
due to shadows similarity to buildings
New Mexico, USA - Well Pads incorrectly detected as new buildings on
agriculture terrain
© Planet Labs Inc. 2020 25Planet Analytic Feeds | Performance Metrics April 2021
Doha, Qatar - A docked ship incorrectly detected as a new building due
to proximity to the pier and shadows similarity to
buildings
Shanghai, China - A shadow incorrectly detected as a new building to to
changing shadows from tall buildings
Houston, USA - Parking lots and changing cars incorrectly detected as
new buildings
© Planet Labs Inc. 2020 26Planet Analytic Feeds | Performance Metrics April 2021
PERFORMANCE METRICS METHODOLOGY
Planet Analytic Feeds leverages computer vision to transform our imagery into information feeds
that detect and classify objects, identify geographic features, and understand change over time
across the globe. To optimize our models, we use different methodologies by setting performance
metrics which best represent our objectives.
Model Type Metric Type
Object Detection Precision, recall, F1 with minimum IoU on bounding boxes
Semantic Segmentation Precision, recall, F1 on pixel classification
Semantic segmentation and temporal Precision, recall, F1, mean temporal lag on pixel classification
de-noising
Metric Definition Formula
Precision Precision is a good measure of
usefulness. There is a heavy cost if
the number of False Positives is
high; e.g, for ship detection,
Precision would be at 25% if one
out of every 4 ships we detected
was actually a ship.
Recall Recall is a good measure of
completeness. There is a heavy
cost if the number of False
Negatives is high; e.g, for ship
detection, Pecall would be at 25% if
we only detected one out of every
4 actual ships.
F1 F1 Score is a metric balance
between usefulness and
completeness. It takes both
Precision and Recall into account
and is a balance between both
metrics.
© Planet Labs Inc. 2020 27Planet Analytic Feeds | Performance Metrics April 2021 Object detection Objects are typically represented as bounding boxes that can have any size and position. The model outputs box predictions along with confidence scores for each. The confidence score is a number between 0 and 1. To compute metrics, we find 1-to-1 matches between predictions and ground truth boxes. For each possible pair of truth and prediction boxes, we calculate the intersection divided by the union (IOU) of their areas. We set minimum IOU and confidence thresholds, and discard all prediction/truth pairs below them. Then, we match the highest confidence prediction to the truth box it shares the largest IOU with. © Planet Labs Inc. 2020 28
Planet Analytic Feeds | Performance Metrics                                                April 2021

Based on these matches, and given the minimum IOU and confidence thresholds, we calculate
precision, recall and F1 metrics.

Semantic segmentation

Each pixel is assigned one class among a set of classes. Thus, truth and prediction datasets are
compared per-pixel and all the instances and matches of the foreground class are counted. These
counts are then used to compute precision, recall and F1 metrics.

© Planet Labs Inc. 2020                                                                            29
Planet Analytic Feeds | Performance Metrics                                                               April 2021

Change detection

Similar to semantic segmentation, these binary classification metrics are based on class matches
between pixels in ground truth and prediction datasets. Here, the classes are simply change or
no-change. In addition, the time axis is treated in a special manner, whereby change predictions are
allowed to have a temporal lag with respect to the ground truth at a given spatial location. This lag
is averaged over all matches in the dataset and represents a fundamental metric, along with
precision, recall and F1. Thus, these metrics tell us how good the model is in mapping change and
how long it takes to detect it.

The lag corresponds to the delay between the time period of the change event and the time period
the detection is published. Our performance metrics include the average lag over all pixels in our
ground truth dataset.

GET IN TOUCH

                                              Learn More
   We're Here to Help                                                          Contact Us
                                              Watch Planet Analytic Feeds
   Please reach out with any questions        in action                        Let us help you turn data into
   regarding Planet Analytic Feeds to         https://learn.planet.com/road-   actionable insights.
   support@planet.com                         building-change-detection-w      go.planet.com/getintouch
                                              ebinar

© Planet Labs Inc. 2020                                                                                          30
You can also read