Estimation of exponential growth rate and basic reproduction number of the coronavirus disease 2019 (COVID-19) in Africa - Research Square
←
→
Page content transcription
If your browser does not render page correctly, please read the page content below
Preprint: Please note that this article has not completed peer review.

Estimation of exponential growth rate
and basic reproduction number of the
coronavirus disease 2019 (COVID-19) in Africa
CURRENT STATUS:                    UNDER REVIEW

Salihu S Musa
Hong Kong Polytechnic University

Shi Zhao
Chinese University of Hong Kong

Maggie H Wang
Chinese University of Hong Kong

Abdurrazaq G Habib
Bayero University

Umar T Mustapha
Federal University Dutse

Daihai He
Hong Kong Polytechnic University

 daihai.he@polyu.edu.hkCorresponding Author
ORCiD: https://orcid.org/0000-0003-3253-654X

  10.21203/rs.3.rs-19916/v2
SUBJECT AREAS
 Infectious Diseases
KEYWORDS
 COVID-19; reproduction number; pandemic; statistical modelling.

                                                   1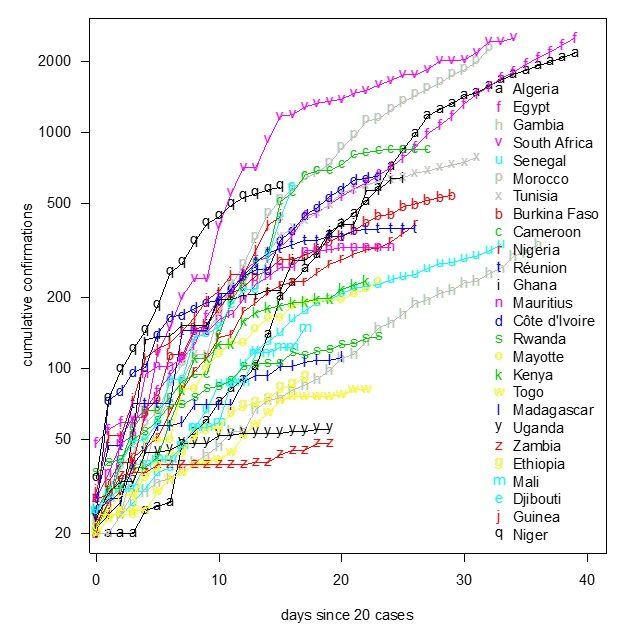
Abstract
Background Since the first case of coronavirus disease 2019 (COVID-19) was detected on February

14, 2020, the cumulative confirmations reached 15207 including 831 deaths by April 13, 2020.

Methods We analyzed the initial phase of the epidemic of COVID-19 in Africa between 1 March and

13 April 2020, by using the simple exponential growth model.

Results We estimated the exponential growth rate as 0.22 per day (95%CI: 0.20 – 0.24), and the

basic reproduction number, R0, to be 2.37 (95%CI: 2.22-2.51) based on the assumption that the

exponential growth starting from 1 March 2020.

Conclusion The initial growth of COVID-19 cases in Africa was rapid and showed large variations

across countries. Our estimates should be useful in preparedness planning.

Trial registration: NA

Introduction
Since the end of 2019, an outbreak of coronavirus disease 2019 (COVID-19), now a pandemic (2020

(World Health Organization, 2020b; Gilbert, 2020), caused by the severe acute respiratory syndrome

coronavirus 2 (SARS-CoV-2) (World Health Organization, 2020a) has hit China severely, in particular,

the epicenter, Wuhan, the capital city of Hubei province. The city has been locked down since January

23, 2020 and the lockdown has been lifted on April 8, 2020. As of the March 23, the epicenter has

moved to Europe and US, after the outbreak was largely controlled in China. Many countries are

facing a rapid increasing trend of confirmed cases. The case-fatality-rate varies wildly from country to

country. As of 13 April 2020, about 2 million people have been infected with COVID-19 with over

117,000 death globally (out of which about 90% of the death cases were from United State and

Europe) (World Health Organization, 2020a; World Health Organization, 2020c).

Africa reported its first case of COVID-19 in Egypt on 14 February 2020 (Gilbert, 2020; World Health

Organization, 2020c).

As of 13 April 2020, a total of 15207 infected cases were reported, with 831 fatal cases, giving an

overall case fatality rate (CFR) of 5.47% throughout Africa, among them only 3 cases with no death

reported in February 2020 (World Health Organization, 2020c).

                                                   2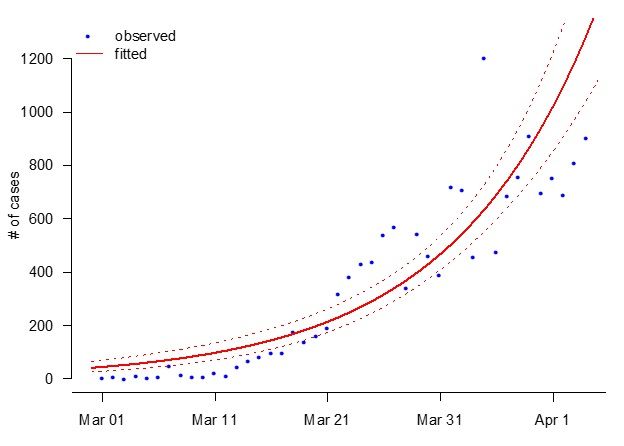
The African region has been described as one of the most vulnerable with the COVID-19 infection

(Gilbert, 2020) in the initial phase, due to the fact that Africa is important commercial partner of

China and as a result, large volume of business person travel to the region. Since the epicenter is now

in Europe, due to the close tie between Africa and European countries, African countries face even

bigger threat.

Several control measures have currently been taken by most of the African countries to

prevent/reduce the spread of COVID-19, especially against case importation from the COVID-19

epicenters. Some of the measures includes travel ban to and from the most COVID-19 hit countries,

school closures, temporary ban of religious gathering and so on (Gilbert, 2020; World Health

Organization, 2020d; Nigeria Center for Disease Control, 2020). Nevertheless, the ability to curtail or

reduce and control the local transmission after case importation depends largely with how African

government are seriously sustaining the current recommended measures. Due to the fragile health

care system, insufficient health workers, lack of water, and sanitizers for maintaining hygiene in the

region. African countries need to find their optimal strategies to stop the spread of COVID-19 in its

region.

Numerous epidemiological studies have been conducted to understand the transmission dynamics of

COVID-19, which is quantified in two key parameters, the basic reproduction number (the expected

number of secondary cases that may be caused by a typical primary case during his/her infectious

period in a wholly susceptible population, R0) and the serial interval (time delay between the

symptom onset of a primary case and his/her secondary case, SI). High reproductive number and

short serial interval imply rapid growth. In the initial phase, the epidemic (number of new cases over

time) typically exhibited exponential growth. The basic reproduction number is a function of the

exponential growth rate (r) and the serial interval. Studies on the basic reproduction number,

exponential growth rate and serial interval (Zhao et al., 2020a; Ma, 2020; Nishiura et al., 2020; Du et

al, 2020; and Zhao et al., 2020b), many of which have shown the R0 ranges from 2.0 to 4.0, and initial

under-reporting/under-detection during the early phases of the outbreak in Wuhan, China.

                                                    3
The aim of this study is to estimate the exponential growth rate and the basic reproduction number
the COVID-19 pandemic in Africa at the early stage, which should be valuable in informing the official
and public in the preparedness against COVID-19 spread, forecasting the trend, and highlighting the
importance of sustaining strict measures in order to curtail the spread.
Methods
We obtained the daily number of COVID-19 cases time series data in Africa from World Health
Organization (WHO) from 1 March to 19 March 2020
(https://www.who.int/emergencies/diseases/novel-coronavirus-2019/situation-reports/). Although
there were 3 confirmed cases throughout Africa from 14 February to 29 February 2020, we did not
include them as there were no additional case reported until 1 March 2020. In this work, we
considered the situation from 1 March 2020 as the number of cases and death started a steady
increasing trend.
Referring to recent studies (Zhao et al., 2020a; Ma, 2020), we model the epidemic curve by
employing the exponential growth proposed by Ma et al. (Ma, 2020). The Poisson likelihood
framework is adopted for data fitting and parameter estimation. The intrinsic growth rate ( ) was
estimated, and the basic reproduction number R0 computed via with 100% susceptibility for COVID-
19 presumed (Wallinga and Lipsitch, 2007). The function represents the Laplace transform and the
moment generating function of the probability distribution, for the generation interval (GI, the time
between the timing of infections of two successive cases) of the COVID-19 (Zhao et al., 2020a; Ma,
2020, Wallinga and Lipsitch, 2007). Note that since GI is not observable, we follow conventional
approach to use serial interval (timing between symptom onset of two successive cases) as a proxy of
GI. Since the transmission chain of COVID-19 in Africa is yet to be fully uncovered, we adopted the SI
estimated in Zhao et al. (2020c). We modelled the distribution of COVID-19 GI as Gamma distributions
with a mean of 4.7 days and standard deviation (SD) of 2.9 days previously estimated by Zhao et al.
(2020b).
Additionally, we quantified the instantaneous transmissibility of the outbreak by the time-varying
effective reproductive number. We adopted previous study by Zhao et al. (2020c) to estimate the
4effective reproductive number following the SI technic. By employing the renewal equation methods
as described by Zhao et al. (2020c), we showed the effective reproductive number of some African
countries with reported data for at least 20 days after exceeding 20 cumulative cases in order to
show the potential of COVID-19 to spread across the region.
Results And Discussion
The exponential growth fitting results are depicted in Figure 1. The fitting results matched the
observed daily number of cases, which implies that the early outbreak data in Africa were largely
following the exponential growth rate estimated at 0.22 per day (95%CI: 0.20 – 0.24), which is slightly
larger than previous estimates (Zhao et al., 2020a; Nishiura et al., 2020; Li et al., 2020 ). Our
analysis and estimation of R0 rely on the accuracy of the SI of COVID-19 estimated previously based
on cases from Hong Kong by Zhao et al. (2020b).We estimated the basic reproduction number R0 to
be 2.37 (95%CI: 2.22 – 2.51), which is also depending on the estimates of the SI during the early
epidemics. Our basic reproduction numb R0 estimates is significantly larger than 1 and broadly
consistent with recent studies (Zhao et al., 2020a; World Health Organization, 2020e; Li et al., 2020;
Wu et al., 2020; Zhao et al., 2020d; Li et al., 2020b; Riou and Althaus, 2020). We suggested that the
current COVID-19 outbreaks in Africa could increase rapidly if the measures were not strictly
sustaining, which includes temporary bans of international travels, religious gathering, avoid social
distancing and so on.
We reported that the mean R0 of COVID-19 in Africa is likely to be 2.37 which could vary from 2.22 to
2.51 and is consistent with the previous estimates, (World Health Organization, 2020e, Zhao et al.,
2020a; Imai et al., 2020; Read et al., 2020).
Denote the infection attack rate (final size of infected) as z, then z=1-exp(-R0z), one may solve z
given R0 (Ma and Earn 2006) showed this equation is true when the homogeneous mixing assumption
holds.
Brauer (2019) showed that the actual infection attack rate could be low due to public behavior change
and heterogeneity in mixing, for instance in the Ebola outbreak, the actual infection attack rate was
5much smaller than the theoretical estimates in ideal situation. With an R0 at 2.37, the theoretical
infection attack rate will be as large as 87%, namely 87% of Africa will be infected. However, we need
to point out that the classical final size overestimated the infection attack rate in the influenza
pandemic 1918 and influenza pandemic 2009. These two influenza pandemics had R0 around 2 and
1.5, respectively. The observed infection attack rate was round 20% in England and Wales and 10% in
Hong Kong. Theoretically, the infection attack rate could be 80% and 58%, respectively. The case-
fatality-rate (CFR) of 1918 was around 2% (Paulo, 2010), and thus the situation of panic and
governmental action was similar to COVID-19 pandemic. While the CFR of 2009 influenza pandemic
was relatively low, there was virtually little-scale or insufficient control. For these two examples, the
expected infection attack rate could be close to the 1918, namely 25%. Thus, we need to be prepared
and strict action needs to be taken.
In Figure 2, we examined the publicly available materials published by the WHO (WHO, 2020a) to
show the potential of COVID-19 to spread without sustaining strict health measures. We observed the
daily confirmations of the COVID-19 cases in 19 African countries that reported data for at least 20
days after exceeding 20 cumulative cases. Thus, we fitted the cumulative confirmations of 19 African
countries starting from the date when cumulative exceeded 20. In Figure 3, we showed the changing
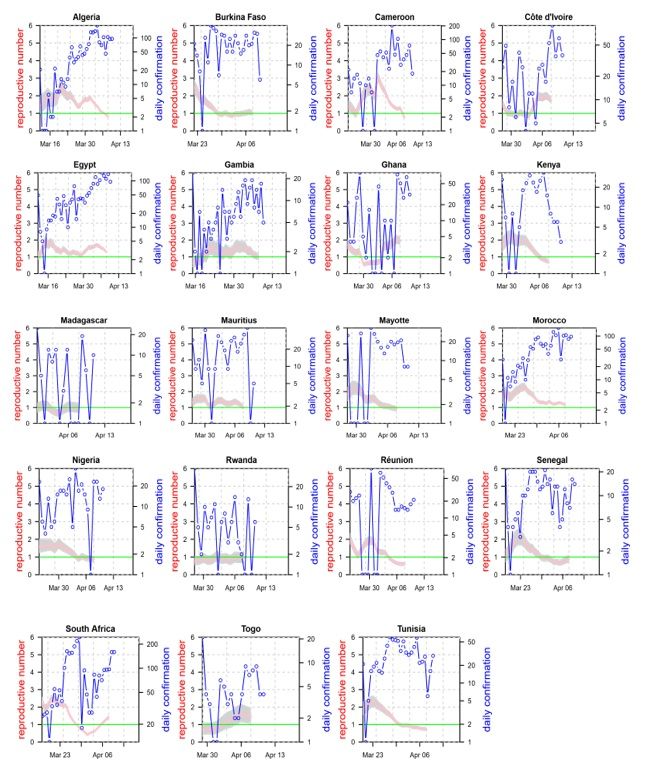
patterns of reproductive number (R) based on the daily confirmations of COVID-19 cases time series
in Africa. We used the R package EpiEstim (Cori et al 2013) to calculate the instantaneous effective
reproductive number of 19 African countries in order to show the potential of COVID-19 to spread
across the region. After an initial rapid growth in COVID-19 confirmed cases driven by imported cases
in the whole Africa, the reported cases showed steady pattern (with decreased reproductive number)
in many Africa countries which could be due to limited testing.
We suggested that the likely factors responsible for the rapid increase in the number of confirmed
cases in these countries is presumably linked with proportion of population in Africa doing
international trade with foreign countries (e.g., China, Germany, Italy and US), also the level of
vulnerability of African countries as described by Gilbert et al. (2020), i.e., countries with the highest
6importation risk (such as Egypt, Algeria, and South Africa) followed by countries at moderate risk
(such as Nigeria, Ethiopia, Sudan, Angola, Tanzania, Ghana, and Kenya) and then others. This further
shows that Africa is one of the highest vulnerable region for the COVID-19 pandemic, indicating that
there is a need of taking more serious control measures based on the recommendation of WHO and
other heath related bodies to curtail the spread of COVID-19 in Africa.
Conclusion
We estimated the exponential growth rate as 0.22 per day (95%CI: 0.20 – 0.24). We estimated that
the mean R0 of COVID-19 in Africa to be 2.37 (95%CI: 2.22 – 2.51) with a constant testing effort
assumed. We highlighted the importance of sustaining strict health measures in order to contain the
virus within a shortest possible time.
Declaration
Ethical Approval and Consent to participate
Not applicable. All data used are from public domain.
Consent for publication
Not applicable. All data used are from public domain
Availability of data and materials
All data used are from public domain
Competing interests
DH was supported by an Alibaba (China) - Hong Kong Polytechnic University Collaborative Research
project. Other authors declare no conflict of interest.
Funding
DH was supported by General Research Fund (Grant Number 15205119) of the Research Grants
Council (RGC) of Hong Kong, China and Alibaba (China) Co., Ltd. Hong Kong Polytechnic University
Collaborative Research project (P0031768).
Authors' contributions
MSS and SZ conceived the project. MSS, SZ and DH conducted the research and wrote the draft.
MHW. AGH and UTM critically revised the manuscript, and all authors approved the submission.
7Acknowledgements
No
Authors' information
Salihu S Musa & Daihai He: Department of Applied Mathematics, Hong Kong Polytechnic University,
Hong Kong, China
Salihu S Musa: Department of Mathematics, Kano University of Science and Technology, Wudil,
Nigeria
Shi Zhao & Maggie H Wang: JC School of Public Health and Primary Care, Chinese University of Hong
Kong, Hong Kong, China and Shenzhen Research Institute of Chinese University of Hong Kong,
Shenzhen, China
Abdurrazaq G Habib: Collage of Health Sciences, Bayero Unuversity, Kano, Nigeria
Umar T Mustapha: Department of Mathematics, Federal University Dutse, Jigawa, Nigeria
References
1. Coronavirus disease (COVID-19) pandemic. World Health Organization
(WHO). 2020a. https://www.who.int/emergencies/diseases/novel-coronavirus-2019.
[Assessed Apr, 2020].
2. WHO director-general’s remarks at the media briefing on COVID-19 – 11
March 2020. World Health Organization (WHO). 2020b.
https://www.who.int/dg/speeches/detail/who-director-general-s-opening-remarks-at-
the-media-briefing-on-covid-19---11-march-2020.
3. Gilbert M, Pullano G, Pinotti F, Valdano E, Poletto C, et al. Preparedness and
vulnerability of African countries against importations of COVID-19: a
modelling study. Lancet 2020, 395: 871-77. https://doi.org/10.1016/S0140-
6736(20)30411-6.
4. Coronavirus disease (COVID-19) situation reports, World Health Organization
(WHO). 2020c. https://www.who.int/emergencies/diseases/novel-coronavirus-
82019/situation-reports/. [Assessed Mar, 2020].
5. Regional Office for Africa. WHO ramps up preparedness for novel
coronavirus in the African region. World Health Organization (WHO). 2020d.
https://www.afro.who.int/news/who-ramps-preparedness-novel-oronavirus-
africanregion. [Accessed Feb 1, 2020].
6. Coronavirus disease (COVID-19) situation reports, Nigeria Center for Disease
Control (NCDC). 2020. https://ncdc.gov.ng/. [Assessed Mar, 2020].
7. Zhao S, Lin Q, Ran J, Musa SS, Yan G, Wang W, et al. Preliminary estimation of the
basic reproduction number of novel coronavirus (2019-nCoV) in China, from
2019 to 2020: A data-driven analysis in the early phase of the outbreak.
International Journal of Infectious Disease, 2020a, 92: 214-217.
https://doi.org/10.1016/j.ijid.2020.01.050.
8. Ma J., Estimating epidemic exponential growth rate and basic reproduction
number. Infectious Disease Modeling, 2020, 5: 129-141.
https://doi.org/10.1016/j.idm.2019.12.009.
9. Nishiura H, Linton NM, Akhmetzhanov AR, Serial interval of novel coronavirus
(COVID-19) infections. International Journal of Infectious Disease,
https://doi.org/10.1016/j.ijid.2020.02.060.
10. Du Z, Xu X, Wu Y, Wang L, Cowling BJ, et al. The serial interval of COVID-19 from
publicly reported confirmed cases. medRxiv, 2020.
https://doi.org/10.1101/2020.02.19.20025452.
11. Zhao S, Gao D, Wu Y, Zuang Z, Chong M, et al. Estimating the serial interval of
novel coronavirus disease (COVID-19): A statistical analysis using the public
data in Hong Kong from January 16 to February 15, 2020. medRxiv, 2020b.
https://doi.org/10.1101/2020.02.21.20026559.\
912. Laboratory testing for 2019 novel coronavirus (COVID-19) in suspected
human cases, World Health Organization (WHO). 2020e.
https://www.who.int/health-topics/coronavirus/laboratory-diagnostics-fornovel-
coronavirus.
13. Imai N, Dorigatti I, Cori A, Riley S, Ferguson NM. Estimating the potential total
number of novel Coronavirus (2019-nCoV) cases in Wuhan City. China:
Preprint published by the Imperial College London; 2020.
https://www.imperial.ac.uk/mrc-global-infectious-disease-analysis/news–wuhan-
coronavirus/.
14. Read JM, Bridgen JR, Cummings DA, Ho A, Jewell CP. Novel coronavirus 2019-nCoV:
early estimation of epidemiological parameters and epidemic predictions.
medRxiv, 2020; 2020.2001.2023.20018549.
15. Wallinga J, Lipsitch M. How generation intervals shape the relationship
between growth rates and reproductive numbers. Proceeding of the Royal
Society B: Biological Science 2007, 274(1609):599–604.
16. Zhao S, Lefei L, He D, Qin J. Public awareness, news promptness and the
measles outbreak in Hong Kong from March to April, 2019. Infectious Diseases,
2020c, 0(0): 1-7. https://doi.org/10.1080/23744235.2020.1717598.
17. Li Q, Guan X, Wu P, Wang X, Zhou L, et al. Early transmission dynamics in
Wuhan, China, of novel coronavirus-infected pneumonia. The New England
Journal of Medicine, 2020a. https://doi.org/10. 1056/NEJMoa2001316.
18. Wu JT, Leung K, Leung GM. Nowcasting and forecasting the potential domestic
and international spread of the 2019-nCoV outbreak originating in Wuhan,
China: a modelling study. Lancet, 2020. https://doi.org/10.1016/S0140-
6736(20)30260-9.
1019. Zhao S, Musa SS, Lin Q, Ran J, Yang G, Wang W, et al. Estimating the unreported
number of novel coronavirus (2019-nCoV) cases in China in the first half of
January 2020: a data driven modelling analysis of the early outbreak. Journal
of Clinical Medicine, 2020d, 9:388. https://doi:10.3390/jcm9020388.
20. Riou J, Althaus CL. Pattern of early human-to-human transmission of Wuhan
2019 novel coronavirus (2019-nCoV), December 2019 to January 2020.
Eurosurveillance, 2020, 25(4). https://doi.org/10.2807/1560-
7917.ES.2020.25.4.2000058.
21. Paulo AC, Correia-Neves M, Domingos T, Murta, AG, Pedrosa J. Influenza Infectious
Dose May Explain the High Mortality of the Second and Third Wave of 1918–
1919 Influenza Pandemic. PLoS ONE, 2010, 5(7): e11655.
https://doi.org/10.1371/journal.pone.0011655.
22. Coronavirus disease (COVID-19) situation reports, Nigeria Center for Disease
Control (NCDC). 2020. \url{ https://ncdc.gov.ng/}. [Assessed Mar 2020].
23. Cori A, Ferguson NM, Fraser C, & Cauchemez S.. A new framework and software
to estimate time-varying reproduction numbers during epidemics. American
journal of epidemiology, 2013, 178(9), 1505-1512.
24. Brauer F. The final size of a serious epidemic. Bulletin of mathematical
biology, 2019, 81(3), 869-877.
25. Ma J., & Earn D J. Generality of the final size formula for an epidemic of a
newly invading infectious disease. Bulletin of mathematical biology, 2006, 68(3),
679-702.
Figures
11Figure 1
The observed (dots) and fitted (curves) daily number of COVID-19 cases time series in
Africa. The blue dots are observations, and the curves are fitting results. The red bold curve
represents the mean fitting result, and the red dashed curves are the 95% confidence
intervals. Multiple R-squared: 0.756.
12Figure 2
The reported cumulative confirmations of COVID-19 in 19 African countries exceeding 20
cases. The x axis shows the days since the cumulative exceeded 20 in a country.
13Figure 3
The reported cases (blue cicle line) and reproductive number (the three solid lines are the
median and 95% CI) based on the daily confirmations of COVID-19 cases time series in 19
African countries.
1415
You can also read