INFLUENCE OF MULTILAYER INTERLOCKED FABRICS STRUCTURE ON THEIR THERMAL PERFORMANCE
←
→
Page content transcription
If your browser does not render page correctly, please read the page content below
AUTEX Research Journal, DOI 10.2478/aut-2021-0038

   INFLUENCE OF MULTILAYER INTERLOCKED FABRICS STRUCTURE ON THEIR
                        THERMAL PERFORMANCE
                                    Ferran Parés, Heura Ventura, F. Xavier Capdevila, Mònica Ardanuy*

                   INTEXTER, Universitat Politècnica de Catalunya–Barcelona TECH, C/Colom 11, E-08222 Terrassa (Barcelona), Spain
                                                *Corresponding author. E-mail: monica.ardanuy@upc.edu

Abstract:

        This paper examines the influence of weaving variables such as yarn count, number of layers, warp and weft ratio,
        materials of the top layer, weft density and interlocking cell shape, and size on the thermal performance of multilayer
        interlocked woven fabrics. A split-plot design was used to construct a total of 64 fabric structures, which were
        assessed for thermal performance in terms of resistance to convective, conductive, and radiative heat. It was found
        that, for equal weft density and yarn number, protective performance improved with the number of fabric layers and
        with the presence of air cells between these layers, especially if air was not trapped within and could rather pass
        freely between the cells. An optimal combination of factors for the thermal response to the three types of heat was
        established via a Derringer–a much needed desirability function. The results of this paper are useful for identifying
        the interaction between configuration parameters and thermal performance, and hence for the design of improved
        heat protective clothing.

Keywords:

        multilayer interlocked fabrics, thermal protective performance, aramid, viscose FR

1. Introduction                                                                        of layers in the fabric, the way they are interlocked, or the
                                                                                       distribution of fibers within these layers, among others.
The development of fire and heat protection fabrics is a field
of immense interest for obvious reasons of personal safety.                            The response of fabrics of variable composition to convective,
Nowadays, a significant number of heat protective fabrics are                          radiative, and conductive heat has been the subject of much
commercially available, ranging from single-layer materials                            research [9–13]. Most studies in this context have focused on
consisting of fireproofed cotton or cellulose-based fibers, to                         the thermal behavior of single-layer or assembled multilayer
multilayer materials containing aramids and other thermo-                              fabrics [9–15]. Nonetheless, the influence of the weaving-
resistant fibers developed for increased protection. However, in                       process parameters has been less widely assessed. In many
many applications for personal protection, these heat protective                       cases, these studies remain limited to the experimental
fabrics must also possess acceptable mechanical and comfort-                           work carried out by the factories that manufacture and/or
related properties in addition to a high thermal resistance.                           commercialize such fabrics; and, to the present authors’ best
                                                                                       knowledge, no study has yet been carried out regarding the
An example is firefighter clothing, which is intended to be                            influence of weaving parameters on multilayer interlocked heat
routinely exposed to fire and heat. Firefighters cannot work                           protective fabrics.
efficiently if they feel uncomfortable with their clothing [1]. The
assembly should provide excellent heat protection as well as                           Multilayer interlocked woven fabrics constitute a class of 3D
moisture comfort, thus should allow easy sweating-control.                             textile structures manufactured by interlocking fabric layers at
Due to this, existing firefighter clothing is typically a three-                       the weaving stage. Multilayer fabrics provide the advantage
layer assembly consisting of an outer flame-resistant fabric, an                       of performing cost-effective manufacturing—that is easier
interlayer moisture barrier, and an inner thermal liner.                               handling—together with control over binding point density
                                                                                       based on weave variations [16]. Furthermore, multilayer
In the framework of fire and heat personal protection, fabrics                         interlocked woven fabrics can also be constructed with different
have been extensively studied from different perspectives,                             interlocking patterns in order to create air cells inside the fabrics
including the heat transmission process, fiber properties, and                         and thereby further increase the heat protection.
surface treatments. The influence of fabric configuration and
garment manufacture has been investigated extensively [2–8].                           In the present work, we report on the design of multilayer
The effectiveness of the heat protection offered by this kind of                       interlocked fabrics consisting of various layers assembled by
fabrics depends especially on fiber composition, but also on a                         the same weaving process. Our primary aim was to examine
number of factors, such as yarn count and density, the number                          the influence of construction parameters on the heat protective

               © 2021 by the authors. This article is an open access article distributed under the terms and conditions of the Creative Commons Attribution (CC BY) license
               (http://creativecommons.org/licenses/by/4.0/).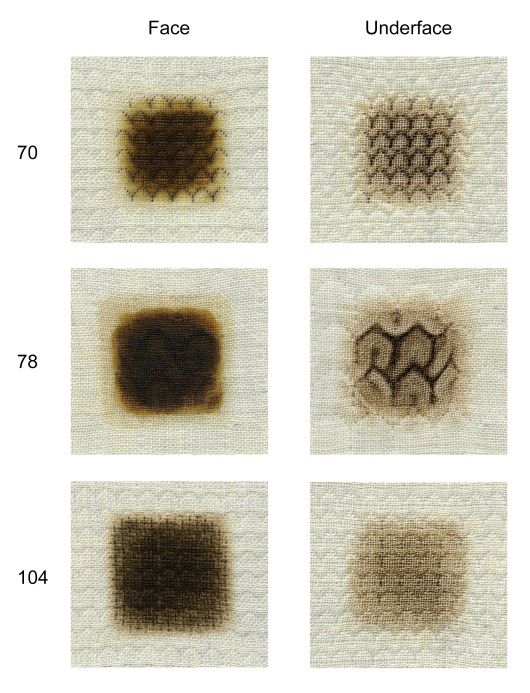
AUTEX Research Journal, DOI 10.2478/aut-2021-0038
efficiency of these fabrics, with the objective of identifying the Two different warp ratios were used—namely: 1:1 (AR and
interactions between the different parameters and thereby CV-AR) and 2:1 (AR, AR, and CV-AR)— to prepare the warp
improve the design of these woven fabrics. Therefore, besides beam. Therefore, four warp beams were prepared with the
the yarn composition and yarn count, several weaving factors combination of the different yarn counts and warp ratios. Each
were included in the analysis: the number of layers, warp and warp beam was used to weave different fabrics of variable
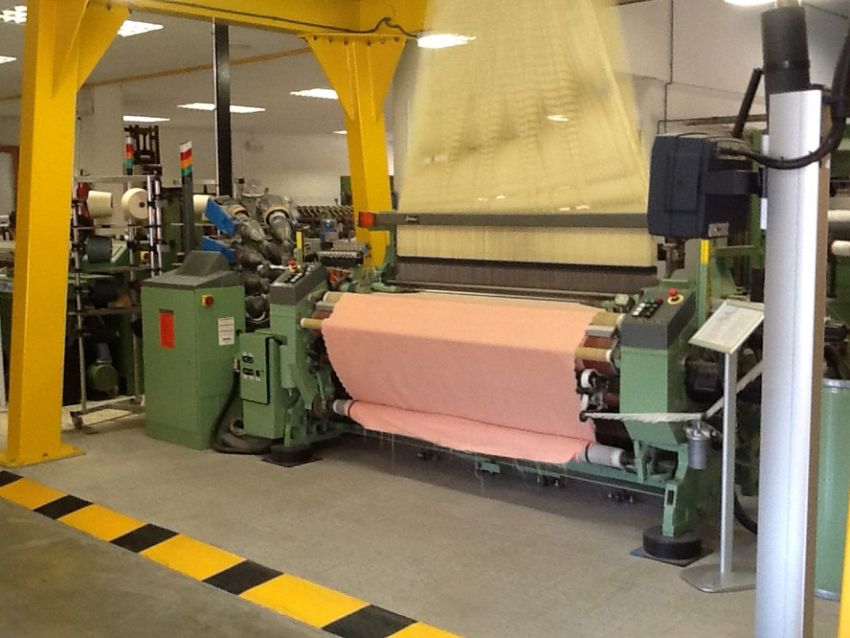
weft ratio, materials of the top layer, weft density, and both the parameters on a on a Dornier LWV8/J 190 loom (Figure 1),
interlocking cell shape and size. These factors were selected available in the weaving workshop of the Textile Engineering
taking into account the processability of the fabrics on the loom, division (Materials Science and Engineering Department) of the
as well as to ensure a sufficiently wide range of samples for Universitat Politècnica de Catalunya (UPC). The loom —which
analysis. For availability reasons, the two yarn metric numbers is equipped with a Jacquard Stäubli LX 1600B 6480-thread
and the two yarn distributions (warp ratio) on the warp beam electronic machine— was operated at 650 picks/cm, with
were fixed by the materials provider. its 170 cm-wide reed count of 10 dents/cm threaded in with
4 yarns/dent.
A split-plot design was used to construct a total of 64 fabric
structures that were assessed for thermal resistance against The weaving parameters were set to obtain two-layer and four-
convective, conductive, and radiative heat. layer interlock plain-woven fabrics, half of them with a single
material face —only AR yarns on the top layer— half of them
with two materials on the top layer —alternating AR and CV-
2. Experimental AR yarns— (see Table 1). The weft densities were of 28 or 40
picks/cm.
2.1. Materials and methods
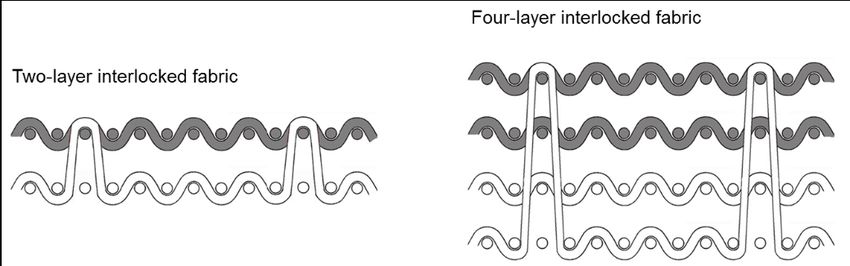
Layers were interlocked via Y-shaped or square-shaped cells
Among the most common materials used for thermal protective of two different sizes: 0.8 cm and 1.6 cm (Figure 2), but in all
fabrics, the highest levels of protection are offered by m-aramids, cases the interlocking was achieved between the top and the
followed by mixtures thereof with viscose Flame retardant bottom layers, as schematized in Figure 3.
(FR), modacrylic fibers, and finally treated cottons. Although
m-aramids confer the highest levels of protection and meet The fabrics obtained were assessed for resistance to convective,
most of the demands of the industry, the best comfort levels are conductive (350 °C), and radiative heat in accordance with
obtained when these materials are mixed with viscose FR, that the UNE-EN 367:1994, UNE-EN 702:1996, and UNE-EN ISO
possess higher hydrophilicity. In some cases, a low percentage 6942:2002 standard, respectively. The response (variable) of
of around 5% of p-aramid is also included in the mixtures in each structure was the time, in seconds, needed to raise its
order to obtain a higher mechanical performance. temperature by 24 °C (convective heat) or 12 °C (conductive
or radiative heat).
Two types of yarn were selected taking into account the
aforementioned factors: one consisting of 93% meta-aramid, 2.2. Experimental plan
5% para-aramid and 2% antistatic fiber (AR yarn), and the
other of 50% viscose FR, 43% meta-aramid, 5% para-aramid, Table 2 lists the factors used to examine the response of the
and 2% antistatic agent (CV-AR yarn). Both yarns were used in studied fabrics to convective, conductive, and radiative heat.
two different metric numbers: 2/60 and 2/90. Such factors and their levels were chosen in accordance
with the experience and knowledge base of a renowned
manufacturer of heat protective fabrics.
Figure 1. Jacquard loom used to weave the fabrics. Figure 2. Variations of the interlocking cells according to shape and
size.
http://www.autexrj.com/ 2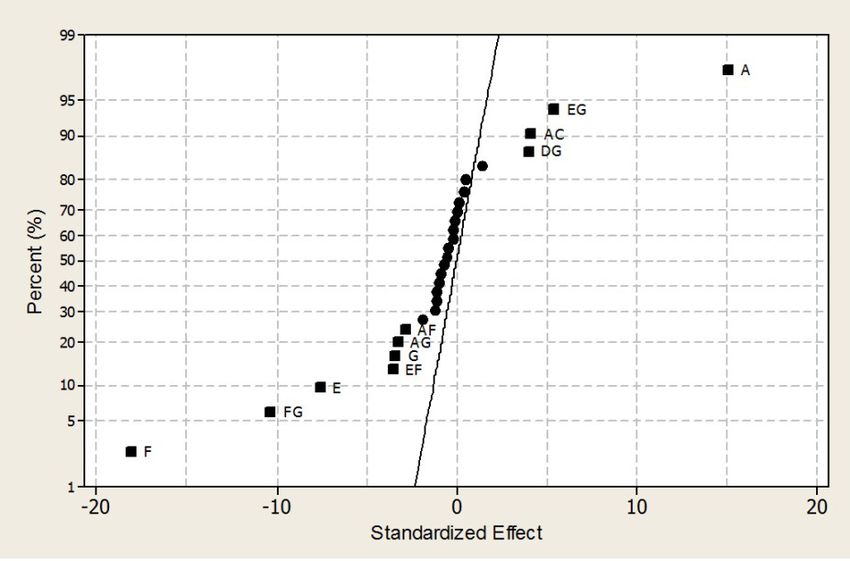
AUTEX Research Journal, DOI 10.2478/aut-2021-0038

Table 1. Fabric configurations according to the warp/weft ratios, number of layers and top layer materials

Figure 3. Scheme of the interlocking between the top and the bottom layers.

http://www.autexrj.com/                                                 3
AUTEX Research Journal, DOI 10.2478/aut-2021-0038

Table 2. Factors examined and their levels.                                 Table 3. Experimental plan

                                                    Low     High
                          Factor                    level   level                                            G    –       –       +       +
                                                     (−)     (+)                                             F    –       +       –       +
              A. Number of layers                    2        4                       No.                        Time   Time    Time    Time
                                                                               No.          A   B   C    D   E
                                                                                      std                         (s)     (s)     (s)    (s)
     B. Number of materials in the top
                                                     1        2
                layer(s)                                                       1      17    –   –   –    –   +
                                                                               2      2     +   –   –    –   –
          C. Weft density (picks/cm)                 28      40                3      3     –   +   –    –   –
                                                                               4      20    +   +   –    –   +
         D. Interlocking cell size (cm)             0.8      1.6               5      5     –   –   +    –   –
                                                                               6      22    +   –   +    –   +
           E. Interlocking cell shape                Ү      Square             7      23    –   +   +    –   +
                                                                               8      8     +   +   +    –   –
              F. Warp-to-weft ratio                 1:1      2:1               9      9     –   –   –    +   –
                                                                               10     26    +   –   –    +   +
            G. Yarn metric number                   2/60     2/90              11     27    –   +   –    +   +
                                                                               12     12    +   +   –    +   –
Crossing the factors in Table 2 would lead to a design
                                                                               13     29    –   –   +    +   +
                                                                               14     14    +   –   +    +   –
comprising 27 = 128 experiments. However, factors F and G                      15     15    –   +   +    +   –
were applied during the preparation of the warp beams step,                    16     32    +   +   +    +   +
prior to the weaving process, whereas the other factors (A–
E) pertained to the weaving process were applied during the
weaving step. Therefore, the study was conducted on two                     due to the effect of their actually influencing the response of the
types of experimental units: “large” units —warp yarns in the               fabrics rather than being random effects. Figures 4–6 show the
warp beam— and “small” units —corresponding to the woven                    normal probability plots for convective, conductive (350 °C),
structures. This method of factor arrangement is known as the               and radiative heat transfer, respectively.
“split-plot” design. The present work examined 22 whole plots
namely the four warp folders obtained from factors F and G,
which are difficult to change— from which each whole plot split
into 25 sub-plots or split-plots and finally the 32 structures are
obtained from crossing the factors A to E, which are easier to
alter.

In order to save resources without detracting from information
content, the initial 25 factors were halved into 25−1 with V
resolution, where none of the main factors or their interactions
was the alias of any other main factor or interaction between
two factors. Thus, a total of 64 experiments per response were
                                    2  5-1
planned in accordance with the 2 ×2V factor design of Table
3. The first column indicates the order of the planning of the
experiments and the second column the standard order of the
full factorial design.

                                                                            Figure 4. Normal probability plot of the standardized effects on the
                                                                            response to convective heat.
3. Results and discussion

3.1. Statistical analysis

The effect of each factor was calculated as the difference
between the high factor-level average response and the low
factor-level average response. The effect of a binary interaction
between factors was explained in terms of the difference
between the individual effect of one factor at its high level
and that of the same factor at the low level of the other. The
absolute value of this difference thus provided a measure of the
influence of each factor and its interactions.

The magnitude of the effects of the 7 factors and 21 binary
interactions studied were represented in a Daniel’s (normal
probability) plot. Uninfluential factors fell in a straight line near
                                                                            Figure 5. Normal probability plot of the standardized effects on the
zero. In contrast, active effects departed from the normality line          response to conductive heat.

http://www.autexrj.com/                                                 4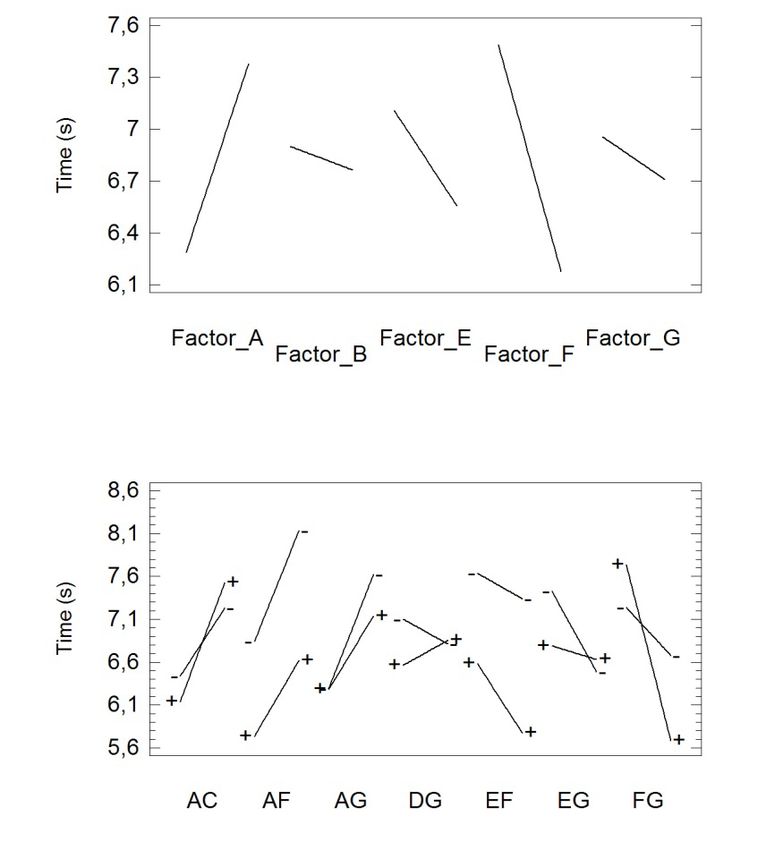
AUTEX Research Journal, DOI 10.2478/aut-2021-0038

Figure 6. Normal probability plot of the standardized effects on the
response to radiative heat.

ANOVA uses the same numerical calculations for a split-plot
design as for any other type of factor design—sums of squares,
degrees of freedom, and mean squares. However, the
calculated values had to be rearranged in order to identify the
two types of error present in the experimental units: the whole-
plot error and the sub-plot error. In the absence of replication,
high-order interactions were used to construct these errors;
however, the whole-plot error could only be constructed from
                                                                            Figure 7. Main effects and interaction plot for the response to
the FG interaction with a single degree of freedom, which                   convective heat.
led to false statistical significance judgments. In any case,
judgments were facilitated by the magnitude of each effect and              respectively. The second column in each table displays the
its contribution to the overall sum of squares.                             effects and the fourth column, their percentage contribution to
                                                                            total variability. The effects are graphically shown in Figures
Tables 4–6 show the ANOVA results for the response of                       7–9.
the fabrics to convective, conductive, and radiative heat,

Table 4. Figures of merit of the design for the response to convective heat.

                                               Sum of         Contribution                      Mean
        Source              Effects                                                 Df                         F-ratio         p-value
                                               squares            (%)                          square
            F               −0.2531             1.0251           1.9021              1         1.0251           0.35           0.6599
            G               −1.7671            49.9672           92.7104             1        49.9672           17.16          0.1508
   WP error (FG)             0.4265            2.91129           5.4016              1        2.91129
            A                0.6703             7.1891           25.9328             1         7.1891           57.73          0.0000
            B               −0.5296             4.4891           16.1932             1         4.4891           36.05          0.0000
            C                0.2531             1.0251           3.6980              1         1.0251           8.23           0.0061
            D                0.4546             3.3078           11.9322             1         3.3078           26.56          0.0000
            E               −0.2109             0.7119           2.5680              1         0.7119           5.72           0.0207
           AG               −0.2625             1.1025           3.9769              1         1.1025           8.85           0.0045
           BF                0.3328             1.7722           6.3928              1         1.7722           14.23          0.0004
           BG                0.1968             0.6201           2.2370              1         0.6201           4.98           0.0302
           CD                0.1734             0.4812           1.7361              1         0.4812           3.87           0.0550
           DG               −0.1781             0.5076           1.8312              1         0.5076           4.08           0.0490
           EG                0.1593             0.4064           1.4660              1         0.4064           3.26           0.0770
       SP error                                 6.1017                              49         0.1245
          Total                                81.6162                              63

http://www.autexrj.com/                                                 5
AUTEX Research Journal, DOI 10.2478/aut-2021-0038
Table 5. Figures of merit of the design for the response to conductive heat.
Source Effects Sum of Contribution (%) Df Mean F-Ratio p-value
squares square
F −1.309 27.4157 73.3709 1 27.4157 3.0548 0.33106
G −0.246937 0.9756 2.61107 1 0.9756 0.1087 0.79720
WP error (FG) −0.748938 8.9745 24.0179 1 8.9745
A 1.09131 19.0554 53.2869 1 19.0554 259.5 0.0000
B −0.1375 0.3025 0.84591 1 0.3025 4.12 0.0476
E −0.549875 4.8378 13.5285 1 4.8378 65.88 0.0000
AC 0.2985 1.4256 3.9866 1 1.4256 19.41 0.0001
AF −0.204563 0.6695 1.8722 1 0.6695 9.12 0.0039
AG −0.23625 0.8930 2.4972 1 0.8930 12.16 0.0010
DG 0.290563 1.3508 3.7774 1 1.3508 18.40 0.0001
EF −0.255875 1.0475 2.9293 1 1.0475 14.27 0.0004
EG 0.389937 2.4328 6.8031 1 2.4328 33.13 0.0000
SP error 3.7450 51 0.07343
Total 73.1257 63
Table 6. Figures of merit of the design for the response to radiative heat.
Sum of Mean
Source Effects Contribution (%) Df F-Ratio p-value
squares square
F 0.33125 1.7556 0.2160 1 1.7556 0.3112 0.6760
G −7.09375 805.1410 99.0897 1 805.1410 142.739 0.0531
WP error (FG) 0.59375 5.6406 0.6941 1 5.6406
A 6.40625 656.6410 49.8717 1 656.6410 95.42 0.0000
C 2.89375 133.9810 10.1758 1 133.9810 19.47 0.0000
AB 1.26875 25.7556 1.9561 1 25.7556 3.74 0.0583
AG −2.23125 79.6556 6.0498 1 79.6556 11.58 0.0013
BF 1.26875 25.7556 1.9561 1 25.7556 3.74 0.0583
CD −1.20625 23.2806 1.7681 1 23.2806 3.38 0.0714
SP error 371.5940 54 6.8813
Total 2129.2006 63
3.2. Optimization of multiple thermal protective responses where m is the total mean of the results; ai and bj are the main
whole-plot effects; qij is the whole-plot error; gk, yl, τm, wn, and φo
The effect model for a split-plot design involving 2 whole-plot are the main sub-plot factors; the 21 combinations of two main
factors and 5 sub-plot factors is defined by effects are binary interactions; and eijklmno is the sub-plot error.
Tables 4–6 show the best ANOVA results for the three responses
y! ijklmno = µ + ai + b j + qij + g k + y l + tm + wn + jo + obtained using this design under the assumption of fixed
+ ( ag )ik + ( ay )il + ........(21.......... + ( wj )no + eijklmno factors. Least-squares regression of the model parameters with
quantitative factors spanning the range 1 allowed the responses
to be estimated from linear regression models. The coefficients
i, j,k,l,m,n,o Î -1, +1 of each model, together with its coefficient of determination
as corrected for the particular number of degrees of freedom,
are shown in Table 7. Finally, the maximum response of each
http://www.autexrj.com/ 6AUTEX Research Journal, DOI 10.2478/aut-2021-0038
Figure 8. Main effects and interaction plot for the response to Figure 9. Main effects and interaction plot for the response to radiative
conductive heat (350 °C). heat.
model falling within the experimental region led to the factor 0 y! < low
r
combinations listed in Table 8. é y! - low ù
d= ê ú low £ y! £ high
A useful approach to the optimization of multiple responses is ëê high - low ûú
to use the simultaneous optimizations technique developed by 1 y! > high
Derringer and Suich [17]. As the objective for the response is a
maximum value, the individual desirability function is expressed
as follows:
Table 7. Regression coefficients of the responses to the three types of heat.
Convective Conductive Radiative
Coefficient Estimate Coefficient Estimate Coefficient Estimate
constant 6.1125 Constant 6.8327 Constant 98.0969
A 0.3351 A 0.5456 A 3.2031
B −0.2648 B −0.06875 C 1.4468
C 0.1265 E −0.2749 G −3.5468
D 0.2273 F −0.6545 AB 0.6343
E −0.1054 AC 0.1492 AG −1.1156
G −0.8835 AF −0.1022 BF 0.6343
AG −0.1312 AG −0.1181 CD −0.6031
BF 0.1664 DG 0.1452
BG 0.09843 EF −0.1279
CD 0.08671 EG 0.1949
DG −0.08906
EG 0.07968
R2 (fitted) 84.81% R2 (fitted) 77.74% R2 (fitted) 79.97%
http://www.autexrj.com/ 7AUTEX Research Journal, DOI 10.2478/aut-2021-0038
Table 8. Optimum factor levels.
4. Discussion
Factor Low High Convective Conductive Radiative
F −1.0 1.0 −1 −1 1 The ANOVA results displayed in Tables 4–6 are summarized
in Table 10. As can be seen from this table, factor A and
G −1.0 1.0 −1 −1 −1
interaction AG were shared by all three types of heat response.
A −1.0 1.0 1 1 1 The response to convective and radiative heat was especially
influenced by factor G (yarn metric number), whereas
B −1.0 1.0 −1 −1 1
conductive transfer was more significantly affected by F (ratio
C −1.0 1.0 1 0.95 1 of materials in the top layer). Furthermore, the only significant
interactions not involving the two whole-plot factors (F and G)
D −1.0 1.0 1 −1 −1
were CD for convective heat, AC for conductive heat, and AB
E −1.0 1.0 −1 −1 −1 for radiative heat.
In fact, as can be seen from the graphs depicted in Figures
7–9, the three responses depended similarly on factor A and
interaction AG. Thus, increasing the number of layers from
Where y ! is the estimated response, and the limits “low” and “high” 2 to 4 increased the response time, with a greater increase
coincide with the extreme observed values. Exponent r is used to seen for a metric number of 2/60 than for 2/90. Therefore, the
select the desired type of transformation; thus, r = 1 (the usual choice) combined effect of layer number and yarn metric number was
means that desirability increases linearly to the target value. not additive, but rather synergistic.
The desirability function can range from 0 (absolute non- As can be seen from Figures 10 and 12, increasing the yarn
conformance with the target) to 1 (optimal, total conformance). metric number (i.e., reducing the yarn metric) decreased the
response time to convective and radiative heat. In contrast,
The individual desirability of each experimental value was switching from a 1:1 warp-to-weft ratio to a 2:1 ratio decreased
used to calculate the total desirability, with the geometric mean the response time to conductive heat (see Figure 8).
weighted on an impact factor I allowing the relative significance
of each response to be balanced: The response to convective heat was significantly affected by
3 interaction CD (94% confidence level). Thus, increasing weft
( )å
1/ Ii
D = d1I1 ´ dI22 ´ dI33 i=1
density from 28 picks/cm to 40 picks/cm and air cell size from
0.8 cm to 1.6 cm increased the response time (see Figure 10).
Fabric response to conductive heat was strongly influenced
1 ≤ Ii ≤ 5 by interaction AC, with an increase in layer number from 2
to 4 and weft density from 28 to 40 picks/cm strengthen this
response (see Figure 8). Finally, as can be seen from Figure 9,
In this work, the values employed were r = 1, an identical the response to radiative heat was improved by the combined
impact factor for the three responses (I = 3) and the following effect of factors A and B (i.e., interaction AB), which was
experimental ranges: minimum observed time of 4.575 s, significant at the 94% confidence level. Thus, increasing the
4.835 s, and 88.2 s for convective, conductive, and radiative number of layers from 2 to 4 strengthened the response due to
tests, and a maximum of 9.3 s, 8.702 s, and 113 s, respectively. the effect of the top layer consisting of two different materials
rather than just one.
The estimated optimum desirability was 0.866385. This
value was obtained at the factor levels shown in Table 9 and Also apparent from the results is that whereas the response to
corresponding optimal responses are 8.7070 s, 8.6680 s, and convective (flame) heat was significantly influenced by all sub-
106.8060 s for convective, conductive, and radiative heat, plot factors (A–E), while conductive heat was affected by three
respectively. factors (A, B, and E) and radiative heat by only two factors (A
Table 9. Optimum level combinations for the responses to the three and C).
types of heat.
As can be seen from Figure 7, the response time increased
Factor Low High Optimum
with the increase of (a) the number of layers from 2 to 4, (b)
F –1.0 1.0 −1 the weft density from 28 picks/cm to 40 picks/cm, and (c) the
cell size from 0.8 cm to 1.6 cm. In addition, the response time
G −1.0 1.0 −1
to convective heat decreased with (a) use of two different
A −1.0 1.0 1 materials in the outer layer(s) rather than a single one, and (b)
switching the interlocking cells from the Y-shape to the square-
B −1.0 1.0 −1
shape.
C −1.0 1.0 1
The response to conductive heat was markedly influenced
D −1.0 1.0 1
by fabric material and interlocking cell shape compared to
E −1.0 1.0 −1 radiative heat that is affected by weft density. As can be seen
http://www.autexrj.com/ 8AUTEX Research Journal, DOI 10.2478/aut-2021-0038
Table 10. Significant effects observed in the three types of tests (1: Table 11. Optimum factor levels for the individual response to each
substantial effect; 2: effect significant at the 95% level, and 3: effect type of heat.
significant at the 94% level).
Factor Low High Convective Conductive Radiative
Test
Effect A 2 4 4 4 4
Convective Conductive Radiative
B 1 2 1 1 2
F – 1
C 28 40 40 4 40
G 1 – 1
D 0.8 1.6 1.6 0.8 0.8
FG – – –
E Y o Y Y Y
A 2 2 2
F 1:1 2:1 1:1 1:1 2:1
B 2 2 –
G 2/60 2/90 2/60 2/60 2/60
C 2 – 2
D 2 – – for a cell size of 1.6 cm, the response time was independent
of the fabric metric number. Finally, switching from Y-shaped to
E 2 2 –
square-shaped interlocking cells decreased the response time
AB – – 3 to a much greater extent with a 2:1 ratio than with a 1:1 ratio
(EF interaction), and achieved the same with thicker yarns than
AC – 2 –
with thinner yarns (EG interaction).
AF – 2 –
The response to radiative heat was also influenced by
AG 2 2 2
interaction BF. As can be seen from Figure 9, switching from a
BF 2 – x single material in the outer layer(s) to two materials increased
the response time with a 2:1 warp-to-weft ratio but gets
BG 2 – –
decreased with a 1:1 ratio.
CD 3 – –
Table 11 lists the optimum levels for the different factors.
DG 2 2 –
Analysis of these values reveals that A, C, E, and G were
EF – 2 – identical for all three level combinations.
EG – 2 –
from Figure 8, the response time to conductive heat was
shorter with a single material (AR) than with two (CV-AR) in
the outer layer, and also with Y-shaped cells rather than with
square cells. Likewise, increasing the weft density increased
the response time to radiative heat.
The response to convective heat was additionally influenced
by interactions BF, BG, and DG (Figure 7). Regarding the BF
interaction, this response decreased with an increasing number
of materials in the top layer —since the top layer with two
materials contained, in fact, less aramid and more markedly
with a 1:1 warp-to-weft ratio than with a 2:1 ratio. For the DG
interaction, the response time to convective heat was longer
with a cell size of 0.8 cm than with one of 1.6 cm, especially
with higher yarn count —smaller metric number. Regarding
interaction CD, the response time to convective heat increased
with increasing weft density and more markedly with a cell size
of 0.8 cm compared to one of 1.6 cm.
The response to conductive heat was additionally influenced
by interactions AF, DG, EF, and EG (Figure 8). For interaction
AF, increasing the number of layers from 2 to 4 increased the
response time to a greater extent with a 1:1 warp-to-weft ratio
than with a 2:1 ratio. In terms of DG, a cell size of 0.8 cm led to an Figure 10. Appearance of the fabrics after the convective heat test. In
increased response time, with this increase being greater with this case, the optimum fabric for convective heat is sample 78.
thicker (Nm 2/60) than with thinner (Nm 2/90) yarns. However,
http://www.autexrj.com/ 9AUTEX Research Journal, DOI 10.2478/aut-2021-0038
Table 12. Mechanical properties of optimum samples.
Sample Direction Tensile testing Tear test Dimensional stability Thickness (mm) Areal weight (gr/m2)
Force max (N) Force max (N) After five washings (%)
70 Warp 974.00 194.30 4.41 1.23 287.2
Weft 988.40 192.80 4.79
78 Warp 936.70 210.30 3.74 1.31 287.8
Weft 971.00 200.20 4.01
104 Warp 995.10 168.30 2.41 1.11 305.6
Weft 1,024.60 181.70 3.33
Figure 10 shows the results of the convective heat test carried The results thus obtained allow the following conclusions to be
out on woven structures designed in accordance with these drawn:
optimum values: sample 78 presents the optimal for convective
heat, sample 70 for conductive heat, and 108 for radiative heat. 1. The fabrics with square air cells provided poorer heat
The physical properties for these optimum fabrics are shown in protection than those with Y-shaped cells, due to the effect
Table 12. of the former on preventing free circulation of air between
layers, and hence, the air temperature being more easily
Dealing simultaneously with the three types of response lead to transferred as a result. This effect was more noticeable in
the optimal combination of factors presented in Table 13, which thicker yarns.
maximizes the desirability function.
2. For fabrics of equal weft density, arranging yarns in
Table 13. Optimum factor levels for the simultaneous response to the different layers resulted in improved protection thanks to
three types of heat. the layer closest to the heat source being more distant
Factor Low High Optimum from the measuring point.
A 2 4 4 3. As expected, thicker yarns provided a higher protection
B 1 2 1 owing to the obvious increased amount of fireproof material
in the fabric, especially AR yarns. Similarly, the increased
C 28 40 40 number of picks led to the same conclusion.
D 0.8 1.6 1.6
4. Increasing layer number, weft density, interlocking cell
E Ү o Y size, and yarn thickness all efficiently hindered heat
F 1:1 2:1 1:1 propagation.
G 2/60 2/90 2/60 5. The presence of aramid alone in the outer fabric layer(s)
proved more heat protective than that of a mixture of yarns
5. CONCLUSIONS (aramid–viscose FR/aramid).
The present work has examined the influence of weaving 6. Layer number and the interaction of this factor with yarn
variables with a view to producing improved heat protective count significantly influenced fabric response to the
fabrics, which effectively respond to convective, conductive, three types of heat. Thus, response times increased with
and radiative heat. To this end, we assessed the effects increasing number of layers, especially at a higher yarn
of individual factors and their interactions. Performing count.
experiments simultaneously with the three types of heat led to
the identification of an optimal fabric structure. This structures The results of this study can be useful for the design of improved
is characterized by the use of four fabric layers, with a single heat-technical protective clothing.
material (meta-aramid) in the outer layer(s), a weft density of
40 picks/cm and Y-shaped interlocking cells of 1.6 cm in size,
obtained with a 1:1 AR:CV-AR warp, weft ratio (50% AR: 50%
CV-AR), and yarns of 2/60 metric number.
http://www.autexrj.com/ 10AUTEX Research Journal, DOI 10.2478/aut-2021-0038
[9] Sirvydas, P. A., Nadzeikienė, J., Milašius, R., Eičinas, J.,
ACKNOWLEDGMENTS Kerpauskas, P. (2006). The role of the textile layer in the
garment package in suppressing transient heat exchange
The author H. Ventura is a Serra-Húnter fellow. processes. Fibres Textiles East Europe, 14, 2(56), 55-58.
[10] Ding, D., Tang, T., Song, G., McDonald, A. (2011).
References Characterizing the performance of a single-layer fabric
system through a heat and mass transfer model – Part I:
[1] Zhiying, C., Yanmin, W., Weiyuan, Z. (2010). Thermal Heat and mass transfer model. Textile Research Journal,
protective performance and moisture transmission of 81, 398-411.
firefighter protective clothing based on orthogonal design. [11] Shalev, I., Barker, R. L. (1983). Analysis of heat transfer
Jounral of Industrial Textiles, 39(4), 347-356. characteristics of fabrics in an open flame exposure.
[2] Benisek, L., Edmondson, G. K., Phillips, W. A. (1979). Textile Research Journal, 53(8), 475-482.
Protective clothing—Evaluation of wool and other fabrics. [12] Shalev, I., Barker, R. L. (1984). Protective fabrics: A
Textile Research Journal, 49(4), 212-221. comparison of laboratory methods for evaluating thermal
[3] Chapman, A. C., Miller, G. (1980). Fibres, fabrics and protective performance in convective/radiant exposures.
finishes for FR workwear in Europe. Journal of Industrial Textile Research Journal, 54(10), 648-654.
Textiles, 10(1): 26-34. [13] Abdel-Rehim, Z. S., Saad, M. M., El-Shakankery, M.,
[4] Gauthier, M. M., Deanin, R. D., Pope, C. J. (1981). Man- Hanafy, I. (2006). Textile fabrics as thermal insulators.
made fibres: Flame retardance and flame redardants. AUTEX Research Journal, 6(3), 148-161.
Polymer Plastics Technology and Engineering, 16(1), 1-39. [14] Moo, Y., Barker, R. L. (1987). Thermal protective
[5] Holcombe, B. V. (1983). The heat related properties of performance of heat-resistant fabrics in various high
protective clothing fabrics. Fire Safety Journal, 6(2), 129- intensity heat exposures. Textile Research Journal, 57(3),
141. 123-132.
[6] Lee Y. M., Barker R. L. (1987). Thermal protective [15] Mandal, S., Song, G., Ackerman, M., Paskaluk, S.,
performance of heat-resistant fabrics in various high Gholamreza, F. (2013). Characterization of textile fabrics
intensity heat exposures. Textile Research Journal, 57(3), under various thermal exposures. Textile Research
123-132. Journal, 83(10), 1005-1019.
[7] Mehta, P. N. (1980). Engineered wool industrial protective [16] Padaki, N. V., Alagirusamy, R., Deopura, B. L., Fangueiro,
clothing. Textile Research Journal, 50(3), 185-193. R. (2010). Studies on preform properties of multilayer
[8] Perkins, R. M. (1979). Insulative values of single-layer interlocked woven structures using fabric geometrical
fabrics for thermal protective clothing. Textile Research factors. Journal of Industrial Textiles, 39(4), 327-346.
Journal, 49(4), 202-205. [17] Derringer, G. C., Suich, R. (1980). Simultaneous
optimization of several responses. Journal of Quality
Technology, 12(4), 214-219.
http://www.autexrj.com/ 11You can also read