DETERMINANTS OF NATURAL GAS SPOT PRICES - Alexandra Guerra Alan Shen Ting Zhao Professor Goldstein, Ph. D. Fin 3560-01 12/03/12
←
→
Page content transcription
If your browser does not render page correctly, please read the page content below

DETERMINANTS OF NATURAL GAS SPOT PRICES

           Alexandra Guerra
              Alan Shen
              Ting Zhao
     Professor Goldstein, Ph. D.
             Fin 3560-01
               12/03/12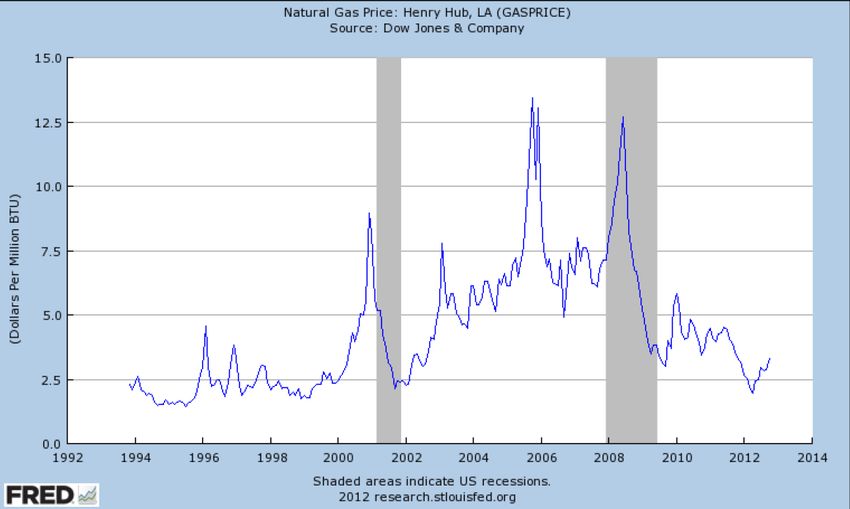
TABLE OF CONTENTS

I.      Executive Summary                                 Page 1

II.     Overview                                          Page 2

III.    Factors Affecting Price                           Page 3

        a. Real GDP                                       Page 3

        b. Production                                     Page 4

        c. Imports                                        Page 5

        d. Threat of Substitutes                          Page 6

        e. Storage                                        Page 7

IV.     Analysis of the Spot Prices of Natural Gas        Page 8

        a. Hypothesis Development                         Page 8

        b. Hypothesis Testing Methods                     Page 9

        c. F-test                                         Page 10

        d. R-square                                       Page 10

        e. P-value and Coefficient                        Page 10

V.      Conclusion                                        Page 12

VI.     References                                        Page 14

VII.    Multiple Regression Analysis by Using SPSS 17.0   Page 16

VIII.   Exhibits                                          Page 20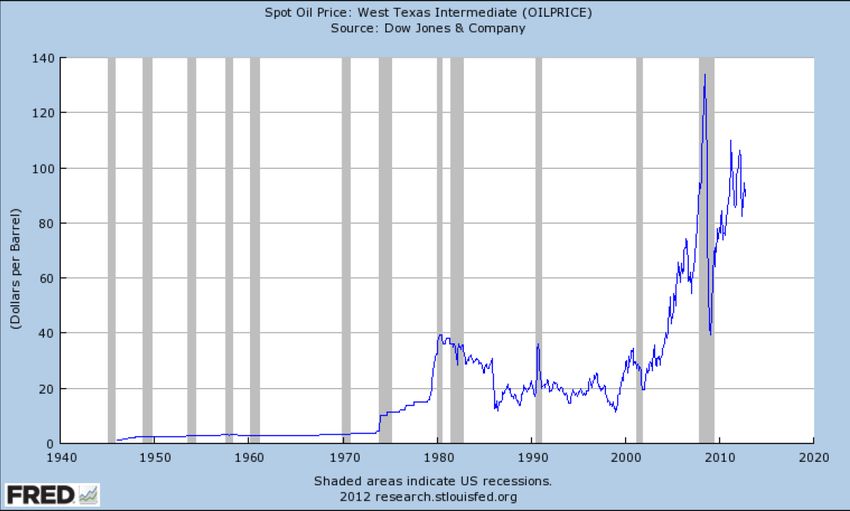
Executive Summary
        From its humble beginnings as a nuisance byproduct when extracting other fossil fuels, natural

gas has transformed into a premier commodity in present day America. Through recent technological

innovation, natural gas is no longer just the cleanest fossil fuel, but now also the most efficient option; all

the while remaining cheaper than renewable energy sources. Already heavily consumed worldwide,

especially in the United States, the energy market has and will continually be geared toward natural gas-

powered generation, propelling this phenomenon to even greater heights.

        Looking at various macroeconomic factors related to the industry, this paper will present both a

qualitative and quantitative analysis to determine the factors’ effects on the price of natural gas in the

United States. Setting the stage first with background on the industry, the paper then explores the

emergence of the industry and how it developed into the valued commodity it is today.

        Next, the paper examines the macroeconomic factors considered the most impactful on the

commodity’s price, identifying how each one individual affects the demand for or supply of natural gas.

By identifying these factors, the industry design can be more thoroughly examined, thus allowing the

identification of future growth drivers, reasons behind price volatility, as well as limitations and obstacles

that will likely be faced by moving forward

        Finally, these factors are quantified using relevant data in order to test the true significance of

these factors as they pertain to price. Conducting a regression analysis utilizing SPSS 17.0, the paper

directly compares each factor to the price, comparing their relative historical changes; the purpose of

which is to question the inferences drawn through research. A subsequent comparison then takes place to

determine the validity of the initial hypothesis as it pertains to the quantitative results. Differences the two

are then addressed, examining possible limitations in the scope or precision of the model or data in order

to identify the reasons behind divergences in outcome.

        Through a qualitative and quantitative analysis of potential factors that impact the price of natural

gas in the United States, the paper will provide not only an understanding of the industry but also a sound

foundation through which readers can then gauge the future direction of this vital commodity.

                                                       1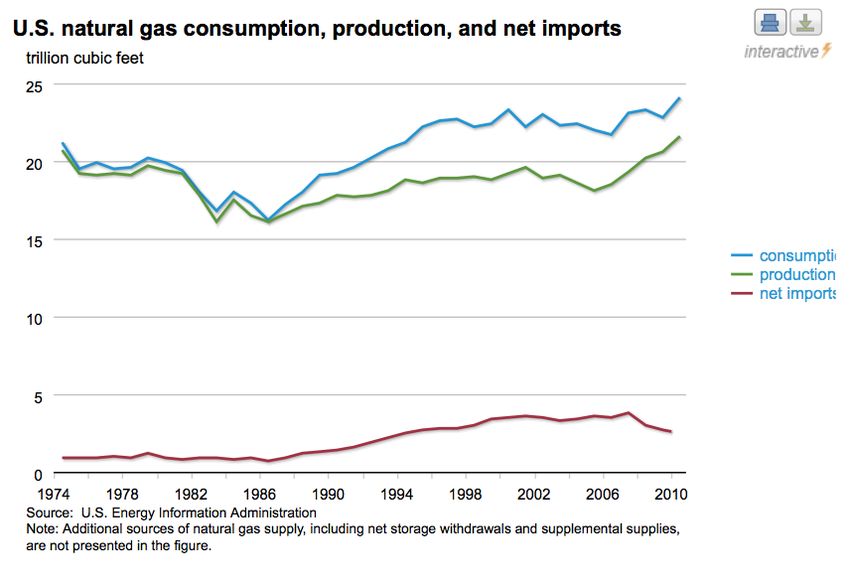
Overview

        As a primary component of the United States energy supply, natural gas is “one of the

cleanest, safest, and most useful” energy source available1. First commercialized in 1816, its use

did not become widespread until the 1920s, when “metallurgical advances allowed for the

construction of reliable pipelines” across the country. Once the infrastructure was in place, there

was a sudden surge in both residential and industrial use, ranging from heating homes to

industrial boilers2.

        To get this resource though required a capital intensive process, the first and most

difficult step historically being the identification of natural gas reserves. During the industry’s

infancy, “the only way of locating underground petroleum and natural gas deposits was to search

for surface evidence” like ‘anticlinal slopes’ or an outright seepage on the surface. Eventually,

this gave way to more modern methods of 2-D, 3-D, and now 4-D seismic imaging, which

increased the efficiency of exploration. Once reserves were found, a great deal of investment into

licensing, PP&E, and manpower must be made to extract the resource, of which then required

processing, transportation, storage, and distribution. Furthermore, heavy government regulation

particularly on pricing created extremely high barriers to entry, regardless of a firm’s position in

the value chain. As a result, few firms were able to remain profitable, leading to an increasingly

concentrated industry3.

        As regulation lessened in the 1980s and 1990s though, the trading of natural gas began to

extend beyond the physical market, entering also into the futures market. This “allow[ed] for the

hedging of financial exposure to transactions in the physical market by allowing suppliers and

1
  "Background." NaturalGas.org. N.p., n.d. Web. 01 Dec. 2012.
         .
2
  "History." NaturalGas.org. N.p., n.d. Web. 01 Dec. 2012. .
3
  "Exploration." NaturalGas.org. N.p., n.d. Web. 01 Dec. 2012. .

                                                         2
users of natural gas to net their gains in the financial market against the cost of their physical
transaction that will occur later on”. It also allowed those with no need for physical natural gas
the opportunity to profit from trading activities. This activity, coupled with improvements in
technology, led to the industry’s rapid growth and increasing stake in the United States energy
market4.
Factors Affecting the Spot Prices of Natural Gas
Real GDP
Natural gas prices today are primarily affected by a series of macroeconomic factors; one
of which is domestic GDP growth. With the United States economy slowly recovering,
“expected to grow annually at 1.9%” for the next five years”, increased demand by traditional
sectors is expected since energy consumption has historically reflected economic upswings and
downturns5. Accounting for 30% of nationwide consumption, the electric generation sector for
instance is projected to “increase at an average rate of one percent per year through 2035”. The
primary driver of this growth will be the increasing preference of natural gas as the cleanest
burning fossil fuel, with “60 percent of new electric generation capacity built by 2035” to include
natural gas in the generation process. This in turn is driven by downstream residential and
commercial demand, which combines for 34% of consumption. With upwards of 50 percent of
new homes built since 2010 favoring natural gas for powering appliances, as well as an overall
4
"Natural Gas Prices." Wikipedia. Wikimedia Foundation, 23 Nov. 2012. Web. 01 Dec. 2012.
.
5
Danova, Antonio. "Oil Drilling & Gas Extraction in the US." IBIS World. N.p., 2012. Web. 1 Dec. 2012.
.
3annual commercial consumption increase of 1.1 percent through 2035, this pervasive demand
will propel natural gas prices as its stake increases in the energy industry6.
Production
As the largest natural gas consuming country in the world, the United States has made
significant strides toward this commodity’s domestic production. While it has increased over the
years due to the development of more cost-effective and efficient drilling techniques, especially
natural gas produced from shale formations, there is still a ways to go before achieving the
necessary levels to match consumption. With natural gas heating 51% of homes in the United
States, production is perhaps the most impactful of all factors, as changes in supply will have a
direct effect on price, driving it up with shortages and vice versa.
While natural gas production remains relatively constant throughout the year, all else
being equal, short term supply barriers can have temporary effects. One such barrier is the
availability of skilled workers. Beyond the qualification of the available domestic work force,
other factors such has union resistance can pose difficulties for firms. As a result, companies are
willing to offer higher wages, scholarships, and other educational offerings to appeal workers
and professionals to the industry. Another barrier is the availability of equipment. Due to the
exorbitant cost of manufacturing equipment such as drill rigs, any temporary malfunction of
breakage would bring operations to a screeching halt until a replacement is installed. Though
firms may stock up on such equipment when prices are lower, there is still a time lag until
installation. A third barrier is government regulation. Given the nonrenewable nature of natural
gas, along with the importance of it to the domestic energy market, there are strict mandates on
6
"Demand." NaturalGas.org. N.p., n.d. Web. 01 Dec. 2012. .
4drilling rights. Thus, even when new drill sites are discovered, there will be a deal of lead time
before a license comes through, which, though short (relative to the time you can drill from the
site), still is an impediment firms in the industry must work through7.
Looking ahead, future supply can increase primarily through two avenues. The first, is
the discovery of new reserves, which will provide new sources for extraction. The second is
improvements in technology, increasing efficiency and speeds by which extraction occurs;
thereby improving the yield per site. Still, regardless of increases or decreases in supply over
time, its direct effect on price should remain constant.
Imports
Due to the rapid consumption of natural gas by the domestic market, imports have been
crucial in making up the shortfalls. As a result, it had and still has significant effects on the price
of natural gas in the United States. The main impact though stems from the simple fact it drives
up the supply that is available for consumption. Due to the proximity of Canada, a major
producer and chief importer of natural gas to the United States, prices have been able to remain
lower. Another factor, the cost of importing the resource, has also been mitigated over the years
through such decisions like the North American Free Trade Agreement (NAFTA). NAFTA not
only opened up the U.S.-Canadian border, thereby alleviating import taxes, but also incentivized
the improvements of existing pipelines between the two nations, improving efficiency and the
incoming supply. Because of Canada’s immense gas reserves, the U.S. obtains a dependable and
consistent source of natural gas imports in order to assist meeting growing demand. However,
due to domestic production increases, thereby achieving record high-inventory in underground
7
"Natural Gas Supply." NaturalGas.org. N.p., n.d. Web. 02 Dec. 2012.
.
5storage, net imports of natural gas coming from Canada have been declining for several years. In
2012, net imports from Canada declined about 7%, to 5.7 billion cubic feet per day (Bcfd,) with
total imports now accounting for about 8% of the total domestic consumption. Thus, as the
United States achieves greater natural gas independence, the impact of imports on domestic
prices will decrease in kind8.
Threat of Substitutes
As a result of a recent increase in supply, natural gas has been able to overcome problems
that have otherwise ailed traditional substitutes such as coal and crude oil, due to its short-run
decrease in price. While natural gas prices have historically moved comparably to crude oil
prices, due to their similar applications, the two are now starting to diverge. The primary reason
for this change is the competitive advantage of natural gas now holds due to the development of
new technology in its favor. Despite being a fossil fuel, natural gas’ lower level of emissions and
extensive application has made it the focus of the most recent innovations in the industry. The
outcome is the development of “modern natural gas…generation units [that] can approach 60
percent efficiency” completely outstripping traditional coal and crude oil counterparts operating
at around 34 percent. Also, due to the malleability of natural gas, its generators can be easily
turned on and off, allowing for timely generation to adjust for short term demand volatilities,
making encompassing facilities more operationally flexible and efficient9. Thus, with natural
gas-fired electricity generation becoming “as cheap as, or cheaper than…coal-fired generation,
formerly the lowest-cost fuel”, foreseeable infrastructure developments will be centered around
8
"Natural Gas Supply." NaturalGas.org. N.p., n.d. Web. 02 Dec. 2012.
.
9
"Demand." NaturalGas.org. N.p., n.d. Web. 01 Dec. 2012. .
6this versatile commodity10. Unfortunately, while the foreseeable future is bright, the reality is
that there is a time lag before full implementation of these innovations can be transformed into a
reality. The electric generation process as well as consumer use of fuel will, for the time being,
continue to fluctuate comparatively with crude oil.
Storage
As previously mentioned, natural gas is a malleable commodity, made so primarily due to
its ability to be stored indefinitely. Stored through a variety of methods and in various forms, the
purpose is to maintain the reliability of supply as a means to stabilize price volatility as a result
of “seasonal demand requirements…and unforeseen supply disruptions”. Using 2010 as a
benchmark year, the short-run importance of such a tool can be illustrated. With annual
consumption, production, import, and export at around 24.12611, 21.85912, 2.59113, and 1.50714
trillion cubic feet respectively, there was about 1.183 trillion cubic feet of unaccounted
consumption. Thus, excess demand in this case can be met by using accumulated reserves.
Conversely, had supply exceeded demand, it could have been stored using the storage capacity
10
Danova, Antonio. "Oil Drilling & Gas Extraction in the US." IBIS World. N.p., 2012. Web. 1 Dec. 2012.
.
11
"Natural Gas Production/consumption Retrospective 2010." U.S. Energy Information Administration. U.S. Energy
Information Administration, n.d. Web. 02 Dec. 2012.
.
12
"List of Countries by Natural Gas Production." Wikipedia. Wikimedia Foundation, 23 Nov. 2012. Web. 02 Dec.
2012. .
13
"Natural Gas Production/consumption Retrospective 2010." U.S. Energy Information Administration. U.S. Energy
Information Administration, n.d. Web. 02 Dec. 2012.
.
14
"U.S. Natural Gas Exports by Country." U.S. Energy Information Administration. U.S. Energy Information
Administration, n.d. Web. 02 Dec. 2012. .
7available in 2010 of about 8.764 trillion cubic feet15. Thus, as storage capacity increases, thereby
increasing available supply, natural gas prices should decrease.
Analysis of the Spot Prices of Natural Gas
Hypothesis Development
According to information from the U.S. Energy Information Administration, we made
five hypotheses for the relationship between the spot prices of natural gas and other five factors
included the real GDP, the volume of natural gas being produced, the volume of natural gas
being imported, oil prices and the amount of natural gas in storage facilities16.
H1: Real GDP has a positive relationship with the spot prices of natural gas, if other
factors keeping at the constant.
H2: The volume of natural gas being produced has a negative relationship with the spot
prices of natural gas, if other factors keeping at the constant.
H3: The volume of natural gas being imported has a negative relationship with the spot
prices of natural gas, if other factors keeping at the constant.
H4: The oil prices has a positive relationship with the spot prices of natural gas, if other
factors keeping at the constant.
H5: The amount of natural gas in storage facilities has a negative relationship with the
spot prices of natural gas, if other factors keeping at the constant.
15
"U.S. Underground Natural Gas Storage Capacity." U.S. Energy Information Administration. U.S. Energy
Information Administration, 30 Nov. 2012. Web. 02 Dec. 2012.
.
16
"Factors Affecting Natural Gas Prices." U.S. Energy Information Administration. U.S. Energy Information
Administration, 11 June 2012. Web. 02 Dec. 2012.
.
8Hypothesis Testing Methods
We did the multiple regression analysis by using SPSS 17.0 to test the correlation between
the spot prices of natural gas and other five factors included the real GDP, the volume of natural
gas being produced, the volume of natural gas being imported, oil prices and the amount of
natural gas in storage facilities. Our analysis is based on the quarterly data from 1997 to 2012.
The regression model is formed as follow:
Yi=α0 +α1 X1 +α2 X2+α3 X3 +α4 X4 +α5 X5+êi
Yi = Spot Prices of Natural Gas
X1 = Real GDP
X2= the Volume of Natural Gas Being Produced
X3 = the Volume of Natural Gas Being Imported
X4= Oil Prices
X5 = the Amount of Natural Gas in Storage Facilities
α0= differential effects of factors other than these five factors
α1= differential effect of Real GDP
α2= differential effect of the Volume of Natural Gas Being Produced
α3= differential effect of the Volume of Natural Gas Being Imported
α4= differential effect of Oil Prices
α5= differential effect of the Amount of Natural Gas in Storage Facilities
H0: α1=α2=α3=α4=α5=0
H1: At least one coefficient is different from zero
9F-test
We used the overall F-test to test whether these five factors have the significant effect on
the spot prices of natural gas. A confidence level of 95% was used in our analysis. From the
ANOVA table, we can state that the F-test, which is 46.584, is significant at the significant level
of 0.05. Therefore, we can reject the null hypothesis which we have mentioned above and prove
that at least one coefficient is different from zero.
R-square
The “R Square” value will be used to see whether there is a strong relationship between the
independent variable (X1, X2, X3, X4 and X5) and the targeted dependent variable (Yi). The R
square in our analysis is 0.803, which interprets the percentage of the total variation in the
dependent variable explained by the independent variables. Thus, 80.3% of the spot prices of
natural gas have been significantly explained by the five independent variables. The other 19.7%
of the spot prices of natural gas cannot be explained by these five factors, and that is because
there are many other factors we did not adopt in our analysis such as weather, government
policy, other competitors and substitutes. These factors may contribute to the rest 19.7%. There
are many reasons that we did not adopt those factors, for instance, it is hard to measure them or
to find the data. Therefore, the limitation of the factors will affect the R square in our analysis.
P-value and Coefficient
The variables with p-value greater than 0.05 will be rejected based on our hypothesis, since
it means that the regression is not significant enough. Moreover, we used the standardized
10coefficients for our five factors, since the unstandardized coefficients of the five factors are too
small, and this change would not influence our results of the coefficient analysis.
Real GDP
There is a significant, positive correlation between spot prices of natural gas and the real GDP
(Coefficient = 0.174, p-value= 0.017Therefore, we tested all of our regressions without the amount of natural gas in storage facilities,
and noticed that correlation R square dropped to 0.799. Statistically, this means that the removed
variable actually had significance, and therefore that the first regression was valid.
For hypotheses H1-H5, we investigate the influence of the five independent variables. As
expected, the real GDP (Coefficient = 0.174, p-value= 0.017the U.S. Energy Information Administration, and it showed that the hypotheses were unreliable,
since we were unable to definitely prove all the hypotheses based on our analysis.
Some limitations may have impacts on our analysis, such as we did not take the time series into
account; the five factors we examined are only the most important factors for the spot prices of
natural gas and other factors weight as 19.7% were not take into account in our analysis; the data
from 1997 to 2012 may not be enough; the regression model we used here may not be the most
appropriate model for the spot prices of natural gas.
13References
AEO2012 Early Release Overview. Tech. no. REF2011.D020911A. N.p.: n.p., n.d. AEO2012
Early Release Overview. U.S. Energy Information Administration. Web. 2 Dec. 2012.
.
"Background." NaturalGas.org. N.p., n.d. Web. 01 Dec. 2012.
.
"Canada Week: Natural Gas Net Imports from Canada Continue to Decline." U.S. Energy
Information Administration - EIA - Independent Statistics and Analysis. U.S. Energy
Information Administration - EIA - Independent Statistics and Analysis, 30 Nov. 2012.
Web. 02 Dec. 2012. .
Danova, Antonio. "Oil Drilling & Gas Extraction in the US." IBIS World. N.p., 2012. Web. 1
Dec. 2012. .
"Demand." NaturalGas.org. N.p., n.d. Web. 01 Dec. 2012.
.
"Exploration." NaturalGas.org. N.p., n.d. Web. 01 Dec. 2012.
.
"Factors Affecting Natural Gas Prices." U.S. Energy Information Administration. U.S. Energy
Information Administration, 11 June 2012. Web. 02 Dec. 2012.
.
Fickett, Jim. "Natural Gas -- a Free Market Rebalancing Is Underway." [ClearOnMoney]. N.p., 13 Mar.
2012. Web. 02 Dec. 2012. .
"History." NaturalGas.org. N.p., n.d. Web. 01 Dec. 2012.
.
14"List of Countries by Natural Gas Production." Wikipedia. Wikimedia Foundation, 23 Nov.
2012. Web. 02 Dec. 2012.
.
"Natural Gas and Residual Fuel Oil Price Comparison." Natural Gas and Residual Fuel Oil
Price Comparison. PetroStrategies.Inc, n.d. Web. 02 Dec. 2012.
.
"Natural Gas Prices." Wikipedia. Wikimedia Foundation, 23 Nov. 2012. Web. 01 Dec. 2012.
.
"Natural Gas Production/consumption Retrospective 2010." U.S. Energy Information
Administration. U.S. Energy Information Administration, n.d. Web. 02 Dec. 2012.
.
"Natural Gas Supply." NaturalGas.org. N.p., n.d. Web. 02 Dec. 2012.
.
"Storage." NaturalGas.org. N.p., n.d. Web. 02 Dec. 2012.
.
"U.S. Natural Gas Exports by Country." U.S. Energy Information Administration. U.S. Energy
Information Administration, n.d. Web. 02 Dec. 2012.
.
"U.S. Underground Natural Gas Storage Capacity." U.S. Energy Information Administration.
U.S. Energy Information Administration, 30 Nov. 2012. Web. 02 Dec. 2012.
.
"Working Natural Gas Storage Capacity Grows 3% Year-over-year." U.S. Energy Information
Administration - EIA - Independent Statistics and Analysis. U.S. Energy Information
Administration - EIA - Independent Statistics and Analysis, 12 Sept. 2012. Web. 02 Dec.
2012. .
15Multiple Regression Analysis by Using SPSS 17.0
1617
18
19
Exhibits

           20
21
22
23
24
25
“The authors of this paper hereby give permission to Professor Michael Goldstein
to distribute this paper by hard copy, to put it on reserve at Horn Library at Babson
College, or to post a PDF version of this paper on the internet”.

“I pledge my honor that I have neither received nor provided any unauthorized
assistance during the completion of this work”

______________________________________
Alex Guerra

______________________________________
Alan Shen

______________________________________
Ting Zhao

                                         26
You can also read