Identifying Vaccine-Hesitant Communities on Twitter and their Geolocations: A Network Approach
←
→
Page content transcription
If your browser does not render page correctly, please read the page content below
Proceedings of the 54th Hawaii International Conference on System Sciences | 2021

Identifying Vaccine-Hesitant Communities on Twitter and their Geolocations:
                           A Network Approach

          Jeanette B. Ruiz                     Jade D. Featherstone                    George A. Barnett
    University of California, Davis        University of California, Davis        University of California, Davis
         jbruiz@ucdavis.edu                     jding@ucdavis.edu                    gabarnett@ucdavis.edu

                        Abstract                                 The online antivaccine groups are more effectively
    Vaccine misinformation online may contribute to the      connected at both a global and local level, unlike pro-
increase of anti-vaccine sentiment and vaccine-hesitant      vaccine groups who are less locally focused [5]. The
behaviors. Social network data was used to identify          antivaccine influencers then, are highly connected and
Twitter vaccine influencers, their online twitter            occupy a central place in online forums. Generally,
communities, and their geolocations to determine pro-        online opinion leaders have a lot of followers and tend
vaccine and vaccine-hesitant online communities. We          to be central in their networks which results in their
explored 139,433 tweets and identified 420 vaccine           posts receiving a great number of responses in the form
Twitter influencers—opinion leaders and assessed             of likes/favorites, replies, and shares. Often social media
13,487 of their tweets and 7,731 of their connections.       influencers limit communication to specific topic areas
Semantic network analysis was employed to determine          and they dependably update “audiences” with consistent
twitter conversation themes. Results suggest that            content but also are very responsive to their audience’s
locating social media influencers is an efficient way to     diverse concerns all of which helps to increase their
identify and target vaccine-hesitant communities online.     persuasive influence.
We discuss the implications of using this process for            This persuasive influence can be seen on various
public health education and disease management.              social media platforms, including Twitter. Twitter, a
                                                             popular microblogging site where users post short
                                                             messages or “tweets” with a 280 character limit can also
1. Introduction                                              include multimedia content and hyperlinks to other
                                                             content on various sites. Hashtags are also often
    Vaccine-hesitant parents have been shown to favor        included with tweets and these form hyperlinks that
information from the internet rather than from health        connect tweets and have the potential to reach a large
care providers or credible health organizations [1].         audience.
Similarly, vaccine-hesitant parents rely on information          In this study, Twitter was selected for assessment
shared on social media platforms, specifically from          because of its popularity, wide-spread use, and the
family, friends, and social media influencers or opinion     potential for users to follow anyone. We used
leaders, to inform vaccine decisions [2]. Unfortunately,     information diffusion, a widely used method [6] where
online information and information coming from               the reaction to influencer tweets is assessed to define
opinion leaders have been found to often provide             social media influencers. Through social network
inaccurate and misleading information [3]. Outside of        analysis, we identified Twitter vaccine-information
the vaccine-hesitant community, information is driven        (pro- and antivaccine) communities and their
by scientific evidence but this evidence is often misused    geolocations. We focused on tweets for three childhood
in vaccine-hesitant communities [4]. Furthermore,            vaccines, measles, mumps, rubella (MMR); tetanus,
research finds that if current trends continue, anti-        diphtheria, pertussis (Tdap); and human papillomavirus
vaccine views on social media will dominate the online       (HPV). Our goal was to provide insights for public
vaccine discussion within 10-years [5]. This trend is        health researchers and health care professionals on
based on data that shows that while online antivaccine       efficient forms         of locating vaccine-hesitant
groups have fewer followers than online pro-vaccine          communities to better target vaccine communication for
groups, the antivaccine groups are more numerous,            childhood vaccine promotion.
more connected to undecided groups, and growing more
connected at a faster pace.

URI: https://hdl.handle.net/10125/71096
978-0-9981331-4-0                                                                                          Page 3964
(CC BY-NC-ND 4.0)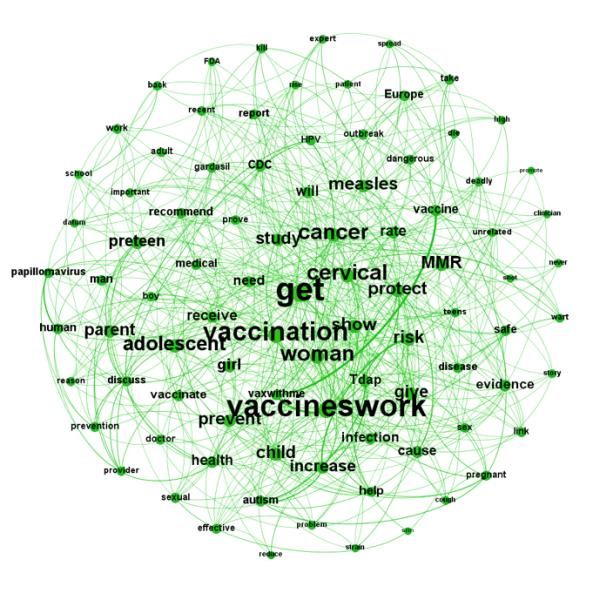
2. Methods                                                was also used to calculate and visualize the social
                                                          networks of the 420 vaccine influencers.
    This study employed social network community
detection and semantic network analysis (SNA) to          2.3. Detecting communities and geolocations
identify pro- and antivaccine influencers, their
communities, and geolocations on Twitter specific to          Modularity, a community detection method that
the three childhood vaccinations previously mentioned.    shows different clusters, or groups, by determining the
A sentiment analysis was performed to assess if Twitter   fraction of links that fall within a given group, was
conversations were negative, neutral, or positive in      employed to detect the communities among the 420
overall sentiment.                                        influencers. As a rule of thumb, modularity of .4 or
                                                          greater indicates the presence of separate communities
2.1. Data collection                                      [8]. Based on their community, each sender’s location
                                                          information was extracted and summarized. The
    Tweets about childhood vaccinations (MMR, Tdap,       location summary included country, and state name, if
HPV) were collected from July 1, 2018, to October 15,     the country was the U.S., for each community. Because
2018. These vaccines were selected to capture more        our data was based on English language tweets, most
widely discussed childhood vaccines (MMR and Tdap)        locations identified were English-speaking countries.
as well as newer vaccine recommendations (HPV).
This timeframe coincided with the peak period of a        2.4. Semantic network analysis (SNA)
measles outbreak in Europe and the growing spread of
measles in the U.S., as well as the start of the U.S.         After cleaning the tweet text data, it was separated
school-year, which requires parents to indicate child     into different files based on each sender’s community.
vaccination status for public school enrollment. This     Text files were preprocessed using ConText [9] to
period included a more recent, at the time, a record-     remove syntactically functioning words and stem
high measles outbreak in Europe which would provide       different forms of the same word. The remaining text
information on how the growing concern was                was analyzed for word frequency. Next, semantic
discussed on Twitter.                                     matrices were generated using the edited texts based on
    Data were collected from Twitter’s Premium API        word co-occurrence.
using Boolean search methods with the keywords,               The basic network data set is an n x n matrix S,
“vaccine,” “vaccination,” “vax,” “shot,”                  where n equals the number of nodes (words) in the
“immunization,” “immunisation,” in combination with       analysis, and sij is the measured relationship between
the three childhood vaccines selected for analysis        nodes i and j with the node serving as the unit of
(MMR, Tdap, HPV). The entire archive of English           analysis. Here, the nodes are identified based on the
language tweets within the noted 15-week period was       weighted frequencies of the words. The measurement
included along with tweet information (i.e. number of     of word co-occurrence is the standard for creating links
retweets, replies, and favorites), and sender             between words in a semantic network. Words were
information, such as geolocation and number of            considered linked if they co-occurred within three
followers.                                                words of each other. The frequencies of word co-
                                                          occurrence were then calculated and ranked. Word
2.2. Identifying influencers                              order, or direction, was not considered in the semantic
                                                          network analysis. Gephi [7] was used to create
    The tweet data was collected, organized, and          semantic networks and their visualizations, as well as
cleaned using R (version 3.4.4). Social media             to assess network measures.
influencers were identified by normalizing retweet
counts, favorite counts, and reply counts of each tweet   2.5. Sentiment analysis
and multiplying the three values per the information
diffusion method. Tweets with values greater than zero        Sentiment analysis from IBM Watson Natural
were selected as an influence measure. This measure       Language Understanding (NLU) [10] was used to
followed a power-law distribution, from which we          assess the percentages of positive, negative, and neutral
obtained the 420 senders with the greatest measured       tweets for each community. NLU uses deep learning to
value and their lists of friends.                         extract metadata from text and identifies the attitudes,
    After collecting the sender’s lists and extracting    opinions, or feelings in the text. This analysis considers
their social connections with followers an edge list of   both the polarity of individual words and the sequence
7,731 connections was created. The edge list was          of the text. Twitter data was used to train NLU making
imported into Gephi [7] for network detection. Gephi

                                                                                                        Page 3965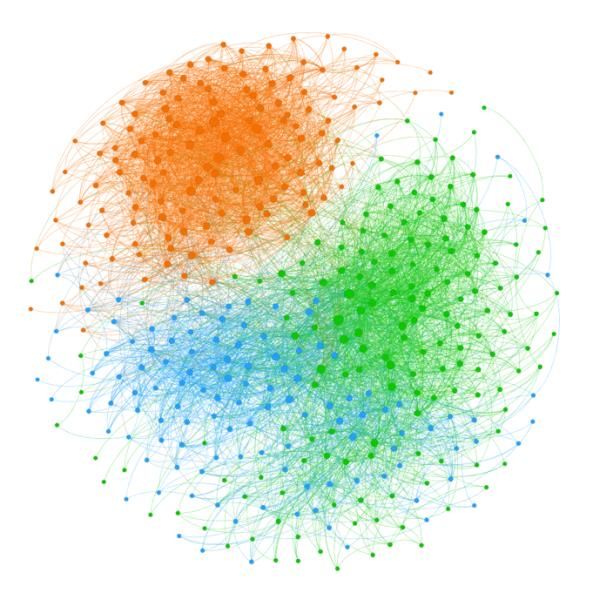
it an especially appropriate sentiment analysis tool for    of the Centers for Disease Control and Prevention
this assessment [11].                                       (CDC). The green community was dominated by
                                                            influencers from California, New York, Texas,
3. Results                                                  Washington D.C., and Maryland. Again, this
                                                            community was comprised of the most populous states
3.1. Community and geolocation detection                    plus the home of both the National Institutes of Health
                                                            (NIH) and the Federal government. The blue
    The community detection algorithm revealed three        community represented influencers from IE and the
distinct communities among vaccine influencers              UK.
(Figure 1). The modularity was .52, indicating
meaningful community detection. While the global                    Percentage of country of origin from
network density was 0.05, the within-community                         Twitter vaccine communities
densities were 0.33 (the orange community), 0.16 (the
green community), and 0.20 (the blue community),             60%
with an average of 0.23, 4.6 times greater than the          50%
overall density, a further indication of separate groups.    40%
Also, the pairwise density was 0.14 for orange and           30%
blue, 0.12 for orange and green, and 0.11 for blue and
green. Lastly, the orange community (5243 tweets)            20%
consisted of 33.81% of the whole network, the green          10%
community (4263 tweets) was 38.57%, and the blue              0%
community (3981 tweets) took the rest at 27.62%.                      Orange         Green          Blue
                                                                     community     community      community

                                                                      USA                    UK
                                                                      IE                     Other countries
                                                                      Unknown

                                                            Figure 2. Country of origin by community

                                                            3.2. Pro- or antivaccine determination

                                                                Influencers were ranked based on their popularity
                                                            score to locate the top 20 influencers from each
                                                            community. The results of the influencer rankings were
                                                            used to identify the community as pro- or antivaccine.
                                                            The Children’s Health Defense, an NGO focused on
                                                            antivaccine activism and headed by Robert F.
                                                            Kennedy, Jr. was the number one influencer in the
                                                            orange community. This influencer was followed by
                                                            three accounts held by individuals with obvious
Figure 1. Influencer community detection results            antivaccine stances. The green community revealed the
                                                            World Health Organization as the top influencer
    Influencer geolocations for each community were         followed by two media organizations and the National
extracted based on their Twitter personal information.      Cancer Institute. Finally, National Health Service, a
The top three countries represented in these                UK health provider, was the blue community’s top
communities were the United States (USA), United            influencer followed by two more government accounts.
Kingdom (UK), and Ireland (IE) (Figure 2). Both the             To further distinguish a community’s stance on
orange and green communities were dominated by              vaccination (i.e. pro- or anti-), we performed a
influencers from the U.S. The orange community was          descriptive analysis for all three identified
made up of influencers from California, New York,           communities based on the top 20 influencer accounts
Texas, Georgia, and Florida. These states include some      for each community. Results showed the orange
of the most populous states in the U.S. plus the home       community to be antivaccine comprised of more
                                                            antivaccine advocates, organizations, and individuals.

                                                                                                           Page 3966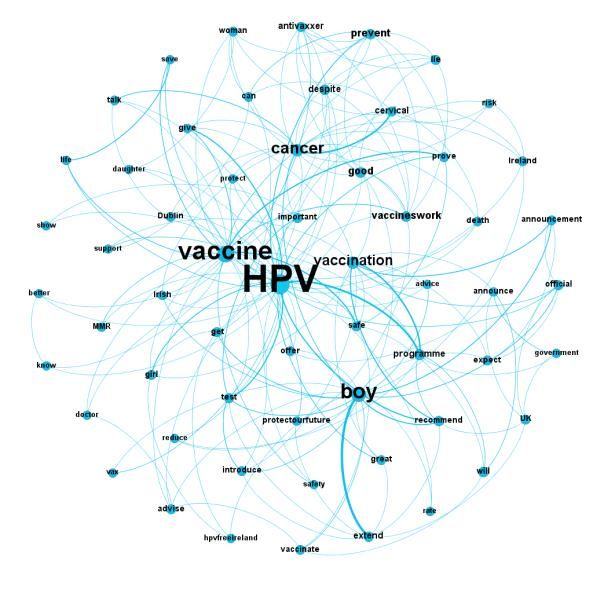
The green and blue communities were largely pro-
vaccine communities with the green community
encompassing more diverse influencer types and the
blue community focusing on vaccination promotion as
a means for preventing cancer.
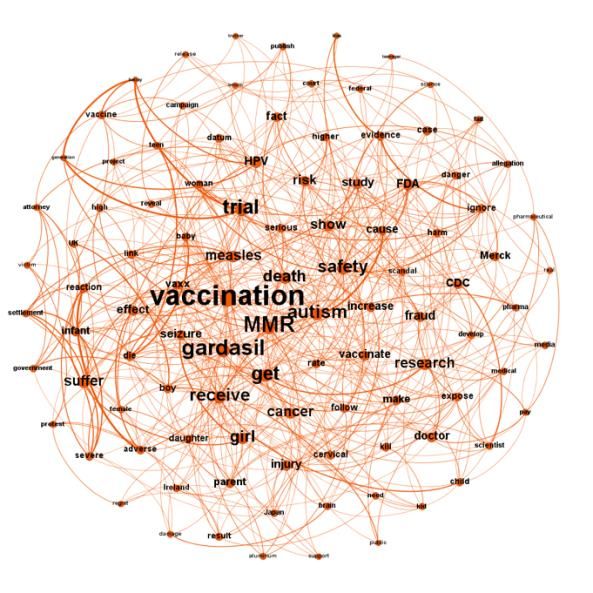
The theme(s) for each community were also
identified based on the top associations in each
community’s semantic network. The orange
community was mostly concerned with highlighting
the dangers of childhood vaccines. The most central
words were vaccination, autism, and MMR (Figure 3).
The green community involved the promotion of the
HPV and MMR vaccines specifically but vaccinations
in general as a means to protect from and prevent
disease. The most central words in the green
community were vaccination, get, and vaccineswork
(Figure 4). The blue community focused on extending
and encouraging vaccination rates for boys in Ireland
for the HPV vaccine. The most central words for this
community were HPV, vaccine, and boy (Figure 5).
For Figures 3, 4, and 5, the size of the word label Figure 4. SNA results for the green community
indicated how frequently the word occurred. The
thickness of each link represented the weight or
number of co-occurrences between two words. The
more closely related the words were, the shorter the
link distance. The color of each semantic network
(based on senders’ network community) matches the
color of their sender network community color.
Figure 5. SNA results for the blue community
3.3. Sentiment analysis
Chi-square tests were conducted to evaluate the
significance of proportional differences among the
Figure 3. SNA results for the orange community communities. Sentiment in the orange community was
the most negative among the three communities (p >
.05). The blue community displayed the most positive
sentiment among the three communities (p > .05) and
the green community presented the most neutral tweets
among the three (p > .05) (Table 1.).
Page 3967Table 1. Sentiment analysis results websites, personal blogs, and parent-organized groups.
The pro-vaccine community, on the other hand,
Sentiment labels frequency (%) circulated news sourced from traditional mainstream
Community Negative Neutral Positive media who obtain information from various reputable
(N) health organizations.
Orange 3108 1677 458 Our study shows that using social media influencers
(5243) (59.28%) (32%) (8.7%) to identify antivaccine Twitter communities can be an
Green 1925 1880 458 effective strategy for targeting vaccine misinformation.
(4263) (45.16%) (44.10%) (10.74%) Rather than monitoring large numbers of tweets, efforts
Blue 2084 1190 704 can be focused on influencers and their communities.
(3981) (52.42%) (29.9%) (17.68%) Moreover, promoting accurate vaccine information
through social media influencer accounts will ensure a
4. Discussion larger number of Twitter users receive the information.
Their large and well-connected networks provide more
This study used the identification of social media efficient information coverage.
influencers to detect Twitter childhood vaccine Like all studies, this research has its limitations.
communities and their geolocations. We confirmed that First, we concentrated our assessment on English-
Twitter social media influencers formed independent language tweets. Twitter conversations on the topic of
communities online around the topic of childhood childhood vaccinations may differ based on language.
vaccination. The stated positions of each Twitter Considering tweets in additional languages would also
community were determined through semantic network likely change the geolocation of tweets. Similarly, this
analysis. The antivaccine community was more research focused on Twitter as opposed to information
connected within when compared to the pro-vaccine from other social media platforms such as Facebook,
communities. Pairwise density results did not show the Instagram, or Weibo. The procedures described in this
antivaccine community as being independent of the pro- study may be generalized beyond public health to assess
vaccine communities further highlighting the different topics within social media where the goal is
interconnectedness of the Twitter antivaccine social influence. One particular case would be to specify
community. This interconnectedness was lacking in the the “echo chambers” that exist in political-ideological
pro-vaccine Twitter communities. These results are in communities.
line with recent research that found pro-vaccine Detecting online vaccine communities and their user
Facebook groups discuss vaccination issues mainly with geolocations through the identification of social media
each other rather than reaching out to vaccine-neutral influencers provides an efficient means for public health
groups or anti-vaccination groups [5]. This is unlike the officials to more accurately target antivaccine and
antivaccine groups that do connect more widely to vaccine-neutral groups to provide accurate vaccine
vaccine-neutral and pro-vaccination groups. information, answer vaccine safety concerns, counteract
According to the semantic network analysis, the vaccine misinformation, and monitor vaccine
anti-vaccine community propagated misinformation misinformation spread more efficiently. Lastly,
about vaccines in addition to using anti-vaccine rhetoric. knowing the geolocation clusters for these communities
This conclusion supports previous research results that provides valuable information for monitoring gaps in
found online anti-vaccine information to include vaccination coverage and may assist in predicting
deceptive vaccine information [12, 13]. Sentiment disease outbreak.
analysis found the majority of tweets to be negative in
sentiment. This can likely be attributed to the more rapid 10. References
spread of negative emotions [14]. Considering that
popular tweets tend to be more negative in sentiment,[1]it [1] A. M. Jones, S. B. Omer, R. A. Bednarczyk, N. A.
can be expected to find more negative tweets across the Halsey, L. H. Moulton, and D. A. Salmon, "Parents' source of
vaccine information and impact on vaccine attitudes, beliefs,
communities assessed. Furthermore, vaccines treat
and nonmedical exemptions," Adv Prev Med, vol. 2012, pp.
diseases, a concept with a generally negative sentiment. 1-8, 2012, doi: 10.1155/2012/932741.
The proliferation of misinformation about vaccines [2] [2] E. K. Brunson, "The impact of social networks on parents'
in antivaccine communities can be largely attributed to vaccination decisions," Pediatrics, vol. 131, no. 5, pp. e1397-
the make-up of the different Twitter vaccine e1404, 2013, doi: 10.1542/peds.2012-2452.
communities. For example, a descriptive analysis of [3]the [3] J. Leask, H. W. Willaby, and J. Kaufman, "The big
top 20 Twitter influencers on childhood vaccination picture in addressing vaccine hesitancy," (in English), Hum
found that the antivaccine community distributed Vacc Immunother, vol. 10, no. 9, pp. 2600-2602, Sep 2014,
information from emerging vaccine-information doi: 10.4161/hv.29725.
Page 3968[4] R. Getman, M. Helmi, H. Roberts, A. Yansane, D. Cutler,[10] [10] IBM, "IBM Cloud API Docs: Natural Language
and B. Seymour, "Vaccine Hesitancy and Online Understanding." [Online]. Available:
Information: The Influence of Digital Networks," (in https://cloud.ibm.com/apidocs/natural-language-
English), Health Educ Behav, vol. 45, no. 4, pp. 599-606, understanding/natural-language-
Aug 2018, doi: 10.1177/1090198117739673. understanding?code=python#sentiment
[5] N. F. Johnson et al., "The online competition between [11] [11] S. Vergara, M. El-Khouly, M. El Tantawi, S. Marla, and
pro-and anti-vaccination views," Nature, 2020, doi: L. Sri, Building Cognitive Applications with IBM Watson
10.1038/s41586-020-2281-1. Services: Volume 7 Natural Language Understanding,
[6] M. Cha, H. Haddadi, F. Benevenuto, and K. Gummadi, ibm.com/redbooks: IBM Readbooks, 2017, p. 110.
"Measuring user influence in twitter: the million follower [12] [12] A. Kata, "Anti-vaccine activists, Web 2.0, and the
fallacy," in Proceedings of the Fourth International postmodern paradigm - An overview of tactics and tropes
Association for the Advancement of Artificial Intelligence used online by the anti-vaccination movement," (in English),
Conference on Weblogs and Social Media, May 23-26, 2010, Vaccine, vol. 30, no. 25, pp. 3778-3789, May 28 2012, doi:
Washington, DC, 2010. Menlo Park, CA: AAAI Press, 2010. 10.1016/j.vaccine.2011.11.112.
Available: [13] [13] M. B. Moran, M. Lucas, K. Everhart, A. Morgan, and E.
https://www.aaai.org/Library/ICWSM/icwsm10contents.php. Prickett, "What makes anti-vaccine websites persuasive? A
[Accessed: September 9, 2018]. content analysis of techniques used by anti-vaccine websites
[7] M. Bastian, S. Heyman, and M. Jacomy, "Gephi: An open to engender anti-vaccine sentiment," Journal of
source software for exploring and manipulating networks.," Communication in Healthcare, vol. 9, no. 3, pp. 151-163,
in Proceedings of the Third International Association for the 2016, doi: 10.1080/17538068.2016.1235531.
Advancement of Artificial Intelligence Conference on [14] [14] S. Tsugawa and H. Osaki, "Negative Messages Spread
Weblogs and Social Media, May 17 – 20, 2009, San Jose, Rapidly and Widely on Social Media," in Proceedings of the
CA, 2009. Menlo Park, CA: AAAI Press, 2009. Available: Advancing Computing as a Science and Profession
https://gephi.org/users/publications/. [Accessed: November Conference on Online Social Networks, November 2 – 3,
11, 2009]. 2015. Palo Alto, CA: Association for Computing Machinery,
[8] V. D. Blondel, J. L. Guillaume, R. Lambiotte, and E. 2015. Available:
Lefebvre, "Fast unfolding of communities in large networks," https://dl.acm.org/doi/proceedings/10.1145/2817946.
(in English), J Stat Mech-Theory E, Oct 2008, doi: [Accessed: November 30, 2018].
10.1088/1742-5468/2008/10/P1008.
[9] J. Diesner, "ConText: Software for the Integrated
Analysis of Text Data and Network Data," in Proceedings of
the Social and Semantic Networks in Communcation
Research Preconference of the International Communication
Association (ICA), May 22 – 26, 2014, Seattle, WA.
Available:
http://context.ischool.illinois.edu/download.php#citing.
[Accessed: November 11, 2009].
Page 3969You can also read