Inferring Political Preferences from Twitter
←
→
Page content transcription
If your browser does not render page correctly, please read the page content below
Inferring Political Preferences from Twitter
Mohd. Zeeshan Ansari1, Areesha Fatima Siddiqui1* and Mohammad Anas1.

Abstract Sentiment analysis is the task of automatic analysis of opinions and emotions of users
towards an entity or some aspect of that entity. Political Sentiment Analysis of social media helps
the political strategists to scrutinize the performance of a party or candidate and improvise their
weaknesses far before the actual elections. During the time of elections, the social networks get
flooded with blogs, chats, debates and discussions about the prospects of political parties and
politicians. The amount of data generated is much large to study, analyze and draw inferences
using the latest techniques. Twitter is one of the most popular social media platforms enables us to
perform domain-specific data preparation. In this work, we chose to identify the inclination of
political opinions present in Tweets by modelling it as a text classification problem using classical
machine learning. The tweets related to the Delhi Elections in 2020 are extracted and employed for
the task. Among the several algorithms, we observe that Support Vector Machines portrays the
best performance.

1 Introduction
Analyzing people’s opinion on political views via surveys and polls is a time consuming and
expensive task. It is impossible for humans to read and summarize all relevant documents and in
terms of the expressed sentiments. Therefore, an automatic political sentiment analysis is required
to deal with a large amount of text data [1]. People engaging in political issues actively are relying
more on online sources to get informed about the latest news and events [2]. The use of social
media such as Twitter has changed the way people express their views, feelings, opinions and this
user-generated content in form of blogs, posts, tweets etc. are easily available publicly in an
unstructured format. Twitter provides a platform to share and express political thoughts which
have a huge impact on the political sphere in India. Twitter users mainly comprise of the educated
class, political figures, prominent personalities which are influencers, are fewer in number when
compared to the population of India. Their sentiments and opinion are considerably able to affect
their follower’s belief and opinions [21].
    In this work, we queried the Twitter for scraping tweets that are related to Delhi Elections
2020 by using specific hashtags. We analyzed the tweets and labelled the polarity of sentiments of
each tweet with respect to the major political parties taking part in elections. A total of 6060
tweets were collected and preprocessed into the relevant dataset including removal of all the noise
that is present in the social media text. We carried out annotations on the extracted tweets by
categorizing them into distinct sentiments classes as in favour or against a party or an alliance.
Subsequently, we modelled the problem as a classical text classification problem and investigated
the performances of several algorithms on the prepared dataset. The structure of the paper is as
follows, Section 2 consists of the study of work that been has done in the past related to our topic
of research. Section 3 elaborates the corpus acquisition method and theoretical dimensions to
specify the adopted approach for our research. Section 4 and 5 consists of the procedure of
experiments and the results obtained. Finally, in Section 6 we conclude the work done.

 __________________________________
 Mohd. Zeeshan Ansari
 e-mail: mzansari@jmi.ac.in
 Areesha Fatima Siddiqui
 e-mail: areeshaf7@gmail.com
 Mohammad Anas
 e-mail: anas.1633.m@gmail.com

 1
  Dept. of Computer Engineering, Jamia Millia Islamia, New Delhi 110025, India.
M. Zeeshan Ansari et al.
2 Related Work
There is a large increase in the availability of data in the form of text and documents that
expresses the opinion of people which can be used for sentiment analysis and work in this field
has grown rapidly [23]. The interest in analyzing a large amount of data produced around the
world is generated due to the research on network and social media analysis and these data
collected can be examined to discover interactions and behavioural patterns and have a better
understanding of issues which are unrelated [3,22]. The sentiment in Twitter has been done in the
domain of stock markets, politics and social movements for prediction and measurement [4, 5].
With the increase in the involvement of citizens in the electoral process empowers the democratic
process on different levels and brings forward a new environment [6]. Prati and Hung (2017) [10]
evaluated the exchanging of texts having a “defined ideological load”, and the citizen contribution
on Twitter during the Spanish electoral process in which they analyzed classes of segregation
noticed in political orientations in messages that were posted digitally and they also considered
event timelines [9, 14]. The volume of tweets on Twitter about the political affiliations was found
out to be a good estimator in the 2009 German Elections while to detect the candidates in
Singapore’s 2011 national election by Twitter sentiment analysis was a failure [5, 11]. Colleoni et
al. (2014) used classical learning and social media analysis approach to predict party preferences
in an American Democratic and Republican voters database [15]. Several statistical approaches
for democratic ideology estimation based on ideological stance and alignment of the traditional
approaches to Twitter as a new source of data over the political campaign and keeping a track of
people’s behaviour and perception as the campaign developed over the time.
Sentiment classification is in a two-step task wherein the primary step, the data (tweets)
relevant to our work is being collected and subsequently, in the second step, the sentiment from
the data collected is being extracted. Relevant tweets contain words from a list of target keywords
compiled either manually or semi-automatically from expanding a seed set [11]. Once the set of
such messages has complied, several approaches are applied which are used to obtain the
sentiment of the text. Unsupervised methods depend on a list of ‘positive’ and ‘negative’
keywords, which estimate a sentiment on the basis of the ratio of occurrences of keywords with
respect to one another or just by counting the occurrence of each word concerning each other [5,
12]. Advanced approaches employ supervised learning techniques and train prediction models on
either tweet classified manually or on the tweets which have an emotional context [8, 13, 16]. A.
Jain and P. Dandannavar (2017) research study focuses on the combination of a lexicon-based
method and a machine learning-based algorithm to define a mixed approach for performing
sentiment analysis [17]. V. Sahayak et al. (2015) research studies intended to make it effortless
for the companies to collect the feedback about the products they sell and for the customers who
want to get other’s opinions about a product prior to purchasing it [20]. Other research studies
were focused on the conventional authorities of media, campaigns for elections, voter’s social
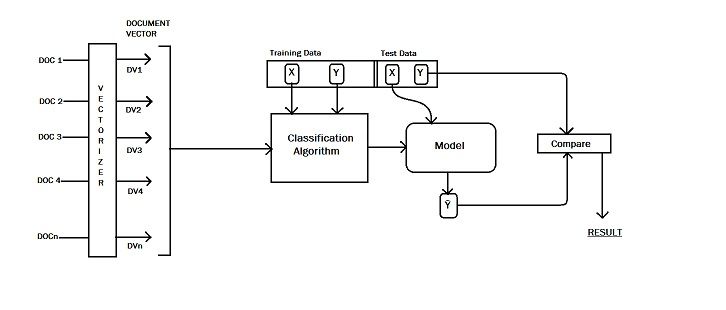
engagement and movement [18, 19].Inferring Political Preferences from Twitter 3 Proposed Method 3.1 Political Corpus Preparation The scraping of the politically inclined tweets from Twitter is carried using the automatic tool. The extraction of tweets is based on the hashtags and twitter account of popular politicians of respective political parties focused on Delhi Elections 2020. The hashtags that were used are: #DelhiElections2020 #DelhiPolls #delhielections etc. Total 6060 tweets related to Delhi Elections 2020 were obtained in the process for this task. The collection of tweets is significant to three major political parties which were mainly participating in Delhi Elections. We labelled the polarity of sentiment in tweets for every party and incorporated the inclination of a tweet towards or against the political party. All the tweets under consideration are updated and tweeted from Sept 2019 to January 2020. Fig. 1. The Text Classification Framework. 3.2 Preprocessing Prior to analyzing the political inclination of sentiments in extracted tweets, we cleaned them into proper form for retrieving the relevant features required for successful classification. Several steps were taken to clean the tweets and remove the unwanted data such as (i) removing the username of the user who tweeted, (ii) all phone numbers, (iii) RT stands for retweets, (iv) all punctuation, (v) all trailing spaces, (vi) replacing every email id with “emailaddr”, (vii) all break and white spaces with single space, (viii) every URL with “urladdr”, (ix) all currency symbol with “moneysymb”, (x) all numbers with “numbr” and (xi) converting all text into lowercase.
M. Zeeshan Ansari et al.

                                    Table 1. Sentiment Classes.

                                      Class       Sentiment
                                        1         Support P1
                                        2         Oppose P1
                                        3         Support P2
                                        4         Oppose P2
                                        5         Support P3
                                        6         Oppose P3
                                        7         Non Relevant
                                        8         None

3.3 Annotation

After the preprocessing of tweets, annotation of tweets was performed in which each tweet was
given a label according to its polarity of sentiment. Being considerably mindful of the electoral
politics, the sentiment either positive or negative towards the respective political party or leader
was identified for each tweet. We considered three political parties i.e. P1, P2 and P3 as primary
parties because the majority of tweets were focused on these three parties for Delhi Elections
2020. The classes to which the cleaned tweets are labelled are present in Table 1.

     Taking into consideration the approach similar to Wilson et al. (2005) we prepare the
sentiment analysis model [7]. The tweets were labelled to eight different classes which are defined
as follows: the tweet that supported and opposed party P1 was given class 1 and class 2
respectively. Similarly, classes 3 and 4 were given to tweets that supported and opposed party P2
and classes 5 and 6 were given to tweets that supported and opposed party P3. Instead of
discarding the non-relevant annotations, they were assigned to a proper class (class 7) to analyze
the dissemination of political and non-political tweets. The tweets that did not support or oppose
any political party but were related to Delhi Elections were given class 8. There are some tweets
which can belong to more than one class so for our annotation we labelled the tweet into the
supporting sentiment taking the standard that support has a higher preference than opposing. The
manually annotated corpus achieved the inter-annotator agreement over 97.3%. Each cleaned
tweet is considered as a document for text classification. After using NGrams, the document
vectors (DV1, DV2,…DVn) are formed. The vectorized data is then sent for training different
classification algorithms such as Random Forest, Support Vector Machines, Logistic Regression
and Naïve Bayes. After running classification algorithms on training data, models are built and
their performance is compared.
     The number of tweets extracted is 6060 and after categorizing the tweets into the respective
classes according to their polarity of sentiment, the total number of tweets that belonged to each
class is presented in Table 2. The analysis of annotated corpus shows that 17.06% of total tweets
belong to a class that supports party P1, while 14.46% of tweets belong to a class that oppose
party P1. The percentage of tweets that oppose party P2 is 13.04% and that support party P2 is
drastically less percentage of 4.85%. The percentages of tweets that support and oppose party P3
are very less to a combined percentage of 1.48%.
Inferring Political Preferences from Twitter
Table 2. Corpus Statistics.
Sentiment Classes #tweets per class % of tweets in each class
1(Support P1) 1034 17.06
2(Oppose P1) 876 14.46
3(Support P2) 294 4.85
4(Oppose P2) 790 13.04
5(Support P3) 37 0.61
6 (Oppose P3) 53 0.87
7 (Non Relevant) 623 10.29
8 (None) 2353 38.82
Total 6060 100
4 Simulation and Experimental Results
4.1 Feature Extraction
N-gram language modelling is a significant probabilistic technique to extract essential features
from a sample of text. We used unigrams, bigrams, trigrams and tetragrams of the tweets and
created N-grams as presented in Table 3. The Term Frequency-Inverse Document Frequency
being a significant method to convert a collection of raw documents to relevant features. It is
denoted as tf-idf, tf-idf1, tf-ifd2, tf-idf3 respectively.
4.2 Classification Algorithms
The classification algorithms employed for this task encompass the different approaches to
classification such as probabilistic models, ensemble methods, kernel methods etc.
Support Vector Machine. Support Vector Machine was first put forward by Cortis and Vapnik in
1992. It is a supervised learning model that can be used for classification, regression and outlier
detection. Support vector machine is highly preferred as it has a simple structure and produces
results with significant accuracy and less computation power. SVM also does not require a large
number of features.
Random Forest. A Random Forest is a classification model that consists of a collection of tree-
structured classifiers. It is an ensemble learning method that operates by constructing multiple
decision trees at training time and giving the output as the class that is the most suitable for input
x.
Logistic Regression. Logistic Regression is widely used to examine and define a relationship
between a response variable, which is binary in nature, and a set of predictor variables. Logistic
Regression fits data to a logit function and predicts the probability of occurrence of an event;
therefore it is a type of predictive analysis. It is used for classification problems.
Naïve Bayes. Naïve Bayes is a collection of probabilistic classifiers that are based on Bayes
theorem. In Naïve Bayes, every pair of feature classified is independent of each other and gives anM. Zeeshan Anasri et al.
equal contribution to the outcome. It is used for the classification problem. It requires fewer
amounts of training data to estimate the necessary parameters.
Table 3. Count of N-grams.
N-grams Total number of N-grams
Unigrams 6081
Bigrams 22468
Trigrams 42879
Tetragrams 50236
Table 4 shows a comparison of performance for different classifiers Random Forest, Naïve Bayes,
Support Vector Machine and Logistic Regression with respect to different features like bigrams,
trigrams and tetragrams. The performance of Support Vector Machine is best when compared to
other classifiers in unigram. Support Vector Machine with tf-idf-unigram exhibit a precision of
.85 while with tf-idf-bigram, the precision is 0.83. The precision of SVM with tf-idf-trigram and
tf-idf-tetragram is 0.82. The recall and F1-score of Support Vector Machine are highest compared
to others which is equal to 0.85 in tf-idf-unigrams. The performance of Naïve Bayes classifier is
worst when compared to all classifiers. The precision for Naïve Bayes is least for unigram which
is 0.79. Precision for Naïve Bayes is better than the precision of Logistic Regression for tetragram
model whereas the same for trigrams.
Table 4. Performance of classifiers over various features
N=1 N=2 N=3 N=4
P R F P R F P R F P R F
Random Forest 0.84 0.83 0.83 0.81 0.79 0.79 0.80 0.77 0.77 0.81 0.76 0.76
Naïve Bayes 0.79 0.78 0.77 0.80 0.78 0.77 0.81 0.78 0.77 0.81 0.78 0.77
SVM 0.85 0.85 0.85 0.83 0.82 0.82 0.82 0.80 0.80 0.82 0.80 0.80
Logistic Regression 0.83 0.82 0.81 0.81 0.78 0.77 0.81 0.76 0.76 0.80 0.75 0.74
5 Conclusion
In this paper, several classification methods for sentiment analysis are examined on political
tweets obtained from active users. We exploited the sentiments keywords significant to major
political parties in the tweets with respect to Delhi Elections 2020 and successfully annotated the
corpus. The prepared annotated corpus from Twitter is used for political analysis. The data
analysis significantly shows both, the supporting and opposing opinions of a substantial amount.
The Support Vector Machine reports the highest precision, recall and F1 score among all the
algorithms. The tweets collected at large undoubtedly represent a fraction of the actual population
participating in the election process. Therefore, enormous attention is required for the sampling of
data and generalization of models developed using the social media text. The performance of the
models and the overall result can be enhanced by expanding the corpus with the incorporation of a
large number of tweets and learning domain-specific keywords.References
[1] Ringsquandl, M., Petković, D.: Analyzing Political Sentiment on Twitter. In. 2013 AAAI Spring
Symposium Vol. SS-13-01 (2013).
[2] Najar D., Mesfar S.: Opinion mining and sentiment analysis for Arabic on-line texts: application on the
political domain. In. International Journal of Speech Technology 20(1):1-11. DOI: 10.1007/s10772-
017-9422-4 (2017).
[3] Xu G, Li L.: Social media mining and social network analysis: emerging research and information.
Science reference. IGI Global, Hershey. DOI: 10.4018/978-1-4666-2806-9 (2013).
[4] Bollen, J., Mao, H., & Zeng, X.: Twitter mood predicts the stock market. In. Journal of Computational
Science. doi: 10.1016/j.jocs.2010.12.007 (2011).
[5] Choy, M., Cheong, L. F. M., Ma, N. L., & Koo, P. S.: A sentiment analysis of Singapore Presidential
Election 2011 using Twitter data with census correction. In. Research Collection School Of Information
Systems (2011).
[6] Wagner KM, Gainous J.: Digital uprising: The internet revolution in the Middle East. In. J Inf Technol
Politics. doi: 10.1080/19331681.2013.778802 (2013).
[7] Wilson T., Hoffmann P. and Wiebe J.: Recognizing Contextual Polarity in Phrase-Level Sentiment
Analysis. In. Proceedings of the 2005 Conference on Empirical Methods in Natural Language
Processing (EMNLP) (2005).
[8] Wang H., Can D., Kazemzadeh A., Bar F., Narayanan, S.: A System for Real-time Twitter Sentiment
Analysis of 2012 U.S. Presidential Election Cycle. In. Proceedings of the ACL 2012 System
Demonstrations. Pages 115-120 (2012).
[9] Gruzd A., Roy J.: Investigating Political Polarization on Twitter: A Canadian Perspective. In. Policy
and Internet Vol. 6 Issue 1 Pages 28-45 (2014).
[10] Prati, Ronaldo, Hung S., Elias: Predicting the ideological orientation during the Spanish 24M elections
in Twitter using machine learning. In. AI & Society 2017. doi- 10.1007/s00146-017-0761-0 (2017).
[11] Tumasjan, A., Sprenger, T. O., Sandner, P. G., & Welpe, I. M.: Predicting Elections with Twitter: What
140 Characters Reveal about Political Sentiment. In. Proceedings of the Fourth International AAAI
Conference on Weblogs and Social Media (2010).
[12] O’ Connor B, Balasubramanyan R. Routledge BR, Smith NA: From tweets to poll: linking the text
sentiment to public opinion time series. In. Proceedings of the ICWSM Conference (2010).
[13] Conover M, Gonc alves B, Ratkiewicz J, Flammini A, Menczer F.: Predicting the political alignment of
Twitter users. In. Proceedings of SocialCom/PASSAT conference, pp 192-199 (2011).
[14] Elmer G: Live research: Twittering an election debate. In. New Media Soc. doi:
10.1177/1461444812457328 (2012).
[15] Colleoni, E., Rozza, A., & Arvidsson, A.: Echo chamber or public sphere? Predicting political
orientation and measuring political homophily in Twitter using big data. In. Journal of
Communication. doi: 10.1111/jcom.12084 (2014).
[16] Chambers, Bowick: Learning for micro blogs with distant supervision: political forecasting with
Twitter. In. Proceedings of the 13th Conference of the European Chapter of the Association for
Computational Linguistics (2012).
[17] Dandannavar P., Jain A.: Application of Machine Learning Techniques to Sentiment Analysis. In. IEEE
2nd International Conference on Applied and Theoretical Computing and Commuication Technology
iCATccT (2017).
[18] Koc-Michalska K., Gibson R. & Vedel T.: Online Campaigning in France, 2007–2012: Political Actors
and Citizens in the Aftermath of the Web.2.0 Evolution. In. Journal of Information Technology &
Politics. doi: 10.1080/19331681.2014.903217 (2014).
[19] Fominaya CF: Social movements and globalization: how protests, occupations ad are changing the
World. In. Palgrave Macmillan, New York (2014).
[20] Sahayak V., Pathan A., Shete V.: Sentiment analysis on Twitter data. In. International Journal of
Innovative Research in Advanced Engineering, Vol. 2, 178-183 (2015).
[21] Ansari M. Z., Aziz M. B., Siddiqui M. O.: Analysis of Political Sentiment Orientations on Twitter. In.
Procedia Computer Sience, Volume 167, 2020, Pages 1821-1828 (2019).[22] Ansari M.Z., Khan S., Amani T., Hamid A., Rizvi S.: Analysis of Part of Speech Tags in Language
Identification of Code-Mixed Text. In. Advances in Computing and Intelligent Systems. Algorithms for
Intelligent Systems. Springer, Singapore (2020).
[23] Pang, B. & Lee, L.: Opinion Mining and Sentiment Analysis. Foundations and Trends in Information
Retrieval. In. Foundations and Trends in Information Retrieval Vol. 2, No 1-2 1–135 (2008).You can also read