Visual Misinformation on Facebook
←
→
Page content transcription
If your browser does not render page correctly, please read the page content below
Visual Misinformation on Facebook

                Yunkang Yang1, Trevor Davis2 and Matthew Hindman3
                    1
                      The George Washington University, DC 20052, USA
                             1
                               CounterAction, DC 20009, USA
                    2
                      The George Washington University, DC 20052, USA

       Abstract. Misinformation conveyed through images has been found to be more
       persuasive, more likely shared on social media, and a key component of state-
       sponsored influence campaigns. But there has been no study of visual misinfor-
       mation on Facebook, with previous studies instead examining the sharing of links
       to fake news sites. We conduct the first study of visual misinformation on Face-
       book, focusing on the three months preceding the 2020 US election. We construct
       a corpus of 13,284,364 image posts shared across 14,532 US public pages and
       11,454 US public groups, which is estimated to contain at least 94 percent of US
       politics image post interactions. 23 percent of a random sample of 1000 image
       posts about US politics contained elements of misinformation. A 1000 posts sam-
       ple from a subset of 572,857 images containing the likeness of the top US polit-
       ical figures using AWS’s Rekognition computer vision showed a similar result.
       Both random images and political figure-containing images show enormous par-
       tisan asymmetry, with right-leaning images classified as misleading 5 to 8 times
       more often than left-leaning images. Using perceptual hashing, we identify and
       analyze the 300 most widely shared images. We show that Facebook groups with
       fewer members are more likely to post misinformation, but there is no significant
       relationship between misinformation and post engagement once group member-
       ship size is controlled for. Misinformation images in our samples often contained
       additional problematic elements, including the dehumanization of political oppo-
       nents, calls for political violence, and the use of sexist imagery to demean female
       politicians.

       Keywords: Misinformation, Visual, Facebook

1      Introduction

Research suggests that misinformation containing images may be both more persuasive
and more likely to be shared than textual disinformation and that news stories with im-
ages produce both stronger framing effects and larger impacts on behavioral intentions
(Hameleers et al. 2020; Wardle 2017). Social media audience data also suggests that
visual content is more likely to be shared than textual content (Tucker et al., 2018).
   Worryingly, visual disinformation has also been a key component of state-spon-
sored influence campaigns. For instance, the Internet Research Agency (IRA), a state-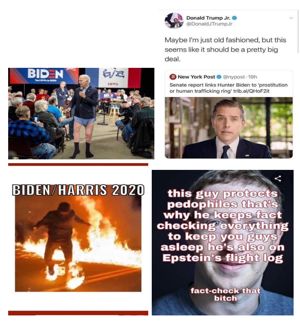
2

sponsored propaganda entity in Russia, relied heavily on images and memes in its ad
campaign against US voters on Facebook and Instagram in 2016 (Mueller 2019).
    Despite the importance of image in spreading falsehoods on social media, most
studies to date have focused on individual users’ sharing of text-based URLs from
fake news sites to estimate the prevalence of misinformation. During the 2016 US
election, it was estimated that 6.7% political URLs shared by individuals on Twitter
came from fake news sites (Grinberg et al., 2019) and 8.5% of users shared at least
one link from fake news sites on Facebook (Guess et al., 2019). In 2018, it was esti-
mated that 15% of URLs shared more than 100 times by individual users in the US on
Facebook came from low-quality news sites (Guess et al., 2021). The method of de-
fining and estimating misinformation at the URL or the publisher level has led schol-
ars to conclude that “the overall magnitude of the misinformation problem may have
declined” on Facebook post 2016 (Allcott et al., 2019, p. 2) and that “fake news con-
sumption is a negligible fraction of Americans’ daily information diet” at the scale of
the information ecosystem (Allen et al., 2020, p. 4).
    However, we believe that these studies may have significantly underestimated the
prevalence of misinformation on Facebook for two reasons. First, previous studies
have not focused on Facebook public pages and groups. Facebook pages can have
millions of followers, and maximum group size is unlimited, while users are limited
to 5,000 friends. Second, previous research on the platform has focused exclusively
on URLs to fake news sites, instead of misinformation conveyed through images. Our
data show that image posts make up more than 25% of all non-video Facebook page
posts (i.e., status post, link post, and image post combined).
    There is no published large-scale study about visual misinformation on the Face-
book platform. Only two papers with overlapping authors relied on systemic collec-
tion of non-simulated empirical data of images at scale on WhatsApp. Reis et al.
(2020) collected some 550,000 images from public WhatsApp political groups in Bra-
zil and India and found that a significant portion of image misinformation was shared
even after being fact checked. In follow-on analysis, Garimella and Eckles (2020)
similarly analyzed 1.6 million images from public WhatsApp groups in India and
showed the high prevalence of image misinformation.
    In this study, we aim to provide valid, platform-wide estimates of the prevalence of
image-based US political misinformation on Facebook during the three months lead-
ing up to the 2020 US general election. First, we built a list of the most widely fol-
lowed Facebook public pages and groups to ensure nearly platform-complete cover-
age of US-based political pages and groups. To do so, we combined manual labeling
with Google AutoML text models to identify 57,816 US political pages and 14,056
political groups. Second, we used AWS Rekognition to identify image posts that con-
tain the likeness of the top 100 US political figures. We manually labeled a random
sample of 1000 posts. Third, we created a corpus of 13,284,364 image posts from the
groups and pages that published at least one image of US top political figures. Then,
we manually labeled a random sample of 1000 posts. We also used perceptual hash-
ing to identify most shared images and manually labeled the top 300 most shared im-
ages from these groups and pages respectively.

                                                                                       2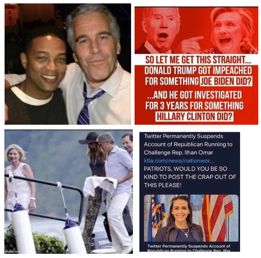
3
2 Results
First, visual misinformation is highly prevalent on Facebook. In the random sample of
1000 image posts about US politics, 226 contained elements of misinformation. We
found four main types: 1) doctored images, 2) memes with misleading texts, 3) images
placed in misleading posts, and 4) screenshots of misleading texts. Figure 1 shows one
example from each category.
Fig. 1. Types of visual misinformation (Top left: A doctored image of Jeffrey Epstein and Don
Lemon; Top right: memes of Biden and Clinton with misleading texts; Bottom left: an image of
Chris Wallace with George Clooney with post claiming “Chris Wallace, Getting On Another
Boat With Epstein”; Bottom right: A screenshot of misleading texts).
Second, visual misinformation is highly asymmetric across party lines. In the 1000
image post random sample, we found 516 right leaning image posts and 413 left leaning
posts. About 39% of right leaning image posts contained elements of misinformation
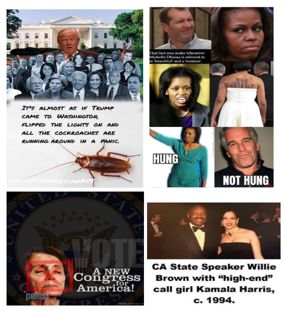
whereas the number is only 5% on the left. Figure 2 presents four examples with each
representing a major misinformation theme.
Fig. 2. Major themes of visual misinformation.
On the left is an image that portrayed Joe Biden as senile; on the right is an image
that repeated a false claim about Biden’s son Hunter Biden. The bottom left image
shows that the Democratic ticket endorsed riots in the aftermaths of the killing of
George Floyd. The bottom right image is associated with QAnon.
The results from three other samples are largely consistent with the findings about
the prevalence and asymmetry of visual misinformation. Among a random sample of
1000 image posts of US political figures, about 20% contained misinformation. While
34
30% of right leaning image posts were misleading, only 6% on the left contained ele-
ments of misinformation.
We also labeled the top 300 most widely shared images from groups and pages re-
spectively. For groups, about 30% of images about US politics were misleading; while
40% of right-wing images were misleading, only about 3% of left-wing images were
misleading. For pages, about 26% contain elements of misinformation. While 39% of
right-wing images were misleading, only 3% of left-wing images contained elements
of misinformation.
Third, we found that misleading image posts did not have significantly more engage-
ment than non-misleading image posts when the size of group/page membership is con-
trolled. We regressed the binary variable misinformation (n=1000) on total engagement
at the post level, which is the sum of likes, shares, comments, and 6 other emoji cate-
gories, and controlled for the membership size of the group or page that posted the
image. As documented Table 1, there is no statistically significant relationship between
misinformation and the image post’s total engagement.
Table 1. Regression coefficients (n=1000)
Total Engagement
Membership Size 0.002*** (0.0002)
Misinformation -28.9
Fourth, we also found other types of problematic images beyond misinformation.
Female political figures, Kamala Harris and Michelle Obama in particular, were a fre-
quent target of sexism. In addition, we found extreme imagery that dehumanized polit-
ical opponents and advocated violence against them. In Figure 3, we present two ex-
amples of extremist images and two examples of sexist images. The top image on the
left depicted Democrats as cockroaches, an analogy historically used to justify genocide
against ethnic groups in Rwanda. The bottom left image put Nancy Pelosi in a crosshair.
On the top right is a doctored image that added a penis in Michelle Obama’s pants. On
the left right is an image that falsely claimed that Kamala Harris slept with Willie
Brown for money.
Fig. 3. Sexist and extremist images.
45
3 Discussion
This paper is the first scholarly attempt to provide valid, platform-scale estimates of
the prevalence of visual disinformation on Facebook -- and indeed, the first study on
any social media platform to estimate the scale of US politics-focused visual misin-
formation. Our data show that misleading images are highly pervasive on Facebook,
with more than 20 percent of image posts about US politics containing elements of
misinformation. Contrasted with the previous finding that the sharing of misleading
“fake news” URLs by individual users was rather rare, our study shows misleading
images are much more common. Visual misinformation shared by public pages and
groups is likely the largest source of Facebook misinformation. Consistent with previ-
ous studies that showed partisan asymmetry in the sharing of misinformation on so-
cial media, our study shows that right-leaning image posts are 5 to 8 times as likely
to be misleading as left-leaning image posts. We believe political misinformation con-
tinues to be a disproportionate right-wing phenomenon on Facebook. Our data also
show that visual misinformation about female political figures is intertwined with sex-
ism and misogyny on Facebook. The most prominent target of sexist misinformation
during the 2020 selection season was Kamala Harris. In our data, Harris was fre-
quently compared to a prostitute that slept her way up into her political positions. We
also found numerous instances of extremist imagery that depicted Democrats as evil,
anti-American, traitors, and even cockroaches. Such extremist speech that dehuman-
ized political opponents is more problematic than misinformation.
It is difficult to imagine any additional analysis that could alter our core findings.
They hold across both an ultra-broad set of posts by tens of thousands of pages and
groups, and within the much narrower set of images with the likeness of US political
figures. Nor can they be attributed to an unrepresentative corpus: the collected posts
we analyze account for the overwhelming majority of image post engagement on Fa-
cebook.
Our research adds to a growing body of work demonstrating the critical importance
of studying visual and multi modal communication. Repeated calls for more research
in this area have not been met with a corresponding increase in published work. Or
methods demonstrate that new, technologically enabled approaches based on machine
learning can help fill that gap, scaling up traditional communication research ap-
proaches such as content analysis.
Ultimately, our results raise profound concerns about Facebook’s impact on demo-
cratic politics. Right-wing pages and groups, especially, are still posting a tsunami of
falsehoods on the platform. The scale of the misinformation documented here dwarfs
any glib responses about the so-called “marketplace of ideas”, or the virtues of demo-
cratic debate. The very pervasiveness of visual misinformation on Facebook makes its
impacts difficult to measure, but they are likely to be highly corrosive to democratic
self-government.
56
4 Materials and Methods
4.1 Data collection
Our approach to ultra-large-scale collection of image posts on Facebook starts with a
list of the most widely followed Facebook pages and public groups. The main goal is
to ensure nearly platform-complete coverage of US political public pages and groups.
We achieved this by 1.) Using the native Facebook feature which allows pages and
groups to “like” or endorse other pages or groups. 2.) Crossover in participation among
group members. 3.) Searching for relevant content using the CrowdTangle API, and
then adding those groups and pages. Page/group location is either inferred by the loca-
tion of members with public profiles, or by machine learning language detection on
100+ posts with more than 120 characters. Additional quality control is provided by
checking the resulting classifications against the Facebook page categories. Any page
or group which automated methods suggested was misclassified was manually re-
checked. The constant addition of new pages and groups, and the deletion and suspen-
sion of old groups, means that the group/page list is dynamic, and with the exact number
of pages covered a function of the specific date range and location chosen. All image
posts and related data are collected through Facebook subsidiaries such as CrowdTan-
gle or through properly licensed data vendors. No data is scraped. 57,816 pages and
14,506 public groups with an inferred location in the US published at least one image
post in August, September, or October 2020. We believe our data has near complete
coverage of all top political public pages and groups.
4.2 Sampling strategy
We are mainly interested in the content posted by political groups and pages that were
politically active in August, September, and October 2020. Hence, we selected political
groups and pages that posted at least one image of top 100 US political figures during
the three months period. To create the top 100 US political figure list, we first used
AWS Rekognition -- a facial recognition service -- to identify the likeness of public
figures in all images. We then ordered the names by the number of times they appeared
in images, and manually selected top 100 US political figures. Our overall sample of
image posts from political groups and pages during the three-month period contains
13,284,364 posts in total, in which 11,107,209 posts with 5,572,797 unique images
came from 11,454 political groups and 2,177,155 posts with 1,461,000 unique images
came from 14,532 political pages. Within this sample, we created a sub-sample of im-
ages of US political figures: it has 572,857 posts in total, in which 413,666 posts with
150,945 unique images came from political groups and 158,921 posts with 89,111
unique images came from political pages. From the overall image post sample, we drew
a random set of 4000 image posts. Based on the 4000 posts, we identified 1000 posts
(Sample 1) about US politics. In addition, we drew a random sample of 1000 image
posts (Sample 2) from the US political figure sub-sample. Furthermore, we applied
perceptual hashing to the overall image post sample and identified the top 300 most
67
widely shared images from groups and pages respectively (Sample 3 and 4). These four
samples were manually coded based on the following procedures.
4.3 Coding Procedure
Two expert coders coded the four samples independently. Intercoder reliability was
assessed on the top 100 most widely shared image posts from pages. Two variables
were coded, misinformation and partisanship. Inter-coder agreement exceeded 90%
with Krippendorff’s alpha at 0.78 for the misinformation variable and 0.73 for the par-
tisanship variable.
We consider an image post as containing elements of misinformation if it pro-
motes unsubstantiated conspiracy theories, spreads elements of known political disin-
formation campaigns, makes claims that are falsifiable, or places facts in a misleading
context where an average news consumer, without deliberate fact checking, would
reach a false conclusion. When labeling image posts, we not only investigated the im-
age itself but also examined the post’s textual content, caption, description, source, and
date posted. We used Google reverse image search and third party fact checkers exten-
sively to assist our coding. Labeling misinformation is a challenging endeavor: it re-
quires that researchers have extensive knowledge of US politics and conduct meticu-
lous fact-checking. Both coders, the two authors of this paper, are experts in US media
and politics, and undertook several rounds of training before labeling image posts. For
edge cases that borderline misinformation, we took a conservative approach, namely
labeling all partisan exaggerations and hyperbole as non-misinformation unless they
are tied to specific falsifiable examples. We also exclude satire and humor.
We evaluated the partisan lean of image posts based on issue stance or the partisan
affiliation of political figures. An image that expresses support for partisan issues such
as LGBTQ, Black Lives Matter, minimum wage, or gun control was labeled as “left”
whereas one that takes the opposite position was coded as “right”. In addition, Images
that criticize Republicans were coded as left and those that criticize Democrats were
coded as right. We are aware that some criticisms of political figures might come from
their own party members. Yet, given the context of our data, namely three months be-
fore the general election when both parties consolidated their support behind their nom-
inees, we labeled all negative posts about the Democratic ticket as “right” and the Re-
publican ticket as “left”.
References
1. Allcott, H., Gentzkow, M., & Yu, C. (2019). Trends in the diffusion of misinformation on
social media. Research & Politics, 6(2), 2053168019848554.
2. Allen, J., Howland, B., Mobius, M., Rothschild, D., & Watts, D. J. (2020). Evaluating the
fake news problem at the scale of the information ecosystem. Science Advances, 6(14)
3. Garimella, K., & Eckles, D. (2020). Images and misinformation in political groups: evidence
from WhatsApp in India. arXiv preprint arXiv:2005.09784.
78
4. Grinberg, N., Joseph, K., Friedland, L., Swire-Thompson, B., & Lazer, D. (2019). Fake news
on Twitter during the 2016 US presidential election. Science, 363(6425), 374-378.
5. Hameleers, M., Powell, T. E., Van Der Meer, T. G., & Bos, L. (2020). A picture paints a
thousand lies? The effects and mechanisms of multimodal disinformation and rebuttals dis-
seminated via social media. Political Communication, 37(2), 281-301.
6. Guess, A., Nagler, J., & Tucker, J. (2019). Less than you think: Prevalence and predictors
of fake news dissemination on Facebook. Science advances, 5(1), eaau4586.
7. Guess, A., Aslett, K., Tucker, J., Bonneau, R., & Nagler, J. (2021). Cracking Open the News
Feed: Exploring What US Facebook Users See and Share with Large-Scale Platform
Data. Journal of Quantitative Description: Digital Media, 1.
8. Mueller, R. S. (2019). The Mueller report: Report on the investigation into Russian interfer-
ence in the 2016 presidential election. WSBLD.
9. Reis, J. C., Melo, P., Garimella, K., Almeida, J. M., Eckles, D., & Benevenuto, F. (2020,
May). A Dataset of Fact-Checked Images Shared on WhatsApp During the Brazilian and
Indian Elections. In Proceedings of the International AAAI Conference on Web and Social
Media (Vol. 14, pp. 903-908).
10. Tucker, J. A., Guess, A., Barberá, P., Vaccari, C., Siegel, A., Sanovich, S., ... & Nyhan, B.
(2018). Social media, political polarization, and political disinformation: A review of the
scientific literature. Political polarization, and political disinformation: a review of the sci-
entific literature (March 19, 2018).
11. Wardle, C., & Derakhshan, H. (2017). Information disorder: Toward an interdisciplinary
framework for research and policy making. Council of Europe report, 27, 1-107.
8You can also read