Development and validation of an equation to predict total energy expenditure in a sample of Mexican adults
←
→
Page content transcription
If your browser does not render page correctly, please read the page content below
Nutr Clín Diet Hosp. 2021; 41(3):89-96
 Artículo Original                                                                                               DOI: 10.12873/413ortiz

Development and validation of an equation to predict total
energy expenditure in a sample of Mexican adults
Luis ORTIZ HERNÁNDEZ1, César Iván AYALA GUZMÁN2, Rafael Alejandro MARTÍNEZ BOLAÑOS1,
Ricardo LÓPEZ SOLÍS1, Mariana TEJEDA ESPINOSA1
1 Health Care Department, Universidad Autónoma Metropolitana Xochimilco. Mexico City, Mexico.
2 Student, Doctorate in Biological and Health Sciences, Universidad Autónoma Metropolitana. Mexico City, Mexico.

Recibido: 30/abril/2021. Aceptado: 16/julio/2021.

ABSTRACT                                                                 KEYWORDS
   Our aim was to develop and validate an equation to predict              Total energy expenditure; adults; physical activity; resting
total energy expenditure (TEE) based on anthropometric                   energy expenditure; indirect calorimetry; heart rate.
measurements and physical activity questionnaires that can
be applied among non-institutionalized Mexican adults. To                INTRODUCTION
meet this aim, a validation study was conducted with a sam-
                                                                            In clinical practice, algorithms have been established for
ple of Mexican adults (n=115, 37% men) that were randomly
                                                                         the treatment of overweight and obesity1, where an initial en-
divided into two groups to develop and validate new equa-
                                                                         ergy deficit of 500 to 750 kcal/d is recommended to promote
tions to estimate TEE. TEE was measured by indirect
                                                                         healthy weight loss2. This process requires the estimation of
calorimetry and heart rate monitoring for at least three days.
                                                                         TEE. The main components of the TEE are basal energy ex-
These measurements were considered as the reference
                                                                         penditure or resting energy expenditure (REE), diet-induced
method. The predictors of TEE were age, sex, fat and fat-free
                                                                         thermogenesis and physical activity-induced energy expendi-
mass, body weight and physical activity level (PAL), which
                                                                         ture (PAEE)3. The latter can be subdivided into exercise-re-
was assessed with two questions. The accuracy of factorial
                                                                         lated activity thermogenesis (EAT) and non-exercise activity
methods (e.g. FAO/WHO or Ainsworth’s metabolic equivalents
                                                                         thermogenesis4. The contribution of REE to TEE is higher in
list) and empirical equations to estimate TEE was compared.
                                                                         sedentary adults (60% to 75% of TEE)5 than in physically ac-
Multiple linear regression and Intra-class correlation coeffi-
                                                                         tive people (50% of the TEE)5. Conversely, EAT varies be-
cients were estimate as agreement measurement. The equa-
                                                                         tween 25% and 75% of the TEE, being higher in athletes or
tion developed is as follows: TEE (kcal / d) = 1331.712 -
                                                                         in people who perform vigorous activities6.
(686.344 x sex, men: 1, women: 2) + (18,051 x body weight,
kg) - (16.020 x age, years) + (894.007 x PAL). The accuracy                 The main methods used to evaluate TEE are direct and in-
of the equation was modest in the development (R2 = 54.4,                direct calorimetry and doubly labelled water. However, the high
standard error = 511.3) and validation (R2 = 59.2, standard              costs of the equipment and complexity of these techniques
error = 372.8) samples. However, this equation had higher                represent limitations for their use in clinical and population
accuracy than factorial methods or empirical equations. The              studies. Therefore, prediction equations or factorial methods
equation was developed to estimate the TEE of Mexican                    to assess the TEE are commonly used due to their low cost
adults, which can be used as a general guide to provide nu-              and the relative simplicity of procedures required for profes-
tritional counselling.                                                   sionals and participants (i.e., administration of questionnaires
                                                                         and calculations)7. So far, most prediction equations have been
                                                                         developed to estimate REE8-12; whereas few studies have
                                                                         sought to estimate TEE based on anthropometric and physical
                                                                         activity data. The clinical utility of REE prediction equations is
Correspondencia:
Luis Ortiz Hernández                                                     limited because they do not include PAEE, therefore they can-
lortiz@correo.xoc.uam.mx                                                 not be applied to estimate the TEE of most people.

Nutr Clín Diet Hosp. 2021; 41(3):89-96
                                                                                                                                     89
DEVELOPMENT AND VALIDATION OF AN EQUATION TO PREDICT TOTAL ENERGY EXPENDITURE IN A SAMPLE OF MEXICAN ADULTS
Factorial methods have been developed to estimate TEE, tivity questionnaire was applied16. At the second visit, a labo-
such as the Food and Agriculture Organization/World Health ratory exercise test was performed, from which measures of
Organization (FAO/WHO)10, Institute of Medicine (IOM)11, oxygen consumption (VO2), CO2 production (VCO2) and HR
and Ainsworth’s list of metabolic equivalents (Ainsworth’s during the physical exercise test were determined. In this ses-
MET)13. Other way to estimate TEE is using the Mifflin’s equa- sion, it was explained to the people how they should use the
tion9 (with an adjustment for PAEE2) or empirical equations HR monitor in the following week. After a week, the partici-
based on body weight14. The validity of estimates obtained pants returned the HR monitors.
with some of these methods is unknown, although in their es-
timates are routinely used. Therefore, the main objective of To measure TEE, the energy expenditure while the partic-
this study was to develop and validate an equation to predict ipants slept was added to their energy expenditure while
TEE based on anthropometric measurements and a physical they were awake. REE was measured by indirect calorimetry
activity questionnaire that can be applied among noninstitu- and was considered as the energy expenditure while the par-
tionalized Mexican adults. A secondary objective was to com- ticipants slept. To estimate the energy expenditure during
pare the accuracy of the different methods to estimate TEE awake time, VO2 (ml/min) and VCO2 (ml/min) were esti-
that can be used in clinical settings. mated by extrapolation based on the HR recorded under
free-living conditions.
MATERIAL AND METHODS REE was evaluated by indirect calorimetry with a gas anal-
yser (Korr Medical Technologies Inc., model CardioCoach CO2,
A validation study with a sample of 115 Mexican adults
UT, USA). Before each test, the gas analyser was calibrated
(women: 62.6%) aged 18 to 45 years was conducted.
with the ambient air of the room. A HR monitor (Polar Electro,
Advertisements in the university and near neighbourhoods
Inc., model H1, NY, USA) and a face mask from the
were posted inviting to participate in the study. Participants
CardioCoach® equipment were used. The recommenda-
did not receive any incentive to participate. During recruit-
tions17 for an indirect calorimetry test (i.e., measurement
ment, participants with different ages, occupations, levels of
time, fasting, consumption of caffeine, nicotine and/or alco-
physical activity and fitness were sought. The exclusion crite-
hol, and physical activity) were followed. A coefficient of vari-
ria were to have weight changes in the previous month, have
ationNUTRICIÓN CLÍNICA Y DIETÉTICA HOSPITALARIA Under free-living conditions, HR was recorded minute-by- With the empirical equations, the TEE was estimated using minute with a monitor (Polar Electro, Inc., model RS400, NY, the body weight14. This method requires to multiply the body USA). Participants were asked to use the HR monitor for at weight by 25-35 according to physical activity habits. Based least a week and to carry out their activities normally. Records on the answers to the two-item questionnaire about physical with a length of ≥ 12 hours and those without abnormal val- activity16, the kilocalories per body weight was selected ues (
DEVELOPMENT   AND VALIDATION OF AN EQUATION TO PREDICT TOTAL ENERGY EXPENDITURE IN A SAMPLE OF   MEXICAN   ADULTS

Table 1. Anthropometric, body composition, and physical activity characteristics of a sample of Mexican adults

                                         Development sample (n=71)                               Validation sample (n=44)
                                                                                                                                                   p
                                     –                                                    –
                                     X           SD           Min          Max            X                SD           Mín.        Máx.

 Age (years)                       28.2          7.2          18.0         45.0         28.5               8.1          19.0         45.0       0.814

 Weight (kg)                       64.9          13.3         41.8        100.8         66.1           17.6             37.4        146.4       0.673

 Height (cm)                       162.4         9.9          141.0       183.0         164.5          10.4             149.0       186.0       0.298

 BMI (kg/m²)                       24.4          3.5          18.6         33.8         24.2               4.6          16.6         44.7       0.828

 FM (kg)                           18.5          7.0           8.2         39.5         19.3               9.8           7.4         66.6       0.611

 FM (%)                            28.7          8.4          12.3         46.3         28.9               8.3          10.4         45.5       0.881

 FFM (kg)                          46.4          11.1         27.0         78.2         46.8           11.6              29.4        79.8       0.847

 SMM (kg)                          25.8          6.7          14.0         45.3         25.8               7.2          15.3         45.8       0.959

 SMM (kg/m²)                        9.6          1.5           7.0         13.5          9.4               1.6           6.7         14.0       0.382

 PAL                                1.7          0.2          1.4           2.2          1.7               0.2           1.4         2.3        0.772

 Measured TEE (kcal/d)            2451.8        735.2       1012.6        4598.8       2249.7         586.4            1285.0      3824.1       0.125

                                     n           %                                        n                %                                       p

 Sex

 Males                              26           36.6                                    17            38.6                                     0.828

 Females                            45           63.4                                    27            61.3

 BMI

 Low weight and normal              40           56.3                                    29            65.9                                     0.309

 Overweight and obesity             31           43.6                                    15            34.1

 PA at work

 Very light                         25           35.2                                    14            31.8                                     0.168

 Light                              31           46.3                                    19            43.2

 Moderate                           15           21.1                                     8            18.2

 Heavy                               0           0.0                                      3                6.8

 PA in leisure time

 Very light                         11           15.5                                     9            20.4                                     0.706

 Light                              15           21.1                                     9            20.4

 Moderate                           19           26.7                                    15            34.1

 Active                             16           22.5                                     6            13.6

 Very active                        10           14.1                                     5            11.3
               –
Abbreviations: X, mean; SD, standard deviation; Min, minimum; Max, maximum; n, frequency; %, percentage; BMI, body mass index; FM, fast
mass; FFM, fat-free mass; SMM, skeletal muscle mass; PAL, physical activity level; TEE, total energy expenditure; PA, physical activity.

                                                                                                                    Nutr Clín Diet Hosp. 2021; 41(3):89-96
  92
NUTRICIÓN CLÍNICA Y DIETÉTICA HOSPITALARIA
Table 2. Linear regression models considering the total energy expenditure as dependent variable and the anthropometric, body com-
position and physical activity characteristics as independent variables in the development sample (n = 71)
Equation 1 Equation 2 Equation 3 Equation 4 Equation 5 Equation 6 Equation 7
Intercept (α) 1115.372 1331.712 6111.309* 712.729 3460.274** 1127.877 -1235.791
Sex -697.292*** -686.344*** -648.676*** -449.679 p=0.061 -1048.457*** -534.632* -629.162**
Weight (kg) 15.336* 18.051** -62.636
Age (years) -16.020 p=0.075
Weight X PAL 45.943*
FFM (kg) 26.442**
FFM (%) -9.156
SMM (kg) 37.067*
PAL 870.283* 894.007** -2118.706 732.960* 798.770* 728.136* 812.856*
Height (cm) 20.515*
R2 52.1 54.4 55.0 52.1 47.9 51.1 50.4
SEE (kcal/d) 519.9 511.3 508.1 520.3 542.3 525.5 529.1
AIC 1093.4 1092.0 1091.1 1093.5 1099.4 1094.9 1095.9
Abbreviations: sex (males: 1, females: 2); FFM: fat-free mass; SMM, skeletal muscle mass; PAL, physical activity level; SEE, standard errors of
estimate; AIC, Akaike’s information criterion; * pDEVELOPMENT AND VALIDATION OF AN EQUATION TO PREDICT TOTAL ENERGY EXPENDITURE IN A SAMPLE OF MEXICAN ADULTS
Table 3. Intraclass correlation coefficients and linear regression models between the measured total energy expenditure (TEE) and the
predicted TEE in the validation sample (n = 43)
Coefficients Regression models(a)
AIC
–
X S rp ric R2 (%) SEE α β
Measured TEE 2229.1 577.0
TEE predicted with existing methods
FAO/WHO 2110.1 471.5 0.61*** 0.59*** 37.5 461.6 647.4 0.75*** 651.6
IOM 2376.7 480.4 0.66*** 0.62*** 43.1 440.6 355.3 0.79*** 647.6
Ainsworth 2199.9 608.6 0.48*** 0.49*** 22.9 512.6 1230.2*** 0.45** 660.6
FAO/WHO-PAL(b) 2832.4 645.2 0.63* 0.32*** 39.8 453.2 631.9 0.56*** 650.0
Mifflin x PAL(c) 2534.1 617.2 0.64*** 0.54*** 40.5 450.5 721.4* 0.59*** 649.5
Empirical equations 1983.8 543.9 0.64* 0.57*** 41.1 448.1 879.5** 0.68*** 649.0
Developed equations
Equation 1 (weight) 2490.8 565.9 0.72*** 0.64*** 51.3 407.4 409.6 0.73*** 640.8
Equation 2 (weight and age) 2491.9 591.3 0.77*** 0.69*** 59.2 372.8 357.5 0.75*** 633.2
Equation 3 (weight x PAL) 2480.3 526.4 0.68*** 0.60*** 46.5 427.1 375.1 0.75*** 644.9
Equation 4 (FFM) 2479.1 527.4 0.68*** 0.60*** 46.4 427.6 381.8 0.74*** 645.0
Measured TEE considered as a dependent variable and the estimated TEE by prediction equations as independent variables. (a) Physical activity
level values of FAO/WHO; (b) Physical activity levels of Johansson & Westerterp; (c) Physical activity level values proposed by the Academy of
–
Nutrition and Dietetics. Abbreviations: X, mean; S, standard deviation; rp; Pearson’s correlation coefficient; ric; intraclass correlation coefficient;
IC, Akaike’s information criterion; PAL, physical activity level; FFM, fat-free mass. * pNUTRICIÓN CLÍNICA Y DIETÉTICA HOSPITALARIA
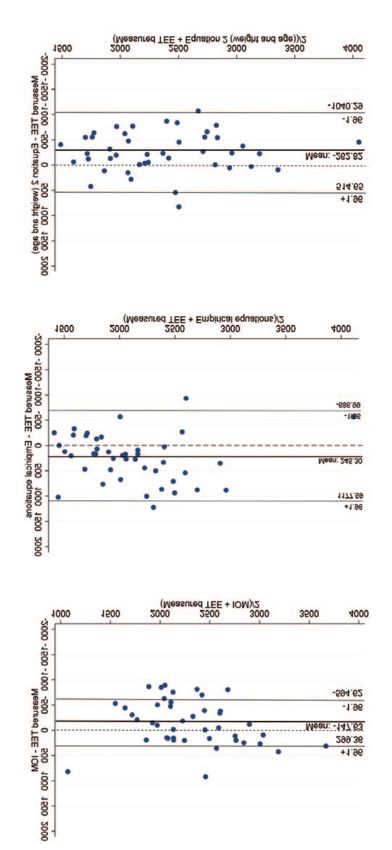
Figure 1. Bland Altman plots to evaluate agreement between CONCLUSIONS
measured and estimated total energy expenditure
Considering that the previous methods used to estimate
TEE do not provide the best results and are time consuming,
the objective of the present study was to propose a TEE pre-
diction equation based on anthropometric measurements and
two simple questions related to physical activity. In compari-
son with the factorial methods and empirical equations, the
developed equation is simpler and more practical to estimate
the TEE of Mexican adults. Although the developed equation
is not perfect, it had the highest predictive capacity. We sug-
gest that our equation can be used for clinical practice with
caution since we did not obtain exact results applied to spe-
cific individuals; rather, it is a general orientation that profes-
sionals can use to provide nutrition counselling.
REFERENCES
Figure 1A. Institute of Medicine 1. American College of Cardiology/American Heart Association Task
Force on Practice Guidelines OEP, 2013. Executive summary:
Guidelines (2013) for the management of overweight and obesity
in adults. Obesity. 2014;22 Suppl 2:S5-39.
2. Academy of Nutrition and Dietetics (2015) Adult Weight
Management: Executive Summary of Recommendations (2014).
[Available from: https://www.andeal.org/vault/pq130.pdf]
3. Pinheiro Volp AC, Esteves de Oliveira FC, Duarte Moreira Alves R,
Esteves EA, Bressan J. Energy expenditure: components and
evaluation methods. Nutr Hosp. 2011;26(3):430-40.
4. Chung N, Park MY, Kim J, Park HY, Hwang H, Lee CH, et al. Non-
exercise activity thermogenesis (NEAT): a component of total
daily energy expenditure. J Exerc Nutr & Biochemistry.
2018;22(2):23-30.
Figure 1B. Empirical equations 5. Melby C, Paris HL, Foright R. Chapter 10. Energy balance. In:
Karpinski C, Rosenbloom CA, eds. Sports nutrition. A handbook
for professionals. Sports, cardiovascular, and wellness nutrition
dietetics practice group. Chicago, IL: Academy of Nutrition and
Dietetics; 2017:191-217.
6. Redondo RB. Gasto energético en reposo. Métodos de evaluación
y aplicaciones. Rev Esp Nutr Comunitaria. 2015;21(1):243-251.
7. Hasson RE, Howe CA, Jones BL, Freedson PS. Accuracy of four
resting metabolic rate prediction equations: effects of sex, body
mass index, age, and race/ethnicity. J Sci Med Sport. 2011;
14(4):344-351.
8. Orozco-Ruiz X, Pichardo`-Ontiveros E, Tovar AR, Torres N,
Medina-Vera I, Prinelli F, et al. Development and validation of new
predictive equation for resting energy expenditure in adults with
overweight and obesity. Clin Nutr. 2018;37(6 Pt A):2198-205.
Figure 1C. Equation 2 (weight and age)
9. Mifflin MD, St Jeor ST, Hill LA, Scott BJ, Daugherty SA, Koh YO. A
new predictive equation for resting energy expenditure in healthy
Limits of agreement ±1.96 standard deviations (solid lines) of the individuals. Am J Clin Nutr. 1990;51(2):241-247.
mean of the differences (solid bold line) between measured and es-
timated total energy expenditure. Dotted line on the 0 represents 10. Food and Agriculture Organization. Human energy requirements.
zero or null differences between methods. Rome, Italy: FAO/WHO/UNU; 2001.
Nutr Clín Diet Hosp. 2021; 41(3):89-96
95DEVELOPMENT AND VALIDATION OF AN EQUATION TO PREDICT TOTAL ENERGY EXPENDITURE IN A SAMPLE OF MEXICAN ADULTS
11. Institute of Medicine. Dietary Reference Intakes. Washington, American Heart Association. Circulation. 2014;130(12):1014-
DC: The National Academies Press; 2005. 1027.
12. Harris JA, Benedict FG. A biometric study of human basal 22. Tanaka H, Monahan KD, Seals DR. Age-predicted maximal heart
metabolism. PNAS. 1918;4(12):370-373. rate revisited. J Am Coll Cardiol. 2001;37(1):153-156.
13. Ainsworth BE, Haskell WL, Herrmann SD, et al. 2011 23. Lohmann TG, Roche AF, Martorell R. Anthropometric
Compendium of Physical Activities: a second update of codes and Standardization Reference Manual. Champaign, IL: Human
MET values. Med Sci Sports Exerc. 2011;43(8):1575-1581. Kinetics Books; 1988.
14. Haneda M, Noda M, Origasa H, Noto H, Yabe D, Fujita Y, et al. 24. Habicht J. Estandarización de métodos epidemiológicos cuantita-
Japanese Clinical Practice Guideline for Diabetes 2016. J Diabetes tivos sobre el terreno. Bol Of Sanit Panam. 1974;75(5):375-384.
Investig. 2018.
25. Heymsfield SB, Harp JB, Rowell PN, Nguyen AM, Pietrobelli A.
15. Algina J, Moulder BC, Moser BK. Sample Size Requirements for How much may I eat? Calorie estimates based upon energy ex-
Accurate Estimation of Squared Semi-Partial Correlation penditure prediction equations. Obes Rev. 2006;7(4):361-370.
Coefficients. Multivariate Behav Res. 2002;37(1):37-57.
26. Ocobock C. The allocation and interaction model: A new model
16. Johansson G, Westerterp KR. Assessment of the physical activity for predicting total energy expenditure of highly active humans in
level with two questions: validation with doubly labeled water. Int natural environments. Am J Human Biol. 2016;28(3):372-380.
J Obes. 2005. 2008;32(6):1031-1033.
27. Leonard WR, Katzmarzyk PT, Stephen MA, Ross AG. Comparison
17. Compher C, Frankenfield D, Keim N, Roth-Yousey L. Best practice of the heart rate-monitoring and factorial methods: assessment
methods to apply to measurement of resting metabolic rate in of energy expenditure in highland and coastal Ecuadoreans. Am
adults: a systematic review. J Am Diet Assoc. 2006;106(6):881- J Clin Nutr. 1995;61(5):1146-1152.
903.
27. Alfonzo-Gonzalez G, Doucet E, Almeras N, Bouchard C, Tremblay
18. Weir JB. New methods for calculating metabolic rate with special
A. Estimation of daily energy needs with the FAO/WHO/UNU 1985
reference to protein metabolism. J Physiol. 1949;109(1-2):1-9.
procedures in adults: comparison to whole-body indirect
19. Livingstone MB, Prentice AM, Coward WA, et al. Simultaneous calorimetry measurements. Eur J Clin Nutr. 2004;58(8):1125-
measurement of free-living energy expenditure by the doubly la- 1131.
beled water method and heart-rate monitoring. Am J Clin Nutr.
28. Rennie KL, Hennings SJ, Mitchell J, Wareham NJ. Estimating en-
1990;52(1):59-65.
ergy expenditure by heart-rate monitoring without individual cal-
20. Fletcher GF, Ades PA, Kligfield P, et al. Exercise standards for test- ibration. Med Sci Sports Exerc. 2001;33(6):939-945.
ing and training: a scientific statement from the American Heart
29. Ceesay SM, Prentice AM, Day KC, et al. The use of heart rate
Association. Circulation. 2013;128(8):873-934.
monitoring in the estimation of energy expenditure: a validation
21. Myers J, Forman DE, Balady GJ, et al. Supervision of exercise study using indirect whole-body calorimetry. Br J Nutr.
testing by nonphysicians: a scientific statement from the 1989;61(2):175-186.
Nutr Clín Diet Hosp. 2021; 41(3):89-96
96You can also read