WHERE DO YOU "TUBE"? UNCOVERING YOUTUBE SERVER SELECTION STRATEGY
←
→
Page content transcription
If your browser does not render page correctly, please read the page content below
Where Do You “Tube”? Uncovering YouTube Server Selection Strategy

                                       Vijay Kumar Adhikari, Sourabh Jain, Zhi-Li Zhang
                                                   Computer Science & Engineering
                                                 University of Minnesota - Twin Cities
                                                     Minneapolis, Minnesota 55455
                                               Email: {viadhi,sourj,zhzhang}@cs.umn.edu

   Abstract—YouTube is one of the most popular video sharing                 In this paper, we use the same active measurement infras-
websites in the world. In order to serve its globally distributed         tructure used in [1] to provide insights into the server selection
users, it requires a massive-scale video delivery system. A major         strategy employed by YouTube video delivery network. In
part of the whole system is to decide exactly what server machine
is going to serve a client request at any given time.                     particular, (i) we extract and chart the physical resources
   In this paper, we analyze DNS resolutions and video playback           currently used by YouTube to serve videos, (ii) provide details
traces collected by playing half a million YouTube videos from            on how various strategies are used by YouTube to distribute
geographically distributed PlanetLab nodes to uncover load-               the video request to its geographically distributed global cache
balancing and server selection strategies used by YouTube. Our            servers, and (iii) how these strategies interact with each other.
results indicate that YouTube is aggressively deploying cache
servers of widely varying sizes at many different locations around
                                                                             Our study shows that YouTube uses 3 different approaches
the world with several of them located inside other ISPs to               to distribute the load among various servers.
reduce cost and improve the end-user performance. We also find            a. Static load sharing using hash based mechanism: As noted
that YouTube tries to use local “per-cache” load-sharing before           in [1], YouTube maps each video-id to a unique hostname in
resorting to redirecting a user to bigger/central cache locations.        each of the namespace in the hierarchical DNS based host
                                                                          namespaces. This provides a very coarse grain load-sharing
                        I. I NTRODUCTION                                  that allocates equal number of videos to each of the hostnames
                                                                          in the primary namespace.
   YouTube, which started as a “garage-project” to share
                                                                          b. Semi-dynamic approach using location aware DNS resolu-
videos online in 2005, has seen an explosive growth in its
                                                                          tions: YouTube maps each DNS hostname to an IP address,
popularity. Today it is indisputably the world’s largest video
                                                                          which represents a physical video cache, based upon the user
sharing site. It serves millions of users across the world
                                                                          location and current demand. As seen in our experiments,
every day. However, due to its ever increasing popularity
                                                                          YouTube redirects user to a geographically close cache lo-
and demand, it is subjected to a continual expansion to
                                                                          cation during the “normal” hours. However, during the “busy”
accommodate the growing demands. As shown in a recent
                                                                          hours it uses DNS based resolutions to direct the user to a
study [2], in 2008, it used 6 large data-centers located with in
                                                                          slightly farther location, which helps in avoiding geographical
United States to serve the videos to users (while LimeLight
                                                                          hot-spots. This is one of the new insight we gained by
CDN was used to push the most popular videos to users).
                                                                          analyzing a large number of continuous DNS resolutions over
However, these data-centers were not enough to meet the
                                                                          more than a month.
increasing global demand, and sometimes after it was bought
                                                                          c. Dynamic load-sharing using HTTP redirections: Finally, to
by Google, it started expanding its video distribution network
                                                                          further balance the load on different physical servers YouTube
by using Google’s infrastructure.
                                                                          caches used HTTP redirections to direct user from a busy
   In a recent work [1], Adhikari et.al. used a reverse engineer-
                                                                          server to a not so busy video server. It helps in smoothing the
ing based methodology to uncover the basic principles behind
                                                                          skewed load distribution caused by the combination of video
the design of YouTube video delivery cloud. It showed that
                                                                          popularity and the spontaneous video demands. The interesting
YouTube video delivery cloud consists of three components:
                                                                          and new observation we made by analyzing the redirection
the video-id space, hierarchical logical video server DNS
                                                                          logs is that YouTube uses local “intra-tier” load-sharing before
namespaces and physical video cache servers. YouTube then
                                                                          resorting to “inter-tier” load-sharing. In addition, none of these
uses a combination of static and dynamic load balancing ap-
                                                                          approaches require any centralized coordination.
proaches to distribute the demand to its physical resources. As
                                                                             Our findings also show that YouTube caches are present
shown in that work, the video-id space consists of fixed length
                                                                          at more than to 45 cities in 25 different countries around
unique identifier referring to each YouTube video, which are
                                                                          the world. These trends suggest that Google is aggressively
then mapped to hierarchical video server namespaces using
                                                                          pushing its content close to users by placing a large number
static hashing. In addition, YouTube DNS servers map these
                                                                          of “cache servers” at various geographical locations around the
server hostnames to IP addresses corresponding to physical
                                                                          world. Moreover, several of these caches are co-located with
hosts in a client-location aware manner.
                                                                          ISP-PoPs, which not only helps in reducing the bandwidth
  This work is supported in part by the NSF grants CNS-0905037 and CNS-   cost for both the ISP and YouTube, but also improves the
1017647, and the DTRA Grant HDTRA1-09-1-0050.                             performance for the ISP users.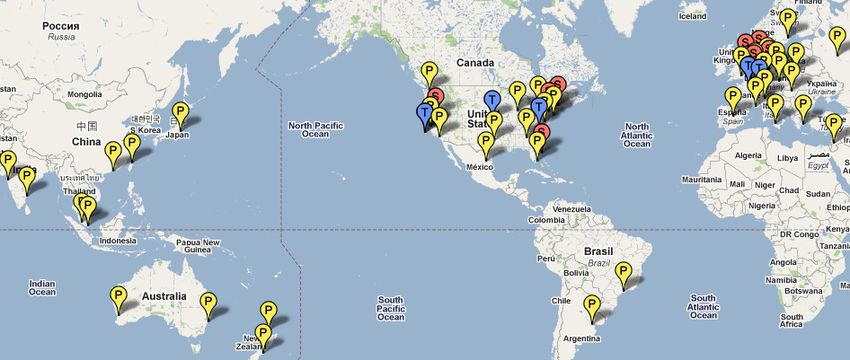
The remainder of the paper is organized as follows. We           YouTube traffic at a campus network to understand benefits
present background and related work in Section II. Section III      of alternative content distribution strategies. A more recent
describes and characterizes various YouTube cache locations.        work [7] studies the impact of the YouTube video recommen-
We discuss YouTube’s server selection and load balancing            dation on the popularity of videos. Our study compliments
strategies in Section IV and conclude the paper in Section V.       and advances these works by shedding lights on the multi-
                                                                    step load-balancing and server selection strategy employed by
           II. BACKGROUND & R ELATED W ORK                          YouTube to serve video contents from geographically diverse
   In this section we first summarize the related work. We then     cache locations.
provide an architectural overview of YouTube video delivery
cloud based on the findings from a recent study [1] which           B. YouTube Video Delivery Cloud
forms the basis for this paper.                                        YouTube video delivery cloud consists of three major com-
                                                                    ponents: video id space, hierarchical logical video servers
A. Related Work
                                                                    represented using multiple anycast1 (or logical) DNS names-
   The most relevant to our work is the recent study carried        paces, and a 3-tier physical server cache hierarchy. In the
in [1]. In this study, authors used an active measurement           following we present a brief overview of these components,
testbed comprising of several Planet-Lab nodes and open             while detailed description can be found in [1].
recursive DNS servers. Using the testbed authors played             YouTube Video Id Space: Each YouTube video is uniquely
a large number of videos and analyzed the detailed video            identified using a fixed length flat identifier. These identifiers
playback logs to distill out the basic design principles behind     construct the video id space.
the YouTube video delivery cloud. However, the work mostly          Hierarchical Cache Server DNS Namespaces: YouTube de-
focuses on the organization of video servers and provides           fines multiple (anycast) DNS namespaces, each representing a
very limited analysis of mechanisms used to perform load-           collection of logical video servers with certain roles. Together,
balancing and how it impacts the video delivery performance.        these (anycast) DNS namespaces form a hierarchical organi-
In this work, we use the same testbed to extract the key            zation of logical video servers. Logical video servers at each
load-sharing mechanisms used by YouTube. In addition, we            level of this organization are mapped to IP addresses (of “phys-
also provide a detailed charting of various YouTube cache           ical” video servers residing at various locations) within a par-
servers, their locations and other characteristics. Although we     ticular tier of the physical cache hierarchy. There are a total of
borrowed the active measurement platform, and some of the           three sets of anycast namespaces, which we refer to as primary,
data collected from [1], this work differs significantly from       secondary and tertiary namespaces; each namespace has a spe-
[1] in terms of its contribution. In particular, this paper tries   cific format. E.g. hosts in primary namespace use the following
to understand how YouTube decides which server is going to          format: v[1-24].lscache[1-8].c.youtube.com. As
serve any particular video request and what factors affect this     seen in the above example there are a total of 24 × 8 or
decision process. In another recent study [2], authors utilize      192 such hostnames in the primary namespace. Similarly,
the Netflow traffic data passively collected at various locations   there are 192 hostnames in the secondary namespace, and
within a tier-1 ISP to uncover the locations of YouTube data        64 hostnames in tertiary namespace. In general only the
centers, and infer the load-balancing strategy employed by          DNS names belonging to the primary namespace are visible in
YouTube at that time. The focus of the study was on the impact      the URLs or HTML pages referencing videos; whereas DNS
of YouTube load-balancing on the ISP traffic dynamics, from         names belonging to the other two namespaces occur mostly
the perspective of the tier-1 ISP. As the data used in the study    only in the URLs used in dynamic HTTP request redirections
is from spring 2008, the results reflect the YouTube delivery       during video playback.
infrastructure pre Google re-structuring. Another piece of          Physical Cache Servers: Although there are three unique
relevant work in terms of the active measurement methodology        logical namespaces used to represent the DNS names for
is the study in [6], where the authors compare two design           the hosts in various logical cache servers, each anycast DNS
philosophies used in content distribution networks (CDNs)           hostname may map to a large set of IP addresses, which
such as Akamai and Limelight, and conduct a comparative per-        we refer to as the physical cache servers. E.g., hostname
formance evaluation (e.g., delay and availability performance)      v1.lscache1.c.youtube.com in primary namespace
of these CDNs through measurement.                                  maps to 75 different IP addresses depending on time and the
   There are several other existing studies of YouTube, which       location of the user.
mainly focus on user behaviors or the system performance.           Datesets. For this study we used several datasets that were
For instance, the authors in [3] examined the YouTube video         collected using our active measurement platform using 500
popularity distribution, popularity evolution, and key elements     PlanetLab nodes and 1000 open recursive DNS servers.
that shape the popularity distribution using data-driven analy-        We obtained video playback traces by playing approxi-
sis. The authors in [5] investigate the (top 100 most viewed)       mately half a million videos used in [1]. We also obtained
YouTube video file characteristics and usage patterns such as
the number of users, requests, as seen from the perspective of        1 Here by an anycast (DNS) namespace we mean that each DNS name is
an edge network. Another study[8] analyzed network traces for       by design mapped to multiple IP addresses (“physical” video servers).
IP geolocation data from the same study. Additionally, we To see whether YouTube caches with IP addresses coming
collected DNS resolution data for the YouTube hostnames from other ISPs differ from the ones with IP addresses coming
from all the PlanetLab nodes continuously for a month. During from YouTube or Google’s address space, we analyzed the
that period we also monitored the change in view-counts for video playback log where we had used spoofed DNS response
all 437K videos. to send a client to any arbitrary YouTube location. The data
suggested that the caches using any other ISP’s address space
III. C HARTING YOU T UBE G LOBAL C ACHES
only served that ISP’s customer cone.
Before we try to answer how YouTube’s server selection To verify this, we sent video playback request to such
strategy works, we need to have an understanding of what YouTube caches from a large number of PlanetLab nodes. We
server resources YouTube is currently using and where those saw that only requests coming from a PlanetLab node that was
server resources are. Since we do not have a way to precisely in the ISPs customer cone could download a video. All other
know how many or what types of server machines YouTube clients PlanetLab nodes received a redirect message instructing
has at its disposal, we use the IP addresses seen at each of them to try some other location. We used traceroutes and BGP
the locations as an approximation for the number of servers at AS paths information to learn if a PlanetLab node is inside
that location. We understand that behind each IP address, there the customer cone of an ISP or not.
might be multiple physical machines not directly observable
from the outside. B. YouTube Cache Locations and Sizes
In the following, we provide a detailed charting of YouTube
physical video servers in terms of the IP addresses used and
their geographical locations. For these analyses we extract
the YouTube server IP addresses by resolving YouTube video
server hostnames from various PlanetLab nodes and open
recursive DNS servers continuously for more than a month.
We also utilize the IP to city mapping data used in [1] to chart
the geographic distribution of YouTube caches.
A. IP addresses for YouTube servers
YouTube 11% Fig. 2. Three tiers of YouTube video cache loca-
Others 19.5%
tions(P=Primary,S=Secondary,T=tertiary).
Using the IP address to location mapping data we identified
a total of 45 cities where YouTube video caches are present.
Out of these 45 locations, 43 distinct locations correspond to
primary caches, while secondary and tertiary caches mapped to
only 8 and 5 distinct locations respectively. The geographical
Google 69.5% span of these locations is shown in Figure 2. The primary,
secondary and tertiary cache locations are indicated by letters
Fig. 1. Organizations where the YouTube video-serving IP prefixes come
from. P, S and T respectively in that figure. We note that at some
locations, more than one tier of the cache hierarchy are present.
Using the DNS resolutions of YouTube servers’ logical Although there are 45 unique locations where YouTube
DNS namespaces we extracted a total of 6000 unique IP caches are present, not all the locations are the same in terms
addresses. In terms of the namespace hierarchy, there are of the available resources. To understand the diversity in the
5000 IP addresses corresponding to primary logical server size of different cache locations, we plot the distribution of
namespace, and 636 and 320 IP address for secondary and YouTube cache sizes in Figure 3. We use the number of IP
tertiary namespaces respectively. addresses present at each location as a proxy for the size of
With the large number of IP addresses in hand, we next try that cache location. In this figure the x-axis represents the
to find what address space those IPs come from. We performed YouTube locations, and the y-axis represents the size in terms
WHOIS queries [4] for all the extracted IP prefixes to find the of the number of IP addresses. As seen in this figure, the
corresponding owner organizations for them. Our results show sizes of the cache locations vary widely. In particular there
that although most of the IP prefixes (/24s) belong either to are locations, which have large number of IP addresses, e.g.
Google or to YouTube, there are approximately 20% of the Frankfurt cache location has more than 600 IP address, while
prefixes that belong to several other ISPs. The distribution cache located in Athens has merely 9 IP addresses. Moreover,
of the organizations that own these prefixes is shown in we also find that in general YouTube caches hosted inside
Figure 1. In this figure the “others” category includes several other ISPs or IXPs are much smaller compared than the ones
regional ISPs such as Bell-Canada, Comcast and some Internet whose IP addresses are coming from YouTube/Google address
Exchange Points (IXPs). space.800
physical cache server (or IP address) that is close to the client
Number of IP address
600
requesting a video.
400 1
0.8
200
0.6
0 0.4
Cache locations
0.2
Fig. 3. Distribution of size of YouTube cache locations (cities) in terms of
number of IP addresses seen. 0
0 10 20 30 40 50 60 70 80 90 100
Percentile to which the mapped IPs belong.
In summary, we see that YouTube datacenters are spread Fig. 4. CDF plot showing which decile mapped IPs belong to in terms of
ICMP ping latency.
all over the world, and they vary widely in their sizes as
well as in terms of who they serve. While most of the
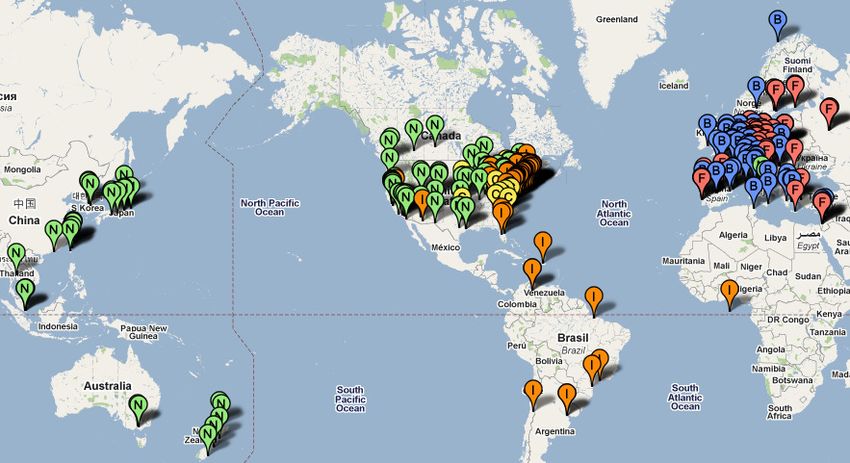
We also visualize the location-awareness in DNS resolution
YouTube locations can serve any client from any geographic
using a geographic map as shown in Figure 5. In this figure we
location, the locations hosted inside other ISPs only cater to
tag each PlanetLab node’s location using one of the 5 YouTube
the customer base of those ISPs.
tertiary cache location that it is mapped to. Here, each balloon
IV. P HYSICAL S ERVER S ELECTION & L OAD BALANCING represents a PlanetLab node and the letter indicates the tertiary
cache location that node gets redirected to using DNS based
We saw that YouTube aggressively pushes its content closer
resolutions. We can clearly see that in almost all of the cases,
to user using a large number of geographically distributed
the nodes pick the closest tertiary cache location.
video cache servers. In this section, we use that information
to uncover the several mechanisms used by YouTube to serve
each user request, so as to maximize user performance and
also to evenly distribute load on its cache servers.
When a user wants to watch a video, the video ID gets
mapped to a unique hostname. The hostname then maps to
different IP addresses based upon multiple factors. YouTube’s
server selection strategy can therefore be understood by ex-
amining this hostname to IP mapping. In this section we
investigate the spatial and temporal factors that influence what
IP the hostname gets mapped to.
A. Location Awareness in Server Selection
In order to understand how the user’s location plays a role in
the mapping of YouTube cache server hostname to IP address Fig. 5. Locations of PlanetLab nodes indicating their tertiary-cache location
mapping, we resolved the hostnames corresponding to primary choices (B=Brussels, C=Council Bluffs, F=Frankfurt, I=Washington DC,
N=Mountain View).
logical servers from all the vantage points. We find that each
primary logical server hostname maps to approximately 75 These results show that YouTube tries to send users to one
unique IP addresses. We also computed ICMP ping latencies of the closest cache locations although the same hostname can
between the vantage points and all the mapped IP addresses. in fact be mapped to a large number of IP addresses in a large
These round trip delay measurements show that the hostname number of cache locations.
to IP address mapping provided by YouTube DNS servers tries
to direct the user to a close physical cache server. We note that B. Temporal Patterns in DNS Mappings
the closeness we measured is in terms of network latencies. To understand temporal changes in DNS resolutions, we
However, we found that in most of the cases, closeness in continuously resolve the logical server hostnames from all the
terms of network latencies also translated to closeness in vantage points for a month-long period.
geographical distances as expected. Our analysis of these DNS resolutions revealed that we can
To demonstrate the location-awareness in the DNS reso- group the vantage points into two distinct groups based on how
lutions, we plot the percentile for the latency between the frequently the mappings change. In the first group of vantage
vantage point and the mapped IP address, which is shown points the mappings change during a certain time of the day,
in Figure 4. In this figure, X-axis represents the percentile and the pattern repeats every day. However, the pattern is more
corresponding to the latency. This indicates that although continuous for the vantage points in the second group.
the hostnames could have been mapped to any of the 75 To illustrate this we plot the IP address mappings for one
IP addresses, in almost all cases, YouTube maps them to a of the primary logical server’s hostname. Figure 6 shows an8
example plot for the second group. In this figure, the X-axis 1.6
x 10
represents the time which is divided in the intervals of 5
Number of video requests served
minutes each, and Y-axis represents the mapped IP address. 1.4
As seen in this figure the mapped IP address changes almost
1.2
every time. It suggests that YouTube is trying to use 4 distinct
physical servers to represent the instance of one particular 1
primary logical server, and changes the mapped IP address
to divide the client request to each of these physical servers. 0.8
On the other hand, there are other locations where new IP
0.6
addresses only show up at specific times of the day. Our
analysis of DNS resolution pattern for these locations shows 0.4
0 20 40 60 80 100 120 140 160 180 200
that each logical server hostname maps to a fixed IP address Hostnames from primary namespace
most of the time during the day, however, during the certain
hours of the day we see a large number of distinct IP addresses Fig. 8. Distribution of video requests per primary cache hostnames.
for the same hostname. We show an example of such a location
in Figure 7. In this figure, we see that DNS servers primarily
map the hostname to IP 3. However, at “busy” hours of the day, given cache location. In addition, these static hash-based load
the DNS server also starts mapping the hostname to other IP distribution and DNS based dynamic mappings, by themselves,
addresses. In this week long data, we can clearly see 7 specific can not ensure that a location will be able to handle a
periods (one every day) in which we see additional IP address sudden increase in video demand. To deal with these prob-
other than IP 3. lems, YouTube uses a more dynamic approach using HTTP
redirection, where a server responsible for serving a video
C. Need for Dynamic Load Balancing sends a HTTP 302 header back to the client asking it to get
We have seen that YouTube uses a static hash-based scheme the video from a different server.
to map videos to hostnames. However, the static mapping To understand this HTTP redirection based dynamic load
of videos to hostname can lead to uneven load on the log- sharing approach, we extract all the instances where a user
ical servers due to the different popularity for each video. is redirected to a different physical server using such redirec-
For instance, if a video becomes popular, the logical server tions. Our analysis of these redirect logs reveals two distinct
corresponding to that video will experience more traffic than patterns in redirections. In the first set of instances, a logical
other servers. These uneven loads for logical servers can then server in one namespace redirects to another logical server
translate into uneven load distribution for physical servers in the same namespace. We refer to these cases as “intra-
corresponding to them. For instance, at each cache location tier” redirections. In rest of the cases, we see that a server
if different logical names map to different physical hosts, in one namespace redirects to a server in a higher tier of
the physical host that is responsible for the logical server cache hierarchy (such as a server from primary namespace
corresponding to the popular video will experience more load redirecting to a server in secondary namespace). These cases
than others. are referred to as “inter-tier” redirections.
To understand this uneven load among different servers, we In case of intra-tier redirection, we looked at locations of
tracked the global video view counts for approximately half a the servers involved in the redirection. A careful inspection
million videos over a month. In an ideal case, we needed the of these redirections showed that the IP addresses of the two
number of times each physical server served a video. However, servers (the one that redirects the client and the one which
as this information is not publicly available, we used the global receives and handles the redirected requests) are in the same
video view count as a proxy to the load on each of the logical location (city). This means in case of intra-tier redirections,
servers. We see that even when we look at aggregate video YouTube is trying to redirect a user to another physical server
counts over a month that includes videos views from all over at the same location.
the world, different logical servers receive widely differing This suggests that YouTube is trying to distribute the load
video requests. To demonstrate this we plot the distribution of locally: i.e. a busy server in one location redirecting a client to
video request on each logical server during a month for our a less busy server in the same cache location. In such cases it
sample of half a million videos in Figure 8. As seen in this is expected that the busier servers should be descernible from
figure, some logical servers are responsible for approximately less busy ones. To see if this is indeed the case, we look at the
4 times more video requests than others. In fact, we can expect individual IP addresses involved in redirections at individual
that during smaller time windows and at different location cache locations. We see that at each location and at any given
this distribution is likely to be even more skewed, which can time period, there are clearly distinct set of servers, one that
result into highly uneven load distribution on different physical send to redirect to others, and another set that handles redirects
servers. but rarely redirect clients to others.
We can see that in this setting, it is very hard to achieve On the other hand, in case of inter-tier redrections, clients
an even load sharing among different physical servers at a are sent to higher tiers of the cache hierarchy. As there are4
IP address identifiers.
3
2
1
200 400 600 800 1000 1200 1400 1600 1800 2000
Time slot identifiers. Each point indicates a 5 minute interval.
Fig. 6. Example plot showing hostname to IP mapping changing continuously.
8
IP address identifiers.
6
4
2
200 400 600 800 1000 1200 1400 1600 1800 2000
Time slot identifiers. Each point indicates a 5 minute interval.
Fig. 7. Example plot showing hostname to IP mapping changing only during peak hours.
smaller number of secondary and tertiary cache locations, this and how that impacts the performance as observed by its users.
usually results in clients being redirected to a farther location. These results demonstrate how one of the best content distri-
We see that the use of HTTP redirects helps YouTube bution network works. As video content delivery is getting
to achieve a more fine granular load distribution among increasingly popular, understanding current “best” practices
servers. The very interesting aspect of YouTube’s use of HTTP provides valuable insights on how any such future systems
redirections in load balancing is that it does not need any can be developed and deployed.
global coordination. The intra-tier load sharing only needs In the future, we plan to build upon these findings to inves-
information gathering at the “local” level to see which servers tigate other aspects of YouTube video delivery system such as
are busier than which others. The local load sharing only the effects of popularity of videos and size of cache locations
requires sharing load information among nodes in the same on server selection. We also plan to perform similar analysis of
location. Redirecting to a higher tier also does not need any several other video content providers. The overarching goal of
global coordination since the target hostname can easily be these projects is to identify the aspects of the current Internet
obtained by the same static hashing mechanism. Each video architecture that make it difficult to build efficient large-scale
ID, as we previously mentioned, maps to a unique hostname video content distribution systems so as to inform the design
at each level of the cache heirarchy. of next-generation internetworks tailored towards large-scale
However, the use of redirections also has its own drawbacks. content distribution.
First of all, since YouTube first tries to load-balance locally,
R EFERENCES
it leads to multiple redirections if the host that receives
the redirection can not serve the video. In addition, each [1] A DHIKARI , V. K., JAIN , S., C HEN , Y., AND Z HANG , Z.-L. Reverse
Engineering the YouTube Video Delivery Cloud. In IEEE HotMD 2011.
redirection requires a client to make an additional HTTP [2] A DHIKARI , V. K., JAIN , S., AND Z HANG , Z. YouTube Traffic Dynamics
request, it also leads to higher delays before the video starts and Its Interplay with a Tier-1 ISP: An ISP Perspective. In IMC ’10
playing back. Moreover, inter-tier redirections generally leads (2010), ACM.
[3] C HA , M., K WAK , H., RODRIGUEZ , P., A HN , Y.-Y., AND M OON , S.
a client to a distant cache location because the higher tier I tube, you tube, everybody tubes: analyzing the world’s largest user
caches are only present at small number of locations. generated content video system. In IMC ’07 (2007), ACM.
[4] D AIGLE , L. WHOIS Protocol Specification. RFC 3912 (Draft Standard),
V. C ONCLUSION Sept. 2004.
[5] G ILL , P., A RLITT, M., L I , Z., AND M AHANTI , A. Youtube traffic
In this paper, we examined YouTube’s video distribution characterization: a view from the edge. In IMC ’07 (2007), ACM.
architecture, to uncover key aspects that determine how [6] H UANG , C., WANG , A., L I , J., AND ROSS , K. Measuring and evaluating
video servers are selected when users try to watch YouTube large-scale CDNs (withdrawn). In Proc. of IMC (2008).
[7] Z HOU , R., K HEMMARAT, S., AND G AO , L. The Impact of YouTube
videos. We found that YouTube uses a large number of data- Recommendation System on Video Views. In IMC ’10 (2010), ACM.
centers and caches that vary in size, geographic locations [8] Z INK , M., S UH , K., G U , Y., AND K UROSE , J. Characteristics of
and other characteristics. We also uncovered key ideas behind youtube network traffic at a campus network - measurements, models,
and implications. Comput. Netw. (2009).
the application-level redirection mechanism that YouTube usesYou can also read