Electric Vehicles House View 01 - Making a positive contribution to New Zealand - Z Energy
←
→
Page content transcription
If your browser does not render page correctly, please read the page content below
House
             View 01
              October 2016

Electric
Vehicles
Making a positive contribution
to New Zealand
Contents
Z House View             01
Context and Background   02
Key issues               03
Appendix A               10
Appendix B               11
Z Energy House View: Electric vehicles                                                                                                     01

Z House View

In summary the current Z house view on EVs is:

     Global mass adoption of EVs                     Industry fossil fuel volumes for transportation could be impacted to the
 1   is inevitable
                                                 6   extent below under plausible boundary scenarios for EV uptake in
                                                     New Zealand; based on existing trajectory and insights Z predicts the
                                                     impact to be within this range:
     New Zealand is well placed to be
 2   part of an EV revolution given
     its relatively high renewable
     electricity base                                                   MOGAS 3050 mlpa                     GAS OIL 22901 mlpa

                                                                   Waka          mid-         Kayak      Waka       mid-         Kayak
     EVs present a future disruptive                              Scenario      range        Scenario   Scenario   range        Scenario
 3   threat to the use of fossil fuels in
     transportation                                      2020      (200)         (10)          180       (140)      (100)         (50)

     Timing for mass adoption of EVs                     2025      (600)        (260)          90        (170)      (90)          (10)
 4   is difficult to predict given the
     critical uncertainty associated with                2030      (1,000)      (570)          (70)      (180)      (50)          70
     technology breakthroughs and
     regulatory intervention

     The most transformational scenario              Two main signposts to watch for as
 5   for New Zealand sees exponential
                                                 7   tipping points for exponential EV
     update of electric powertrains in               uptake – regulatory intervention
     the light duty vehicle fleet from               / price of carbon and battery
     2020 – EVs, PHEVs, HEVs1                        development (cost of energy storage
                                                     and improving energy density)

                                                     There is a need to maintain a
                                                 8   watching brief on speculative
                                                     technology that could see a more
                                                     aggressive reduction in demand
                                                     for fossil fuels over the longer term
                                                     horizon – autonomous vehicles and
                                                     electric powertrain adoption in the
                                                     heavy vehicle task

                                                     With no upstream interest in fossil
                                                 9   fuels, Z will continue to look for
                                                     opportunities to meet the needs of
                                                     customers as the transport energy
                                                     landscape changes

     1 Actual diesel consumption for 2015 was
       ~40ml above the range bounded by the
       scenarios, meaning Z predicts an impact
       closer to the Kayak scenario for 2020.
02

Context and
Background
Growing uncertainty exists around the future supply and demand
for transportation energy. This uncertainty stems from a dichotomy
of plausible future environmental and social contexts, and the
uptake of breakthroughs in technology.

Amongst the growing external commentary
and speculation around electric vehicles
(EVs), Z is subject to increasing levels
of investor enquiry. While Z is actively
supportive of technology uptake to address
the risks of climate change, the prevailing
view has been that mass adoption of EV’s is
10+ years away. This presumption may no
longer hold and consequently Z needs a more
definitive view on the emergence of EVs,
which can be used to respond to investor
enquiry in an informed manner.
Forecasting New Zealand market demand for
petroleum transportation fuel has typically
been made from a representation of the past.
This traditional approach loses relevance
when potentially disruptive technologies are
on the horizon, as is the case currently with
energy systems globally – and not limited to
the transport context.
As Clayton Christensen in the Harvard
Business Review writes: “Data is only
available about the past. When we teach
people that they should be data driven, and
fact based, and analytical as they look into
the future, in many ways we condemn them to
take action only when the game is over. The
only way you can look into the future – where
there’s no data – is to have a good theory.”2
Distributed energy generation, energy
                                                    The only way you can
storage and energy management technology
development have the potential to
                                                 look into the future – where
fundamentally change the way energy is
produced, distributed and consumed.
                                                 there’s no data – is to have
                                                 a good theory.

2 Clayton Christensen, Harvard Business Review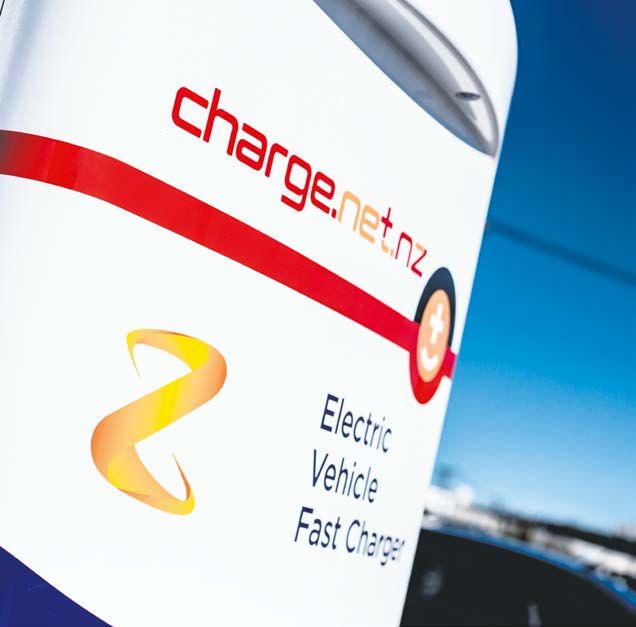
Z Energy House View: Electric vehicles                                                                                                03

  Key issues

1. Transport fuel demand scenarios
  The primary drivers for petroleum transportation fuel demand in
  New Zealand have traditionally been population growth, economic growth
  (GDP) and ongoing fuel efficiency gains. Forecasting future demand
  becomes more complex when considering the possible technology
  developments that may emerge over time such as EVs.

      Five primary factors have been identified as key drivers
      of future demand:

      Primary Drivers         Dependencies
                                                                                             Sufficient insight exists to forecast
      Population growth       Immigration policy                                             New Zealand transportation fuel demand
                                                                                             over the short term horizon, however it
                                                                                             becomes more difficult predicting longer
      Economic growth         Status of global economy; correlation factor with GDP
      (GDP)                                                                                  term demand. The most comprehensive and
                              given recent trend to services-based economy (and lower
                                                                                             credible scenarios for considering the longer
                              energy intensity)
                                                                                             term horizon are those published by the
                                                                                             Business NZ Energy Council in October 2015.
      Energy efficiency       Regulatory governance and decision making (incentives);
                                                                                             These scenarios were developed through
      gains                   Internal Combustion Engine (ICE) ongoing efficiency
                                                                                             a network of energy sector expertise from
                              gains; technology development and adoption of dual
                                                                                             across New Zealand, and through leveraging
                              powertrain hybrids; vehicle fleet composition and turnover
                                                                                             the World Energy Council’s global modelling
                                                                                             framework and capability.
      Alternate power         Disruptive technology developments, breakthroughs and
      train substitution      adoption transforming the vehicle fleet to non-petroleum       Z sponsored and participated in the
                              e.g. improving relative merits of EV’s; hydrogen fuel cells;   development work around the two boundary
                              biofuels and natural gas                                       scenarios, ‘Kayak’ and ‘Waka’. The boundary
                                                                                             scenarios were based on an understanding
      Social change impact    Changing attitudes towards travel through climate change       of what could actually occur in the rest of
                              responses; carbon pricing; price elasticity of demand;         the world, combined with a range of critical
                              urbanisation; digital connectivity; public transport           uncertainties that have meaning to
                              alternatives; ride-sharing; technology development in          New Zealand. The benefit of each boundary
                              autonomous vehicles                                            scenario is that it embodies a unique and
                                                                                             coherent mix of economic, environmental,
                                                                                             social and behavioural contexts – an
                                                                                             integrated storyline of what could plausibly
                                                                                             occur. In a Kayak future, markets drive
                                                                                             supply chain decisions and innovation, with
                                                                                             consumers making informed decisions
                                                                                             based on price and quality. In a Waka future,
                                                                                             heightened environmental awareness drives
                                                                                             business, consumers and government to
                                                                                             make decisions in the national interest.
04

2. EV uptake
  Through access to the BEC2050 modelling data Z has been able to
  extract plausible EV uptake numbers from both scenarios, effectively showing
  the range of potential impact over time – refer to the appended charts.

  The Ministry of Transport define EVs as              The table below shows the uptake of                  The Government recently announced “an
  vehicles that are capable of being powered           electric powertrain vehicles based on the            ambitious and wide ranging package of
  by an external electricity source. Included          Waka scenario, noting this scenario sees             measures to increase the uptake of electric
  under this definition are Plug-in-Hybrid             the most disruptive potential impact to              vehicles in New Zealand”. The incentive
  Electric Vehicles (PHEVs), which have both           Z’s existing business. The table shows the           scheme targets a doubling of the combined EV
  an electrically driven powertrain and an ICE         number of vehicles in the light duty fleet           and PHEV fleet each year to 64,000 vehicles
  driven powertrain. Hybrid Electric Vehicles          increasing materially over the period to             in 2021 – the target is equivalent to the Waka
  (HEVs) are not included under this definition        2050 (12.1 per cent CAGR), driven by wide            scenario for EV and PHEV uptake at 2021. The
  given they are not capable of being powered          availability at economic prices on the back          incentives include an EV exemption from Road
  by an external electricity source; however           of global technology developments, which,            User Charges (RUCs), promotion of bulk EV
  they are a material technology disruptor in          combined with New Zealand’s commitment               purchasing, an annual $6 million contestable
  both scenarios given their relative energy           to a lower carbon emission economy and               fund for initiatives that accelerate EV uptake,
  efficiency improvement over ICE vehicles.34          high renewable electricity base, promotes            and funding to increase general public
                                                       exponential uptake.                                  awareness of EVs. The 2021 target may appear
                                                                                                            ambitious, however there are potentially
                                                       Actual electric powertrain vehicle fleet
                                                                                                            other incentives in the pipeline such as fringe
                                                       numbers for 2015 are tracking below the
                                                                                                            benefit tax (FBT), road tolling and ACC levy
                                                       Waka scenario, however this is insignificant
                                                                                                            exemptions. The Government see EVs as one
                                                       given that potential exponential uptake
                                                                                                            of the main pathways to a lower carbon future
                                                       commences from 2020.
                                                                                                            and to meeting New Zealand’s international4
                                                                                                            COP21 commitments.

       Table: NZ Passenger and Light Commercial Vehicle Fleet Numbers (Waka Scenario)
                      3
            TYPE          2015 (A)         2015         2020         2025          2030          2035            2040          2045          2050

       HEV                  14,980       15,000       100,000     485,000        815,000      985,000         985,000       865,000        770,000

       PHEV                    474       25,000        25,000       95,000       270,000      540,000         820,000       995,000        875,000

       EV                     450        10,000        15,000       90,000      205,000       320,000         500,000        775,000      1,110,000

       TOTAL                15,904       50,000       140,000      670,000     1,290,000     1,845,000       2,305,000     2,635,000     2,755,000

       % FLEET                 0%            2%           4%           18%           34%              47%          57%           64%           66%

  3 Actual data for 2015 from Ministry of Transport
  4 2015 United Nations Climate Change Conference –
    Paris 2015
Z Energy House View: Electric vehicles 05
3. Petroleum demand impact
The increasing uptake of electric powertrain vehicles in the light vehicle
fleet materially reduces demand for existing petroleum based fuel,
particularly petrol.
EVs are substantially more energy efficient The range of potential impact to transport The table below shows the range of petrol
than ICE vehicles – an equivalent journey petroleum consumption over time has been consumption for transport use over the
requires less joules of energy input. In shown in the appended charts. The range of period, driven primarily by transformation
both Kayak and Waka scenarios, efficiency impact shown in the charts represents the in the light vehicle fleet and reduction in
improvements in the heavy vehicle fleet are combined impact of all primary drivers of personal car usage and/or ownership. The
less dramatic, with electricity not assumed to demand over time, i.e. it does not represent impact on petrol consumption over the period
have a significant penetration, other than for the isolated impact of electric powertrain ranges from (0.7)% CAGR under Kayak to
trains and buses. substitution. (2.5) per cent CAGR under the Waka scenario.
Table: NZ Transport Energy Demand Scenarios – Petrol (mlpa)
2015 (A) 2015 2020 2025 2030 2035 2040 2045 2050
Kayak 3,050 3,185 3,230 3,135 2,980 2,820 2,685 2,585 2,500
Waka 3,050 2,870 2,845 2,450 1,975 1,530 1,200 1,190 1,180
r K (cum) - 135 180 85 (70) (230) (365) (465) (550)
r W (cum) - (180) (205) (600) (1,075) (1,520) (1,850) (1,860) (1,870)
r MP (cum) - (20) (10) (260) (570) (875) (1,105) (1,160) (1,210)
The table below shows the range of diesel Both hydrogen and biofuels become viable
consumption for transport use over the for heavy vehicle transport from 2040,
period, driven by transformation in the significantly reducing demand later in the
light vehicle fleet and reduction in personal period. The impact on diesel consumption
car usage and/or ownership, offset by an over the period ranges from (0.8) per cent
increasing heavy vehicle transport task from CAGR under Kayak to (2.0) per cent CAGR
economic growth.5 under the Waka scenario.
Table: 5NZ Transport Energy Demand Scenarios – Diesel (mlpa)
2015 (A) 2015 2020 2025 2030 2035 2040 2045 2050
Kayak 2,290 2,245 2,240 2,285 2,360 2,425 2,405 2,205 1,695
Waka 2,290 2,205 2,150 2,125 2,115 2,080 1,950 1,655 1,085
r K (cum) - (45) (50) (5) 70 135 115 (85) (595)
r W (cum) - (85) (140) (165) (175) (210) (340) (635) (1,205)
r MP (cum) - (65) (95) (85) (53) (38) (113) (360) (900)
5 Does not include diesel currently consumed in
sectors other than transport (~1blpa)06
4. Signposts
Underpinning the EV vehicle uptake numbers are the following key input
assumptions. These represent the signposts to monitor in determining
what scenario could eventuate:
(i) Price of Carbon
Table: Price of Carbon ($ per T CO2)
2015 2020 2025 2030 2035 2040 2045 2050
Price carbon – Waka 21 37 48 60 75 90 102 115
Price carbon – Kayak 7 9 12 18 26 37 49 60
The price of carbon has risen recently however the $25 price cap remains in place. a critical uncertainty as to what could happen
from under $10 to around $18 per T CO2 , At the cap level the impact of the ETS on the to both the future price of carbon and the
following the Government’s May 2016 price of petrol is approximately 6.6cpl, and uptake of EVs; the uncertainty is whether
budget announcement on changes to the 7.7cpl for diesel, levels that on their own are successive governments will err towards a
Emissions Trading Scheme (ETS). The unlikely to drive mass adoption of alternative more light-handed or a more interventionist
announced changes see the phasing out of powertrains for transportation. Regulation is regime for promoting uptake.
the one-for-two subsidy by January 2019,
(ii) Battery technology advancement
Table: Battery Cost Curve (NZ$/kWh)
2015 2020 2025 2030 2035 2040 2045 2050
Battery cost curve – Waka 365 310 270 240 215 195 175 160
Battery cost curve – Kayak 330 270 235 210 195 180 170 160
Both scenarios support a continuing trend The difference in price between a conventional
of rapidly reducing battery cost with actual ICE and an EV is primarily due to the cost of
cost in 2015 estimated to be around 6$400 batteries. As lithium-ion battery technology
per kWh. It is not possible to determine advances and battery cost comes down,
a completely reliable projection of future the price premium barrier to consumers in
battery cost, however some manufacturers purchasing EVs will also likely reduce.
such as General Motors and Tesla have more
Correlated with reducing battery cost trends
ambitious cost estimates of reaching $160
is an increase in battery energy density (kWh/
per kWh in the 2020s.
kg), which in turn improves EV range capability
– a key consumer concern with EVs.
6 US Department of Energy monitored cost estimatesZ Energy House View: Electric vehicles 07
5. Speculative uncertainties
The following uncertainties could stretch the boundaries of what future
scenario actually eventuates, and are sufficiently speculative as to timing
and impact, to warrant maintaining an ongoing watching brief:
(i) Mobility as a service
through autonomous
vehicles
Uncertainty regarding the rate of technology
development and acceptance of autonomous
vehicles impacts whether or how quickly
mobility as a service becomes plausible for
New Zealand’s major urban cities. Adoption
of autonomous vehicles could reduce
transportation energy demand through lower
light duty vehicle ownership and reduced
vehicle kilometres travelled.
The intersection of EV uptake with future
acceptance of self-driving technology could
unlock an evolution of transportation-
as-a-service through car sharing. While
arguably EV technology is available today,
the development and acceptance of
autonomous vehicles could have a greater
long term horizon impact. Supporting this
concept are recent announcements from
car manufacturers such as Ford and Tesla,
announcing plans for a future car sharing
service offer built around their respective
self-driving vehicles. The opportunity is not
limited to the traditional car manufacturers
either with giants such as Google, Apple and
Uber all prominent in this development space.
(ii) Heavy vehicle fleet
technology adoption
The uncertainty is over what alternate
technology to fossil fuels will prevail, and
to what extent, in the heavy vehicle task –
trucking7. The impact of this uncertainty will
occur over a longer term horizon than for
plausible EV uptake in the light vehicle fleet.
Self-driving
technology could unlock an
evolution of transportation-
as-a-service through
car sharing.
7 Tesla has announced as part of their Master
Plan 2 “expanding the electric vehicle product line
to heavy duty vehicles”08
6. External context insights
A scan of relevant external context provides useful insight into testing whether what could
occur under the range bounded by both scenarios remains plausible, and/or provide insight
into what one of the scenarios may eventuate – refer to the table below.
Table: EV supply chain considerations
Insight Scenario plausibility
1. Can the rate of new and used imports into NZ meet exponential demand growth for EV’s?
Key supply markets for new and used light duty vehicles into New Zealand are Asia It is reasonable to assume that
(primarily Japan) and Europe. These markets accounted for 77 per cent and 20 per cent growth in EV adoption in NZ’s key
of the record 285,000 new and used vehicles imported into New Zealand in 2015, on the vehicle supply markets of Japan and
back of relatively strong economic conditions. Japan is a member of Electric Vehicles Europe will be sufficient to support
Initiatives (EVI), a multi-government policy forum representing the majority of global EV an exponential demand growth
car stock. EVI has a goal of achieving 20 million EV cars by 2020. Japan currently has scenario for NZ.
16 per cent of the global car stock of EVs at 0.13 million, with a committed target to get
The current rate of turnover of the
to one million by 2020. The Japanese government provides financial incentives for EV
New Zealand light duty vehicle
cars, including purchase price subsidies and tax exemptions. France, Germany, Italy,
fleet makes a more aggressive EV
Netherlands, Norway, Portugal, Spain, Sweden and the United Kingdom are also members
demand growth scenario than Waka
of EVI, with most having announced aspirational commitments to the goal of 20 million
seem implausible.
EV cars by 20208 . Motor vehicle importers consistently report that they could respond
quickly to increased demand if New Zealand sales of EVs take off9. Volume and number of models of
EVs coming to market is going to
Under the Waka bounded scenario ~500,000 additional HEV, PHEV or EV vehicles enter
increase significantly, reducing
the light duty vehicle fleet over the five year period from 2020 to 2025. For this to occur
a consumer purchase barrier of
on average ~100,000 or 35 per cent of new or used imports per annum would have
limited vehicle segments and brands
electric powertrains – a significant rise from a total of ~3,000 vehicles in 2015.
being available.
Manufacturers’ research and development focus is now predominantly electric
powertrains, with some manufacturers intending to stop any further internal combustion
engine R&D by 2025. The six renowned Japanese automobile manufacturers (Toyota,
Nissan, Honda, Suzuki, Mazda and Mitsubishi) all have expansive targets and plans
to increase production capacity of EV car models. Similarly, the main European
manufacturers that supply the New Zealand car market (Volkswagen, BMW, Mercedes-
Benz, Audi and Renault) have consistent plans. The most prominent example is BMW
with its recent public announcement that “the future is electric – a new strategy to roll
out more electric cars and add self-driving features faster than their rivals”.
89
8 International Energy Agency Global EV
outlook 2016
9 Emission Impossible final report for Ministry
of Transport 30 June 2015Z Energy House View: Electric vehicles 09
2. Can the electricity sector meet the additional demand requirements from EVs?
New Zealand is one of the most EV-ready countries in the world with its high base of No constraints with enough
renewable electricity and essentially the necessary network infrastructure to support renewable generating capacity
PHEV uptake, if only because of all the suburban garages with an ordinary three-pin consented but unbuilt to power
socket. Although there is some uncertainty over how smart charging could manage every car in the country.
electricity distribution flexibility, New Zealand is uniquely placed in having planning
consent for enough wind farms, hydro and geothermal power stations to cover about
a 25 per cent increase in demand for electricity10.
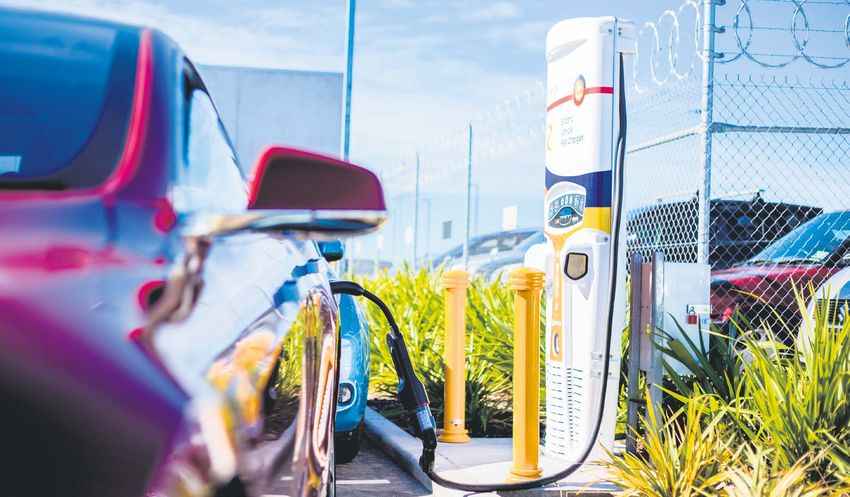
3. Will the rate of available EV charging infrastructure support exponential EV uptake?
International trends show the availability of charging infrastructure is a factor positively Charging infrastructure
correlated to growth in EVs. development is relatively low cost
and underway to support future
The Electricity Networks Association [ENA] comprises a working group of
EV uptake, alleviating consumer
representatives from lines companies along with Contact Energy, Mercury and Drive
anxiety over short range and long
Electric, looking at a co-ordinated approach to accessible public charging infrastructure.
charging times.
The association is working towards putting in place a ‘renewables highway’ that provides
public accessibility to charging11 .
The renewables highway would potentially see a network of charging locations at key
stopping points and tourism locations along State Highway 1, expanding to regional
routes over time. This backbone could then encourage further charging infrastructure
by other businesses including airports, retailers, supermarkets, tourist destinations and
other places where people park their vehicles.
Auckland-based private company, Charge.Net.NZ is also rolling out a national network
of fast-charging stations with over 100 sites already in place. A fast charger can fully
charge a car in 10-25 minutes. While many public AC chargers are free, a fast DC charger
can cost up to $40,000 to install.
1011
New Zealand is
one of the most EV-
ready countries.
10 From public statements made by Mercury (formerly
Mighty River Power)
11 http://ena.org.nz/lets-get-the-electric-vehicle-
revolution-going/10
Appendix A
Charts for EV uptake
Electric vehicle scenarios PHEV scenarios
1,300,000 1,300,000
1,200,000 1,200,000
1,100,000 1,100,000
1,000,000 1,000,000
900,000 900,000
800,000 800,000
No’s
No’s
700,000 700,000
600,000 600,000
500,000 500,000
400,000 400,000
300,000 300,000
200,000 200,000
100,000 100,000
0 0
2010 2015 2020 2025 2030 2035 2040 2045 2050 2010 2015 2020 2025 2030 2035 2040 2045 2050
Year Year
Source: BEC NZ 2050 Scenarios and MOT data Source: BEC NZ 2050 Scenarios and MOT data
EV – Actual EV – Waka PHEV – Actual PHEV – Waka
EV – Kayak EV – Range PHEV – Kayak PHEV – Range
HEV Scenarios
1,300,000
1,200,000
1,100,000
1,000,000
900,000
800,000
No’s
700,000
600,000
500,000
400,000
300,000
200,000
100,000
0
2010 2015 2020 2025 2030 2035 2040 2045 2050
Year
Source: BEC NZ 2050 Scenarios and MOT data
HEV – Actual HEV – Waka
HEV – Kayak HEV – RangeZ Energy House View: Electric vehicles 11
Appendix B
Charts for petroleum demand impact
Transport fuel consumption scenarios – petrol Transport fuel consumption scenarios – diesel
3,500 3,500
3,000 3,000
2,500 2,500
mlpa
mlpa
2,000 2,000
1,500 1,500
1,000 1,000
500 500
0 0
2010 2015 2020 2025 2030 2035 2040 2045 2050 2010 2015 2020 2025 2030 2035 2040 2045 2050
Year Year
Source: BEC NZ 2050 Scenarios and MOT data Source: BEC NZ 2050 Scenarios and MOT data
Petrol Consumption Actual Petrol – Waka (ml) Diesel Consumption Actual Diesel – Waka (ml)
Petrol – Kayak (ml) Petrol Consumption Range Diesel – Kayak (ml) Diesel Consumption Range
Transport fuel consumption scenarios – petrol Transport fuel consumption scenarios – diesel
3,400 3,400
3,200 3,200
3,000 3,000
2,800 2,800
mlpa
mlpa
2,600 2,600
2,400 2,400
2,200 2,200
2,000 2,000
1,800 1,800
13 13
20 4
20 4
15
20
15
20
20 7
20 7
18
18
20 6
20 6
20 9
20 9
21
20 2
20 3
20 4
25
20 6
27
20 8
29
30
21
20 2
20 3
20 4
25
20 6
27
20 8
29
30
20 20
1
1
1
1
1
1
1
1
2
2
2
2
2
2
2
2
2
2
20
20
20
20
20
20
20
20
20
20
20
20
20
20
20
20
Year Year
Source: BEC NZ 2050 Scenarios and MBIE data Source: BEC NZ 2050 Scenarios and MBIE data
Petrol Consumption Actual Petrol – Waka (ml) Diesel Consumption Actual Diesel – Waka (ml)
Petrol – Kayak (ml) Petrol Consumption Range Diesel – Kayak (ml) Diesel Consumption Range12
For investor
relations contact:
Jonathan Hill
e Jonathan.Hill@z.co.nz
p +64 4 498 0212
View or update your holdings and
other investor details on the website
of our Registry, Link Market Services:
www.linkmarketservices.co.nz
Alternatively, contact our Registry via:
e operations@linkmarketservices.co.nz
m Link Market Services, PO Box 91976,
Auckland 1142, New Zealand
f +64 9 375 5990
p +64 9 375 5998
z.co.nz
ZenergyNZ
ZenergyNZ
ZenergyNZ
z-energy-limitedz.co.nz
You can also read