Impact Summary: Increases to Petrol Excise Duty and Road User Charges - Ministry of Transport
←
→
Page content transcription
If your browser does not render page correctly, please read the page content below
Impact Summary: Increases to Petrol
        Excise Duty and Road User Charges
Agency Disclosure Statement
The Ministry of Transport is solely responsible for the analysis and advice set out in this
Regulatory Impact Summary, except as otherwise explicitly indicated. This analysis and
advice has been produced for the purpose of informing key policy decisions to be taken by
Cabinet.
It provides an analysis of options to ensure there is sufficient revenue available through the
National Land Transport Fund (NLTF) to deliver on the Government’s land transport
investment priorities, as set out in the Government Policy Statement on land transport (GPS)
2018.
On balance, a steady series of regular increases to the petrol excise duty (PED) rate and
equivalent percentage increases to road user charges (RUC) rates over the next three years
is recommended in order to provide sufficient revenue to implement GPS 2018 without
imposing unreasonable additional costs on individuals and businesses.
Responsible Manager:
Marian Willberg
Manager, Demand Management and Revenue
Ministry of Transport

14/06/2018

                                              1
Background
The purpose of this regulatory impact summary is to evaluate options for increasing
transport revenue to fund the implementation of the Government Policy Statement on land
transport 2018 (GPS 2018).
GPS 2018 will signal the Government’s land transport investment priorities for the next ten
years. This investment will be funded through revenue derived mainly from several
hypothecated taxes and charges1, including petrol excise duty (PED) and road user charges
(RUC). This revenue is channelled into the National Land Transport Fund (NLTF). Most
NLTF revenue comes from PED, RUC and motor vehicle registration fees (MVR) broken
down as follows:
PED - net revenue $1.896 billion in 2016/17
RUC - net revenue $1.469 billion in 2016/17
MVR - net revenue $223 million in 2016/17
In addition, Crown funding enables public monies to be spent on specific or general activities
using funds appropriated by Parliament through the Budget process. Decisions regarding
Crown funding are made by Cabinet.
Both NLTF and Crown funding have been oversubscribed in the past.
Forecasting work for GPS 2018 has shown that in order to deliver on all of the Government’s
priorities for land transport as outlined in the GPS, additional revenue will be required. This
regulatory impact summary considers the following three options, of which Option 2 is
preferred:
Option 1: retain the status quo;
Option 2: increase road users’ contributions through PED and RUC; and
Option 3: use alternative funding mechanisms.
Key limitations/constraints on analysis
Time constraints
The Road User Charges Act 2012 requires 42 days between the gazetting of new RUC rates
and when the new rates go into effect. New RUC rates will need to be gazetted by 16 August
2018 for the new rates to come into force by 1 October 2018, as indicated by the Minister of
Transport.
Constraints on cost-benefit analysis
The GPS 2018 will set funding ranges for different types of activity (for example, road
policing, public transport, state highways). However, the New Zealand Transport Agency
(NZTA) will determine the specific projects that will be funded within those ranges, through
the National Land Transport Programme (NLTP). This limits the scope of cost benefit
analysis that is possible at this stage.
As part of the process of developing the NLTP, the NZTA will conduct cost-benefit analysis
on individual projects that are proposed to be funded (fully or partially) out of the NLTF.
1 The revenue is ‘hypothecated’ in the sense that there are legislative constraints (in the Land Transport
Management Act 2003) that govern how this revenue can be used.
2Data constraints
The Ministry of Transport uses a Cost Allocation Model (CAM) to indicate appropriate RUC
rates. The CAM calculates ‘base rates’ for each vehicle type, taking into account a number
of factors, including the weight of the vehicle, size of the vehicle (amount of space taken up
on the road) and the number of axles, which impacts the amount of road wear caused by the
vehicle (more axles generally means less road wear).
The actual RUC rates set in regulations are generally higher than the base rates because a
level of over-recovery from the system is necessary to fund additional investments.
Because the amount of money spent in different areas (for example, maintenance, road
policing) can change from year to year, the CAM base rate for each RUC vehicle type can
move up and down, while actual RUC rates only stay static or increase. For 2018, these
factors have produced a situation where actual RUC rates are considerably higher for a
number of very heavy vehicle types (some by up to 40 percent) than the CAM base rates for
those vehicle types would indicate.
The CAM is vulnerable to fluctuations in terms of the base rates, because it only looks back
one year. The Ministry of Transport intends to review the CAM in the near future.
Constraints on options analysis
During consultation, some submitters suggested alternative options to increasing PED and
RUC, such as congestion pricing and tolling. These options were considered out of scope as
a short-term solution to funding the Government’s transport priorities, as outlined in the GPS
2018. These options are being considered through other Ministry of Transport work that is
looking at medium to long-term solutions for addressing the transport funding gap.
Assumptions underpinning impact analysis
The purpose of this project is to generate additional revenue needed to fund the
Government’s transport priorities, as outlined in the GPS 2018.
Cabinet will be taking decisions on the level of desired expenditure at the same time as
considering any proposed increases in PED and RUC, so the analysis is based on achieving
levels of revenue required to fund expenditure targets in the draft GPS 2018. The analysis is
based on forecast revenue as at April 2018. Forecasts are subject to change and may
impact the magnitude of increases required in 2019 and 2020.
The Ministry of Transport has also assumed investment through the NLTP will have an
overall cost-benefit ratio greater than one, so there will be a net benefit from a higher level of
investment.
Status quo and problem definition
Status quo
Transport is crucial to the New Zealand economy and a well-directed, future-proofed,
focussed, multimodal network has huge benefits for productivity, jobs, business growth, and
social well-being.
Investment in the land transport network is mainly funded by several hypothecated revenue
sources including PED and RUC. Investment in the land transport system over the next ten
years will be guided by the funding ranges set in GPS 2018. The priorities laid out in GPS
32018 will inform the development of the NLTP, which details, at a project level, how the land
transport revenue will be spent.
PED is the largest contributor to the NLTF (approximately 53 percent of NLTF revenue).
PED is a fixed rate (currently 59.524 cents) which is added to every litre of petrol purchased.
Every user is subject to the same rate of PED, regardless of vehicle size or configuration.
Revenue generated from PED depends on the amount of fuel consumed. Vehicle fuel
efficiency and vehicle kilometres travelled (VKT) are key factors that affect fuel consumption.
Fuel efficiency of the light petrol fleet has been improving for a number or years and is
predicted to continue to improve as the uptake of more fuel efficient vehicles and electric
vehicles increases. The downward slope on the graph below shows that, on average, fewer
litres of petrol will be required to travel 100 kilometres. Based on historical figures, the share
of PED revenue in the NLTF is slowly dropping.
Figure 1: Estimated fuel efficiency of petrol light fleet (litres / 100km)
11.00
10.50
10.00
(L/100km)
9.50
Trend
Forecast
9.00
8.50
8.00
The RUC system (approximately 39 percent of NLTF revenue) consists of a set of distance
based charges, which differ depending on the size, weight and configuration of the vehicle.
The system is designed to account for, and recover charges based on, the different impacts
imposed on the road network by different types of vehicles.
VKT can affect both PED and RUC revenue. Modelling shows that VKT is increasing; this
includes an increase in both petrol and diesel VKT. VKT could be affected by a modal shift
towards public transport, active modes, coastal shipping or rail freight. This could potentially
be induced by increased investment in these modes from the NLTF. However, this hinges on
whether there will actually be significant uptake of these modes over time, which is difficult to
predict.
4Ministry of Transport modelling assumes that economic growth is correlated with VKT. For
example, VKT growth stalled during the Global Financial Crisis, however, we are unsure of
the causal relationship between these two variables.
The NLTF model also assumes that increases in fuel prices decrease VKT. This is
supported by economic analysis that was done for the model in the past. The elasticities
calculated for this assumption are relatively low, so the overall effect is assumed to be
relatively small, reflecting that people still depend heavily on road travel despite the price of
fuel.
NLTF revenue is also generated from MVR fees, property sales and a variety of other
sources which are, collectively, much smaller than PED or RUC. The NZTA also has the
ability to make limited use of financing, which is repaid out of the NLTF.
The hypothecated revenue streams outlined above have not been sufficient to meet
transport investment requirements over the past decade. As shown in Appendix 1, PED and
RUC rates have been increased consistently over this period in response to revenue
shortfalls.
For some projects, the Crown has needed to inject additional revenue sourced from general
taxation to meet the costs. In the past, Crown funding has been used for specific transport
projects outside of the scope of the GPS (e.g. funding rail infrastructure) or where the
government has an interest in the specification and delivery of a project (e.g. City Rail Link).
Crown funding has also been used to establish funds that may operate independently of the
NLTF or leverage the NLTF (e.g. the Urban Cycleway fund and the Provincial Growth Fund).
Both NLTF and Crown funding sources have been oversubscribed in the past.
Problem definition
Modelling work conducted by the Ministry of Transport and the NZTA has shown that in
order to deliver on all of the Government’s priorities for land transport as outlined in the draft
GPS 2018, additional revenue will be required. As noted above, this has been a recurring
issue over the past decade.
The draft GPS 2018 proposes approximately $45.1 billion of investment over the next ten
years. Revenue forecasting projects that, at current rates of PED and RUC, land transport
revenue will total approximately $40 billion over the period covered by the GPS 2018,
creating a shortfall of approximately $5 billion over ten years.
Objectives
The options should achieve the following key objectives:
that sufficient revenue will be available over ten years to implement the spending
priorities included in the GPS 2018
that any additional costs should be reasonable for users.2
The following objectives have also been taken into consideration:
2 This includes that individual road user charges rates are in proportion to the costs generated by different types
of vehicles subject to RUC.
5 that, so far as practical, the pay-as-you-go model for land transport funding is
preserved
that the hypothecated revenue model for land transport funding is preserved
Who is affected and how?
Importers and producers of petrol will be affected by increases in PED, because they will need
to pay additional costs per litre of petrol produced in New Zealand or imported into the country.
Our best understanding is that this cost is generally reflected in retail petrol prices (the point
at which the tax is recovered from road users), so the net impact is likely to be limited for this
group.
Most New Zealanders will be affected either directly or indirectly by an increase in PED and
RUC rates. Individuals and businesses will be directly affected by the rate increases through
higher travel costs as a result of the increases. Individuals and businesses will also be
indirectly affected through the higher cost of goods resulting from freight companies passing
their increased travel costs onto consumers.
Constraints on the scope for decision making
As mentioned in the ‘constraints on analysis’ section, there are inconsistencies with the current
RUC system which can result in significant differences between base rates and regulated RUC
rates for a number of heavy vehicle types. This constrains the amount that rates can be raised
on these vehicles, because the current regulated rates are already over-recovering (according
to modelling).
Legislation that will allow Auckland Council to apply an additional 10 cents in tax (excluding
GST) on each litre of fuel sold in the Auckland region is likely to come into force on 1 July
2018. It is anticipated that the 10 cent per litre regional fuel tax will be collected in Auckland
from the day the legislation comes into force. The existence of a regional fuel tax in Auckland
constrains the ability of the Government to increase PED and RUC rates as further rate
increases across the country will place an additional burden on businesses and individuals in
the Auckland region.
As part of decisions on the draft GPS 2018, Cabinet agreed that the Minister of Transport
would report back to the Cabinet Economic Development Committee on increases to PED of
between 3-4 cents per litre per year for three years (with equivalent increases in RUC). This
constrains the magnitude of increases that can realistically be considered. The 3-4 cents
increase per litre range has been included in public engagement on the draft GPS 2018.
Options and Impact analysis
Officials have identified the following three options for consideration:
Option 1: retain the status quo;
Option 2: increase road users’ contributions through PED and RUC; and
Option 3: alternative funding mechanisms.
Options one and two have been evaluated against the following criteria:
6 Revenue – the option generates sufficient revenue to implement the investment
priorities laid out in GPS 2018
Fairness – the additional costs imposed on road users are reasonable
Equity – different groups of road users are contributing in proportion to the costs
they generate.3
Option 1 – Status quo
This option would retain the current PED and RUC rates. Total revenue generated over the
next ten years under this option is approximately $40 billion.
Rating against revenue criteria - low
This option generates approximately $5 billion less than what is required to fund the
expenditure levels outlined in GPS 2018.
Maintaining the status quo means it would be necessary to:
fund transport investment from general taxation revenue, which would go against the
objectives of preserving the pay-as-you-go and hypothecated revenue models;
use a larger programme of financing than what is already proposed, which would
impose additional costs on the NLTF over time; or
the NZTA will need to scale back its planned programme of investment (which would
result in additional costs for road users from continuing congestion, particularly in
large urban areas like Auckland).
Rating against fairness criteria – medium/high
This option would impose no additional direct financial costs on road users as current rates
of PED and RUC would remain at current levels. However, there may be some additional
costs associated with externalities (for example, worsening congestion resulting from
reduced investment in the road network).
Rating against equity criteria – medium
Drivers of light petrol vehicles currently contribute roughly five percent more revenue per
kilometre through PED (5.83 cents per kilometre) than drivers of light diesel vehicles through
RUC (5.39 cents per kilometre), which is not appropriate given the different types of vehicle
impose the same costs on the road network. Additionally, the RUC rates set in regulations
over-recover compared to the indicative base rates for a number of heavy vehicle types
Option 2 – increase road users’ contributions through PED and RUC
This is the preferred option, because PED and RUC are the largest contributors to the NLTF.
The only feasible way to generate sufficient revenue, and preserve a user-pays approach, is
to increase PED and RUC rates. We have assessed two different options, because there are
different ways of calculating increases to RUC rates.
Increasing the PED rate
There are two ways to increase the PED rate:
3 For example, drivers of light petrol vehicles contribute on a per-litre basis through PED. Drivers of light diesel
vehicles contribute on a per-kilometre basis through RUC. These vehicles impose roughly the same costs
on the road network, so should be contributing roughly the same amount of revenue.
7 a one-off, sharp increase of 10.5 cents per litre in 2018 (necessary to achieve
sufficient revenue)
three incremental increases spread across 2018, 2019 and 2020 (3.5 cents per litre
per year for the next three years)
The Ministry of Transport has assumed that a series of incremental increases to the PED
provides the best fit with the Government’s objectives, because it achieves the necessary
revenue while spreading the increased burden for road users over several years.
Increasing the RUC rate
Because the RUC system makes use of a number of different rates, it is not possible to
increase RUC in the same way as PED. The preferred approach is to increase total RUC
revenue by a percentage amount equivalent to the increase in PED (5.9 percent for 2018).
There are different ways to achieve an equivalent increase in total RUC revenue, so the
Ministry of Transport has assessed Options 2A and 2B below, which are:
Option 2A – Three increases in PED of 3.5 cents per litre, and three increases in total RUC
revenue of an equivalent percentage amount (5.9 percent for 2018).
Rating against revenue criteria – high
This option would generate revenue of approximately $45.22 billion over 10 years. This is
approximately $100 million more than the $45.1 billion required to implement the GPS 2018.
Table 1 shows how much revenue will be generated by this option.
Table 1: Revenue generated over 10 years by Option 2A (in $billions)
Net PED Net RUC Net MVR Other Total
22.862 19.211 2.373 0.780 45.226
Rating against fairness criteria – medium
Because increased costs will be spread over several years, the Ministry considers that the
additional costs are reasonable. No road users will see costs increase by more than 10
percent in a given year (unless the amount of travel increases dramatically, in which case
costs would increase even if rates remain at current levels).
Rating against equity criteria – medium
For 2018, the proposed increase in PED and RUC rates would move light petrol vehicles
(5.98 cents per kilometre) closer to light diesel vehicles (5.91 cents per kilometre). However,
average petrol consumption rates are declining, so PED revenue per kilometre will likely
decline over time. This option would spread RUC rate increases across vehicles weighing 18
tonnes or less, where over-recovery is generally less pronounced, and avoid increasing
rates on vehicles already subject to high rates of over-recovery.
Option 2B – Three increases in PED of 3.5 cents per litre, and three increases in total RUC
revenue equivalent to the per-kilometre increase in PED revenue (2.7 percent for 2018).
This option would increase PED revenue by the same amount as option 2A, but takes a
different approach to RUC. A higher PED rate will increase the amount of revenue generated
8per kilometre. This option would align the increase in total RUC revenue with this number.
For 2018, this would increase total RUC revenue by 2.7 percent.
Rating against revenue criteria – low
This option would generate approximately $44.16 billion over ten years, approximately $1
billion less than the revenue necessary to implement the GPS 2018. This is because RUC
revenue will be approximately $1.1 billion lower under this option than under Option 2A.
Table 2 shows the breakdown of revenue over ten years for Option 2B.
Table 2: Revenue generated over ten years by Option 2B (in $billions)
Net PED Net RUC MVR Other Total
22.862 18.149 2.373 0.780 44.164
Rating against fairness criteria – medium
This option has similar fairness implications as Option 2A. Costs for road users who pay
PED will increase by the same amount over three years. Costs for road users who pay RUC
will increase by less than they would under Option 2A.
Rating against equity criteria – medium
This option would move towards parity between light petrol vehicles (5.98 cents per
kilometre) and light diesel vehicles (5.73 cents per kilometre) in terms of revenue generated.
It also provides space for per kilometre PED revenue to erode (due to falling petrol
consumption) while still moving towards parity. This option would mainly limit RUC rate
increases to vehicle types weighing nine tonnes or less
Option 3 – alternative funding mechanisms
Alternative mechanisms for addressing the gap between revenue and expenditure were also
considered. This included short and long term borrowing options, Crown funding, scaling
back expenditure, using the Provincial Growth Fund (PGF) and alternative funding and
financing mechanisms such as value capture.
NZTA has legislative authority to conduct short-term borrowing. This provides a
means for smoothing cash-flows (both expected seasonal variations and
unanticipated costs) within the NLTF. Short term borrowing will be used alongside
increases in road users’ contributions.
Long term borrowing is more problematic for the pay-as-you-go model, and the NZTA
would still need to manage any long term debt commitments within NLTF revenue.
Long term borrowing will be used alongside increases in road users’ contributions.
Revenue from general taxation is committed to other priority areas. There is
insufficient Crown revenue to fund transport priorities.
The State Highways Improvement activity class and the Rapid Transit activity class
have already been scaled back significantly. Further reducing the funding available in
these activity classes would risk not meeting the Government’s investment priorities.
The PGF will provide opportunities for additional investment in land transport that will
support regional development.
A cross-government programme of work on alternative funding and financing options for
infrastructure is currently underway. Deliverables from this programme are likely to be
9medium to long term solutions, and it is unlikely that the revenue generated will be sufficient
to bridge the gap between revenue required to implement the GPS 2018, and revenue that is
forecast at current rates of PED and RUC. While these options may be applied as part of a
revenue solution, the Ministry of Transport has not analysed option 3 against the criteria
because it does not provide a good fit with any of the objectives we are trying to achieve
through this analysis. As mentioned under key constraints/limitations on analysis, the
Ministry of Transport is currently progressing work that looks at medium to long-term
solutions for addressing the transport funding gap.
Impacts of the preferred option
Option 2A is the preferred approach, because it performs best against the criteria laid out in
the previous section, and also provides the best fit with the objectives.
Costs and benefits
It is not possible to complete a detailed cost benefit analysis at this time, because the
individual projects that will be funded by this revenue have not yet been defined. This will
happen as part of the development of the NLTP, at which point the NZTA will carry out
detailed cost-benefit analysis on the individual projects.
It is relatively simple to define the additional direct costs: approximately $5 billion in
additional costs to road users over ten years through higher rates of PED and RUC.
Businesses will bear a high share of this additional cost, particularly additional RUC costs.
However, the Ministry of Transport is assuming that most of this cost will be passed on to
individual road users.
The types of benefits achieved by the proposed changes will include reduced congestion,
greater accessibility, safety benefits and increased walking and cycling.
For the purposes of this analysis, the Ministry of Transport is assuming that the overall NLTP
programme will have a BCR of greater than one, so there will be a net-benefit from a higher
level of investment. The Ministry of Transport has conducted analysis of the average BCRs
of a range of projects in each of the GPS activity classes (for example, state highway
improvements, public transport). This analysis shows a wide range of BCRs across different
activity classes, with the lower end of the range sitting around two. This supports the
assumption that the overall programme of NLTP investment will have a net benefit.
We have also assumed that the cost to road users of paying additional PED and RUC is 1:1.
Equity and fairness
The NLTF funds the majority of transport expenditure. The NLTF is made up of transport
users’ contributions such as PED, RUC, and MVR. As previously noted, the rate of PED is
the same for every litre of petrol imported into or produced in New Zealand, while RUC rates
differ depending on the size and configuration of the vehicle.
The amount of money from the NLTF spent in different areas (for example, maintenance,
road policing) can change from year to year. For 2018, there is a situation where actual RUC
rates (as set in regulations) are considerably higher for a number of very heavy vehicle types
(some by up to 40 percent) than the indicative base rates for those vehicle types would
suggest they should be. Under the preferred approach, rates will not increase for these
vehicle types. The rates that will increase are generally over-recovering by a much smaller
amount.
10To manage this issue, it is proposed that RUC rates are increased according to the preferred
option for 2018, but for the next two rounds of increases, the Ministry of Transport will:
undertake thorough engagement with the heavy vehicle sector; and
establish a more data-driven approach for RUC increases in the following two years.
Those who pay PED and RUC should benefit from investment in the land transport network.
While a large share of GPS 2018 spending is targeted towards urban areas, there is
allowance for increased spending on projects in the regions, for example, increased
spending on local roads. Until the NLTP is finalised, it is not possible to accurately define the
impact on urban and rural areas.
Petrol consumption
Demand for petrol is relatively inelastic; a 10 percent rise in the price of petrol will affect
consumption as follows:
petrol consumption will decrease by 1.5 percent in the first year; and
petrol consumption will decrease by 2 percent after two years.4
Social equity impacts
Taxes that increase the cost of using vehicles such as PED and RUC, may be regressive as
they will increase the cost of non-discretionary travel (for example, travel to work by car
where there is no viable alternative). Travel costs typically account for a larger share of
income or expenditure in low-income households than high-income households, but the
overall regressive impact is likely to be small since low-income households generally do less
mileage. Deciles 1 and 2 households and deciles 5 to 8 households spend eight percent and
six percent of their income on private travel costs respectively.
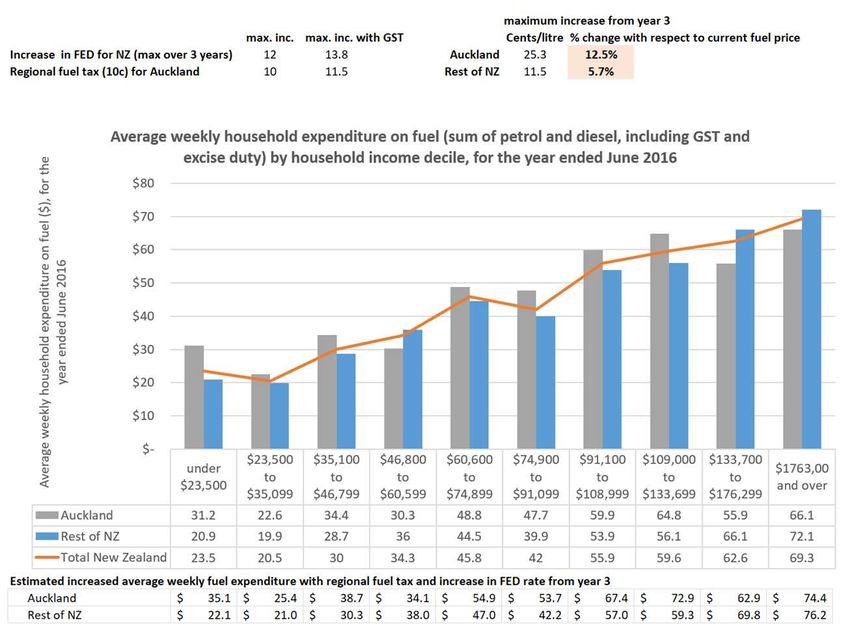
The Ministry of Transport has done some analysis on how much more households will have
to spend on fuel per week, assuming three annual increases in the PED rate. Table 3
illustrates the increased spending for households in Auckland, and the rest of the country
(reflecting that fuel prices will increase more in Auckland because of the 10 cents per litre
regional fuel tax).
4 *Kennedy, D., *Wallis, I. 2007. Impacts of fuel price changes on New Zealand
transport. Land Transport New Zealand Research Report 331.
11Table 3 – Estimated additional household spending on petrol and diesel
It can be argued that PED is more regressive than RUC because low-income households
own older, less fuel efficient cars, and tend to live in the suburbs where housing costs are
less (they will use more fuel and pay more PED as a result). However, there is no direct
evidence to support this and it can also be argued that wealthier families own larger vehicles
that use more fuel.
Due to time and data constraints, the Ministry of Transport has not been able to do a
thorough analysis of the distributional impacts of the proposed increase in PED and RUC.
Therefore, the exact distributional impacts are unknown. The Ministry of Transport is
developing a process for carrying out qualitative assessment of distributional impacts. Once
developed, this will be an important tool for screening various types of policy interventions,
including transport pricing options. The Ministry of Transport will carry out further analysis of
the distributional impacts of transport pricing including PED and RUC.
The Ministry of Transport acknowledges that low-income households are likely to be
relatively more affected by the proposed PED and RUC increases. This is because the price
increase will increase their total spending on fuel by a larger percentage of their incomes
than for high income households. However, the Ministry assumes that the overall impact of
the increases will be relatively small. Additionally, the preferred option will likely lessen the
impact of rate increases on lower-income households by spreading increases across three
years.
The Ministry of Transport has assumed that any workforce participation impacts will be
negligible because the regressive nature of PED and RUC will be balanced out by other non-
12transport related Government interventions (for example, increases in the minimum wage
and increased Working for Families payments).
Many of the investments resulting from the priorities signalled in the GPS 2018 are likely to
benefit low-income households by providing greater transport choice that is more accessible
and affordable.
Compliance and administration costs
The system should be as simple and low cost as possible for taxpayers to comply with and
to administer. Increasing PED and RUC rates is a relatively standard procedure that has
been done many times before. It will be relatively simple and low-cost to administer the
changes, and those subject to PED and RUC will not have to change their behaviour to
comply.
Speed of implementation
The Minister of Transport has indicated that the proposed rate changes should come into
force on 1 October 2018. We will be able to fulfil the legislative and administrative
requirements in time to enable the new rates to come into force by 1 October 2018.
Consultation
The Treasury, the NZTA, the NZ Customs Service and the Ministry of Business, Innovation
and Employment were consulted on the proposals in this regulatory impact summary. The
Department of Prime Minister and Cabinet and were informed.
The Cabinet paper seeking approval of GPS 2018 contains reference to increases in PED
and RUC being required to deliver the programme of investment. Possible increases to PED
and RUC have been publically announced and formed part of the public engagement on the
draft GPS 2018.
Possible increases in PED and RUC were included in public engagement on the draft GPS
2018. There were mixed reactions to the proposed changes to PED and RUC. Many
submitters accepted that increases in PED and RUC would be necessary to deliver on the
Government’s priorities, to create livable cities and thriving regions. However, some
submitters were strongly opposed to the increases.
Outside of formal submissions on the draft GPS, around 100 pieces of correspondence were
also received by the Minister and Ministry of Transport that provided negative feedback on
the proposed increases. The correspondence was generally concerned that the increases
would impact disproportionately on households with lower or fixed (e.g. work and income
benefit) incomes, particularly in Auckland when coupled with the regional fuel tax.
Implementation and operation
For the 2018/19 financial year, PED and RUC rates can both be amended by Order in
Council. For the PED rate, this involves amending the Customs and Excise Act 1996 (the
Customs Act).5 The following PED increase (for 2019/20) will require a full legislative
process, perhaps through Budget legislation in mid-2019. There is only one PED rate, so this
is a relatively straightforward change.
5 Section 79A of the Customs Act allows for the PED rate (called motor spirits excise in the Customs Act) to be
raised by Order in Council in the second or third financial year after the financial year in which the current
rate was set. The current rate was set in July 2015.
13The New Zealand Customs service is responsible for administering and collecting PED. To
implement new PED rates by 1 October 2018, Customs must be given sufficient warning to
enable them to change their systems as necessary.
The RUC system consists of a set of distance based charges, which differ depending on the
size, weight and configuration of the vehicle. For this reason, changing RUC rates is a more
complicated process than for PED. Current RUC rates are set in the Road User Charges
(Rates) Regulations 2015. These will need to be replaced by a new set of regulations.
The NZTA is responsible for administering and collecting RUC. To implement new RUC
rates by 1 October 2018, NZTA must be given sufficient warning to enable them to change
their systems as necessary.
The exact date of implementation of further increases (for 2019 and 2020) is subject to
decisions by the Minister of Transport.
Monitoring, evaluation and review
Revenue forecasts are regularly updated with updated economic growth and actual revenue
data. These updates will be monitored by the Ministry of Transport, NZTA, and the Treasury,
to determine whether revenue forecasts are accurately projecting the amount of revenue
available to invest in the land transport network.
14Appendix 1: Table of PED increases since 2002
Total petrol
Increase
Date of change Percentage excise duty
(c/L)
(c/L)
Previous 1 January 2002 1.4 4.4% 33.4
increases
1 April 2002 2.8 8.4% 36.2
1 April 2005 5 13.8% 41.2
1 April 2006 0.71 1.7% 41.9
1 April 2007 0.62 1.5% 42.5
1 October 2009 3 7.1% 45.5
1 October 2010 3 6.6% 48.5
1 August 2012 2 4.1% 50.5
1 July 2013 3 5.9% 53.5
1 July 2014 3 5.6% 56.5
1 July 2015 3 5.3% 59.5
Proposed 1 October 2018 3.5 5.9% 63
increases
TBC 2019 3.5 5.6% 66.5
TBC 2020 3.5 5.3% 70
15Appendix 2: Proposed changes to individual RUC rates for 2018/19
Notes on these tables:
These tables detail the RUC rate increases that would result from the preferred approach of increasing total RUC revenue by 5.9 percent. The
tables only include the RUC rates that are proposed to change, rather than all rates. ‘CAM base rate’ refers to the rate calculated by the CAM
for each vehicle type based on NLTF expenditure and distance travelled data for the 2016/17 financial year (this model was run in 2018).
Table 1: Powered vehicles
RUC vehicle type and weight Current rate 2018 CAM base Proposed new rate Proposed new Percentage
(excluding GST) rate (excluding (excluding GST) rate (including increase
GST) GST)
Type 1: Powered vehicles with two axles
Not more than 3.5 tonnes 53.91 54.00 59.13 68.00 9.68%
Between 3.5 and 6 tonnes 59.13 57.49 64.35 74.00 8.82%
Between 6 and 9 tonnes 120.00 111.89 131.30 151.00 9.42%
More than 9 tonnes 253.04 230.75 275.65 317.00 8.93
Type 2: Powered vehicles with one single-tyred space axle and one twin-tyred spaced axle
Not more than 6 tonnes 57.39 57.67 62.61 72.00 9.09%
Between 7 and 9 tonnes 90.83 91.81 99.13 114.00 9.62%
Between 9 and 12 tonnes 123.48 114.89 134.78 155.00 9.15%
More than 12 tonnes 241.74 205.92 246.96 284.00 2.16%
Type 311: Bus
Not more than 18 tonnes 241.74 230.85 263.48 303.00 8.99%
More than 18 tonnes 323.48 259.34 323.51 372.00 Almost zero
Type 6: Powered vehicles with 3 axles
Not more than 12 tonnes 78.26 86.67 86.09 99.00 10.00%
Between 12 and 18 tonnes 253.91 242.69 279.13 321.00 9.93%
More than 18 tonnes 340.00 271.75 340.03 391.00 Almost zero
Type 14: Powered vehicles with 4 axles
All RUC weights 313.91 284.76 340.87 392.00 8.59%
Type 19: Powered vehicles with 5 or more axles
All RUC weights 279.13 254.75 304.35 350.00 9.03%
16Table 2: Unpowered vehicles
RUC vehicle type and weight Current rate 2018 CAM base Proposed new rate Proposed new Percentage
(excluding GST) rate (excluding (excluding GST) rate (including increase
GST) GST)
Type 24: Unpowered vehicles with 1 axle
All RUC weights 99.13 62.25 99.14 114.00 Almost zero
Type 28: Unpowered vehicles with two axles
Not more than 10 tonnes 34.78 32.05 38.26 44.00 10.00%
More than 10 tonnes 223.48 221.38 243.48 280.00 8.95%
Type 29: Unpowered vehicles with two twin-tyred or single large-tyred close axles
Not more than 10 tonnes 32.17 27.27 32.18 37.00 Almost zero
More than 10 tonnes 108.70 75.66 108.71 125.00 Almost zero
Type 30: Unpowered vehicles with two twin-tyred spaced axles
Not more than 10 tonnes 32.17 29.77 32.18 37.00 8.11%
More than 10 tonnes 183.48 103.14 183.50 211.00 Almost zero
Type 33: Unpowered vehicles with three twin-tyred, or single large-tyred, close axles
All RUC weights 146.09 99.98 146.10 168.00 Almost zero
Type 37: Unpowered vehicles with 3 axles
Not more than 10 tonnes 32.17 29.77 34.78 40.00 8.11%
More than 10 tonnes 249.57 198.41 249.59 287.00 Almost zero
Type 43: Unpowered vehicles with 4 axles
All RUC weights 186.96 116.64 186.98 215.00 Almost zero
Type 951: Unpowered vehicles with 5 or more axles
All RUC weights 140.00 92.74 140.01 161.00 Almost zero
17Table 3: Other vehicles
RUC vehicle type and weight Current rate 2018 CAM base Proposed new rate Proposed new Percentage
(excluding GST) rate (excluding (excluding GST) rate (including increase
GST) GST)
Type 402: Vintage powered vehicles with two axles
More than 12 tonnes 158.26 145.99 173.91 200.00 9.89%
Type 403: Vintage powered vehicles with 3 axles
All RUC weights 139.13 128.97 153.04 176.00 10.00%
Type 404: Vintage powered vehicles with at least 4 axles
All RUC weights 142.61 131.38 156.52 180.00 9.76%
Towing vehicle types for specific combinations
Type 308 (all RUC weights) 312.17 234.39 337.39 388.00 8.08%
Type 309 (all RUC weights) 246.96 231.28 271.30 312.00 9.86%
Type 408 (all RUC weights) 289.57 238.53 314.78 362.00 8.71%
Large motor caravan types
Type 413 (more than 18 tonnes) 246.09 212.97 246.11 283.00 Almost zero
Type 414 (all RUC weights) 213.91 189.10 213.93 246.00 Almost zero
H types
H91 (all RUC weights) 279.13 202.28 304.35 350.00 9.03%
H94 (all RUC weights) 313.91 237.32 340.87 392.00 8.59%
H97 (all RUC weights) 246.96 168.94 271.30 312.00 9.86%
18You can also read