The International Communications Market 2017 - 5 TV and audio-visual - Ofcom
←
→
Page content transcription
If your browser does not render page correctly, please read the page content below
The International Communications
                     Market 2017

              5 TV and audio-visual

                                 84
Contents

5.1   TV and audio-visual: overview and key market developments                86
      5.1.1   The UK in context                                                87
      5.1.2   Key market development: Live TV is resilient despite growth in
              video-on-demand services                                         89

5.2   The TV and audio-visual industry                                         95
      5.2.1   Revenues                                                         95

5.3   The TV and audio-visual consumer                                         104
      5.3.1   Digital TV take-up                                               104
      5.3.2   Broadcast television viewing                                     109
      5.3.3   Viewing of domestic publicly-owned channels                      111
      5.3.4   Legacy terrestrial channels viewing                              112
      6.3.2   Listening to audio content                                       126

                                                                                     85
5.1 TV and audio-visual: overview and key market
developments
Figure 46 Key metrics
NGA
SWE
CHN
NED
KOR
GER
USA
AUS
BRA
RUS
POL
FRA
IND
JPN
ESP
ITA
UK
TV revenue
14 9 21 6 132 23 4 3 3 2 2 7 10 3 8 28 1
(£bn)
Revenue per
218 136 254 105 407 179 163 66 156 185 54 140 49 17 6 20 3
cap (£)
from
70 59 66 39 158 79 86 22 46 52 18 42 23 11 2 9 0.7
advertising
from
90 35 77 45 248 63 58 39 82 92 34 91 26 6 4 11 3
subscription
from public
58 43 111 20 0.3 37 19 5 28 41 2 7 - - 0 - -
funds
Online TV
1,969 724 930 373 13,919 1,002 559 236 313 342 132 314 589 235 175 4,729 0.10
revenues (£m)
Largest TV Dsat/
Dsat IPTV Dsat DTT Dcab Dcab DTT DTT Dcab Acab Dsat IPTV Dsat Dsat Dcab Dsat
platform Dcab
% of homes
40 40 44 69 42 56 61 65 48 35 49 32 46 41 42 46 53
(main set)
DTV take-up
100 98 76 100 98 100 100 100 91 65 88 80 73 74 84 92 77
(%)
Pay TV take-
58 69 57 33 81 75 38 32 98 89 86 96 30 71 92 73 32
up (%)
OTT SVoD
take-up (%TV 41 11 25 9 84 18 28 13 18 40 10 11 11 1 1 8 N/A
hh)*
DSO** date 2012 2011 2008 2012 2009 2012 2013 2010 2006 2007 2013 2012 2018 2019 2018 2020 2017
TV viewing
212 223 223 248 270 262 188 233 183 148 264 193 254 248 N/A 146 N/A
(min/day)
Sources: IHS Markit / industry data / Ofcom.
Notes: Pay-TV take-up refers to the number of TV households that pay for a DTT, satellite, cable or IPTV subscription
service.
Online TV revenues refers to advertising, subscription, retail and rental on-demand revenue derived from online
services delivering TV and video content.
OTT SVoD take-up refers to subscription services that offer video-on-demand content (VoD) delivered via the
internet, or services that offer live streaming to a selection of channels/content as well as VoD content.
For the purposes of this table most figures have been rounded to the nearest whole number.
*Ampere Analysis. Figures include subscriptions to services that offer live streaming and catch-up services delivered
over the internet, such as Netflix, Amazon, Hulu, iQIYI, Hollywood VIP, Youku Premium, Ditto TV, WWE, TVing and
Now TV.
**DSO = Digital switchover.
865.1.1 The UK in context
Global TV revenues exceeded £300bn for the first time in 2016, driven by growth in pay-TV subscriptions
and advertising. Pay TV is still the largest component, making up just over half of total revenue, at
£154bn. The US continued to have the highest TV revenue (£132bn), and the highest revenue per capita
(£407). UK revenue was £14.3bn, and its per-capita revenue of £218 was the third highest among our
comparator countries, behind the US and Germany (£256). Unlike the US, the UK and Germany both
generate a significant proportion of revenues from public funding; the licence fee in Germany generated
£112 per person in 2016, compared to £58 in the UK.
A majority of households in the UK have a pay-TV subscription (58%). There is large variation in the take-
up of pay TV: it is ubiquitous in the Netherlands (98%), Korea (96%), India (92%) and Sweden (88%), but is
only in a third (or less) of homes in Italy, Spain, Brazil and Nigeria.
The number of paid on-demand and streaming subscriptions per 100 television homes has grown across
all comparator countries. The US had the highest number of subscription video-on-demand services
(SVoD) among TV households at the end of 2016 (84), with the UK second at 41 (up by 12 subscriptions
since 2015). Just under a quarter of UK respondents prefer SVoD services as a cheaper alternative to pay-
TV, a similar proportion as in all the comparator countries.
Pay-TV take-up has grown in many countries in recent years, including the UK, where it increased from
55% to 58% between 2011 and 2016. However, the proportion of homes in the US with a pay-TV
subscription fell from 87% in 2011 to 81% in 2016; over this period there was a loss of 3.4 million pay-TV
households. The US is the only market where SVoD take-up is more than half of all households, and close
to saturation (84%), the increasing take-up could be a factor to pay-TV decline in the US, another factor
could be a growing cost to pay-TV households, as average revenue per household has increased in
nominal terms since 2011 (by 22% to £831 per household in 2016), suggesting customers could be moving
away from pay-TV for cheaper alternatives.
The US had the largest total revenue from online TV and video among all of the comparator countries at
£14bn, making up 10% of total TV revenue. The US (£43), Sweden (£35), and the UK (£30) had the highest
per-capita revenues from online TV and video, reflecting high penetration of SVoD services. SVoD and
streaming services were the primary growth drivers, and accounted for the majority of online revenue in
the US (56%) and Sweden (54%); in the UK, subscriptions comprised 40% of total online revenue, behind
online video advertising.
This higher use of on-demand services has contributed to declines in live broadcast television viewing,
which have fallen in most of the comparator countries. In the UK between 2015 and 2016 there was a
year-on-year decline in viewing of live broadcast TV (-3%), with consumers watching an average of 3
hours 3 minutes of live TV each day. Although the figures are much lower than for live viewing, average
time-shifted116 viewing in the UK (29 minutes) was significantly higher than in the other countries where
data were available, contributing to 14% of total daily viewing.
116
Includes any playback within a number of days after live broadcast, as well as pausing or rewinding live TV. Not all
comparator countries measure or report time-shifted viewing; further information on our TV viewing methodology
is presented in Appendix A of the Technical appendix.
87Nevertheless, although viewers are adopting new forms of viewing, live broadcast viewing remains the
way in which most television is watched in the UK (86% live; 14% time-shifted) and in other comparator
countries. Viewer attachment to live TV also remains high: across the comparator countries, more people
said they would miss live TV or films on free-to-access channels than any other service. When asked
which type of content they would miss most if they did not have access to it, 22% of UK respondents
chose live TV or films from free-to-access (FTA) channels, ahead of catch-up services (14%).
The UK also had the highest use of free-to-air (FTA) broadcaster catch-up and on-demand services of all
our comparator countries; 56% of respondents claimed to watch services such as the BBC iPlayer and All4.
The second-highest was Spain (42%) where services such as A la carta deliver content from public service
broadcaster RTVE. In the US, use of FTA broadcaster catch-up services was among the lowest (24%).
The US is the biggest market for television production, and broadcaster spend on content and original
content was greater than all other markets (£40bn total and £16bn for original content). UK broadcaster
spend on content (£8bn) and first-run original content (£3.5bn) was the highest among all European
comparator countries.
Despite having lower per-capita revenues, UK broadcaster spend per head in 2016 equalled that in the US
(£123) and was higher on first-run original content (£53 per capita compared to £50 in the US). Both were
well ahead of our other comparator countries; the next highest was France at £85 per head. Original
content spend made up close to half of spend across most of the comparator countries. In Japan, where
local TV content is prominent, it was just under 80% of all broadcaster spend.
Advances in viewing technology include the growth of ultra-high-definition (UHD; otherwise known as 4K)
TV. Take-up of UHD TV sets grew significantly year on year in each of the comparator countries. In the UK
there were just under two million households with UHD TV sets, making up 7% of UK households. US
households had the highest take-up of UHD sets (9%) among the comparator countries, with substantial
growth in 2016, as the number of households with a UHD TV set increased from 3.9 million to 10.5
million. Across the comparator countries, take-up of UHD TV in the home is still under 10% of TV
households.
885.1.2 Key market development: Live TV is resilient despite growth in video-on-demand
services
Live TV and films shown on free-to-access channels were the most-watched content across all
comparator countries
In all the countries we surveyed, the most popular way of watching video was ‘TV programmes or films at
the time of broadcast on free-to-access channels’. More people said they watched free-to-air broadcasts
than broadcasts on pay-TV, even in the US, where the large majority of households take a pay-TV service.
However, alongside live TV, large numbers of consumers in all countries were watching other services.
The BBC was a pioneer in providing catch-up on-demand services over the internet through the iPlayer,
which launched in 2007, and our survey found that consumers in the UK were most likely to use free-to-
air broadcaster catch-up and on-demand services, with 56% of respondents claiming to watch services
such as BBC iPlayer, ITV Hub and All4; the second-highest reported take-up was in in Spain (43%) where
services such as A la carta deliver content from public service broadcaster RTVE. In the US, use of FTA
broadcaster catch-up services was among the lowest of the comparator countries (24%). Respondents in
the UK and Spain were the most likely to watch video-on-demand services from a pay-TV provider (at 31%
and 29% respectively). The widespread availability of on-demand services means that only a small
proportion of consumers in each country reported recording TV or film – those in the UK (9%) and US
(8%) were the most likely to do this.
Social networking and video-sharing services are part of many consumers’ video watching habits in all of
our comparator countries. Our survey found that consumers in Italy and Spain were the most likely to
watch video on dedicated video-sharing sites such as YouTube (60% in Italy, 55%in Spain) and to watch
video on social media platforms (53% in Italy, 48% in Spain).
Figure 47 Types of content watched: 2017
Proportion of all respondents (%)
76
75
71
70
67
65
62
56
52
48
43
39
39
39
36
36
35
35
34
34
33
29
29
27
27
26
25
25
24
24
24
22
19
17
16
12
TV programmes or films at the time of TV programmes or films at the time of Recorded TV or films Catch-up or on-demand TV or films from
broadcast on free-to-access channels broadcast on paid for channels, free-to-access broadcaster services
including subscription channels and pay-
per-view
60
55
53
48
46
44
44
42
41
41
40
39
38
36
35
33
33
32
31
31
30
29
29
29
28
27
25
25
22
21
21
19
18
18
18
17
16
16
15
15
15
13
12
12
7
TV or films on subscription video- Video from dedicated video Video uploaded (or hosted) on TV or films using video-on- Downloaded video (rented or
ondemand services sharing sites (e.g. YouTube, social media platforms (e.g. demand services through a Pay paid for)
Dailymotion, Twitch) Facebook, Snapchat, Instagram, TV provider
Twitter)
UK FRA GER ITA USA JPN AUS ESP SWE
Source: Ofcom research 2017
Base: All respondents UK=1006, FRA=1038, GER=1012, ITA=1020, USA=1000, JPN=1019, AUS=1008, ESP=1010,
SWE=1000
Q9c [Q15c]. Which of the following types of content do you watch?
89Across the comparator countries, more people would miss live TV or films on FTA channels than any
other service, except in the US, where SVoD ranked highest
When asked which type of video content they would miss most if it were not available, live TV was the
most popular choice in all the countries surveyed, with the exception of the US, where SVoD ranked
higher. In Japan, watching videos on dedicated websites such as YouTube and Niko Niko would be missed
more than any other service apart from live TV.
In the UK, 22% of respondents chose live TV or films from FTA channels ahead of catch-up services (14%).
Catch-up services from FTA broadcasters ranked higher in the UK than in the other comparator countries,
reflecting the high UK use of services such as BBC iPlayer and ITV Hub, as shown above in Figure
47.Thirteen per cent of respondents in the UK chose SVoD services as the service they would miss most if
it were unavailable, compared to only 3% in Japan.
Figure 48 Types of content that would be missed most: 2017
Proportion of all respondents (%)
38
33
33
30
26
26
24
22
17
14
11
11
9
9
9
8
8
8
7
7
7
6
6
6
6
5
5
5
5
5
5
5
4
4
4
4
4
4
4
4
3
3
3
2
2
TV programmes or films at the TV programmes or films at the Recorded TV or film Catch-up or on-demand TV or Watching programmes or films
time of broadcast on free- time of broadcast on paid for films from freeto-access on DVD or VHS
toaccess channels channels, including subscription broadcaster services
channels and pay-per-view
23
15
15
14
13
13
12
12
12
11
11
10
10
9
8
8
7
7
7
6
5
5
5
4
4
4
3
3
3
3
3
3
3
3
3
2
2
2
2
1
1
1
1
1
1
Subscription videoon-demand Video from dedicated video Video uploaded (or hosted) on TV or films using video-on- Downloaded video (rented or
services (e.g. Netflix, Amazon sharing sites (e.g. YouTube, social media platforms (e.g. demand services through a Pay paid for)
Instant Video, Rakuten TV)) Dailymotion, Twitch) Facebook, Snapchat, Instagram, TV provider
Twitter)
UK FRA GER ITA USA JPN AUS ESP SWE
Source: Ofcom research 2017
Base: All respondents UK=1006, FRA=1038, GER=1012, ITA=1020, USA=1000, JPN=1019, AUS=1008, ESP=1010,
SWE=1000.
Q15cb. Which type of content would you miss the most if you did not have access to it?
UK TV households overtook Sweden to have the second largest number of paid-for on-demand and
streaming subscribers per 100 TV households
According to data from Ampere Analysis, UK on-demand and streaming subscribers increased by 3.5
million to 11.2 million in 2016 (41 subscriptions per 100 TV households). The US exceeded 100 million
subscriptions at the end of 2016 (84 subscriptions per 100 TV households). Overall, the number of on-
demand and streaming subscriptions was 16 per 100 TV households across all 16 countries at the end of
2016. The US, the UK and Australia had the largest year-on-year increases in the number of subscriptions
to OTT services per 100 TV households in 2016.
Ampere’s data show that Netflix had the largest number of subscriptions (36 per 100 TV households) in all
of our comparator countries in aggregate, followed by Amazon (24) and China’s IQIYI in third place (14). In
the US, the number of Netflix subscriptions was 40 per 100 TV homes, followed by 26 for Amazon. In the
90UK, the number of Netflix subscriptions was 22 per 100 TV homes, followed by Amazon at 14, with the
rest made up of other paid-for on-demand services such as Now TV and Disney Life.
The Swedish VoD market had the third highest number of SVoD subscriptions per 100 TV homes, and
grew by four subscriptions per 100 in 2016. Alongside the UK and US, the Swedish VoD market is well
established and is led by the success of Viaplay and Netflix, which have the largest number of SVoD
subscriptions per 100 TV households. In 2016 the number of subscriptions to over-the-top services in the
UK overtook that in Sweden.
Figure 49 Subscriptions to over-the-top VoD services per 100 television households: end 2016
Source: Ampere Analysis
Notes: Figures include subscriptions to services that offer video on demand, live streaming and catch-up services
delivered over the internet, such as Netflix, Amazon, Hulu, iQIYI, Hollywood VIP, Youku Premium, Ditto TV, WWE,
TVing and Now TV. All proportion figures have been rounded to the nearest whole number. Figures reflect the total
number of VoD subscriptions, not VoD households, in each country.
Convenience and quality of content were the most-cited reasons for signing up to a SVoD service, in all
countries, but ‘cheaper than pay TV’ was not far behind
Twenty-four per cent of SVoD users in the UK claimed to have signed up for an SVoD subscription because
it was cheaper than traditional pay-TV. This reason was most popular in Australia, where almost half of
respondents (46%) claimed to have signed up for this reason, despite the growing levels of pay-TV take-
up (see Figure 69). SVoD services are typically considerably less expensive than pay-TV subscriptions: for
example, at the time of the research, the cost of a Netflix subscription in the UK (the most popular SVoD
platform in the UK; Figure 49) was £5.99 for basic, £7.49 for standard and £9.99 for premium (which
includes UHD content), whereas Sky pay-TV services started at £20 a month.
The convenience of viewing content at any time was the most popular reason for signing up to an SVoD
provider, in all the comparator countries. This sentiment was most apparent in Sweden (78%), while in
Sweden (34%) and Japan (36%) quality of content was a much less popular reason for subscribing.
91Figure 50 Reasons for signing up to SVoD services: 2017
Proportion of all respondents who pay for subscription (%)
78
72
66
65
64
64
62
61
58
56
54
53
53
51
49
46
46
40
36
35
34
30
27
24
23
22
21
Cheaper than a pay-TV subscription Convenience (i.e. can watch it any time) Quality of content
UK FRA GER ITA USA JPN AUS ESP SWE
Source: Ofcom research 2017
Base: All respondents who pay for subscription, UK=308, FRA=124, GER=233, ITA=209, USA=424, JPN=93*, AUS=250,
ESP=229, SWE=280
Q22c. What are your main reasons for signing up to/ using a subscription VoD service (Netflix / Amazon Instant
Video / Rakuten / other subscription service)?
In the markets where SVoD take-up was highest, half or more respondents chose ‘original content’ as
their reason for signing up
In the markets where take-up of paid-for over-the-top subscription services was highest (Figure 49),
including the US, the UK, Sweden and Australia, half (or more) of respondents claimed that ‘original
programmes made by the service provider’ was a reason why they signed up. SVoD providers have
invested heavily in original content; for example, 59% of Netflix’s expenditure in 2016 was on original
content, mainly US productions.
Across all comparators, a third of respondents, or more, stated that US content was their main reason to
sign up. Among respondents in Japan, this was the second most popular reason to sign up, at 47%, after
back-catalogue films/movies.
In the UK, more than half of respondents (52%) claimed that ‘original programming made by the service
provider’ was their main reason for signing up. This was closely followed by ‘a back-catalogue of films’
(41%), ‘programmes or series made in the US’ (36%) and ‘exclusive content not available elsewhere’
(35%).
92Figure 51 Reasons for signing up to SVoD services, by content type: 2017
Proportion of all respondents who pay for subscription (%)
63
56
55
52
52
51
47
47
44
43
43
40
38
36
36
35
32
32
30
30
29
29
27
27
26
25
24
24
22
22
18
18
18
17
16
0
Programmes/ series made in Programmes/ series made in the Programmes/ series made in Original programmes made by
your country US other countries the service provider
61
56
55
46
44
43
42
41
41
41
40
38
35
31
27
24
23
23
18
17
16
16
14
13
12
12
11
Exclusive content not available Back-catalogue films/ movies Childrens programmes
elsewhere
UK FRA GER ITA USA JPN AUS ESP SWE
Source: Ofcom research, 2017
Base: All respondents who pay for subscription, UK=308, FRA=124, GER=233, ITA=209, USA=424, JPN=93*, AUS=250,
ESP=229, SWE=280
Q22c. What are your main reasons for signing up to/ using a subscription VoD service (Netflix / Amazon Instant
Video / Rakuten / other subscription service)?
Note: US figure is 0% for ‘programmes/series made in your country’, as this is captured in ‘programmes/series made
in the US’.
In 2016, the US accounted for the majority of Amazon Prime Video and Netflix subscribers
Data from Ampere Analysis show that in 2016, the US accounted for the majority of Amazon Prime Video
and Netflix subscribers, dwarfing subscriber numbers in any other country (see Figure 49). Nevertheless,
as the services expanded into new territories towards the end of 2015 and through 2016, subscriptions
grew significantly in international markets. For instance, Amazon subscribers more than doubled in the
UK and Japan in 2016, and the service increased its audience in Germany by 50% between 2015 and
2016.
Localisation is increasingly important to SVoD services as they expand into new territories and compete
with local operators. Amazon has more than twice as many subscribers as Netflix in Germany, perhaps
due to its early introduction of localised content. Amazon’s first German-language original You Are
Wanted began streaming on Amazon in March 2017. Netflix’s first German drama Dark is scheduled for
release in December 2017. Netflix and Amazon have also invested heavily in Japan, where they compete
with local services like dTV and BeeTV. At its launch in September 2015, Amazon Studios announced that
20 original shows would be produced for the Japanese market – half of the company’s international
original programming target – while Netflix announced its intention that 40% of its Japanese catalogue
would be local content.
While Netflix focuses on video services, Amazon Prime subscribers sign up not just to video content but
to other services such as music, e-books and free one-day delivery. However, along with Amazon’s moves
93to promote Prime more broadly in the UK (through advertising and specific Prime-only deals), the rise in
subscribers to Amazon video services may be a result of Amazon’s investment in The Grand Tour, a series
starring former members of the popular BBC production Top Gear. Although exact figures are unknown,
series one of The Grand Tour, which debuted in November 2016, was estimated to have cost between
$160m and $250m (£118m to £185m) to produce.
In 2015, the year in which Amazon announced its deal with the Grand Tour line-up, Amazon’s global
content spend increased by 55% year on year in nominal terms. Netflix’s content spend has also been
increasing YoY, by 9% in nominal terms between 2012 and 2013, and by 25% between 2015 and 2016.
Although content spend as a proportion of revenue has fallen since 2012, it still accounted for 59% of
Netflix’s revenue in 2016, and 101% of Amazon’s TV services.117
Figure 52 Netflix and Amazon global content spend, revenue, and subscribers: 2012-2016
Source: Ampere Analysis
Note: Ofcom has used an exchange rate of $1.35 to the GBP.
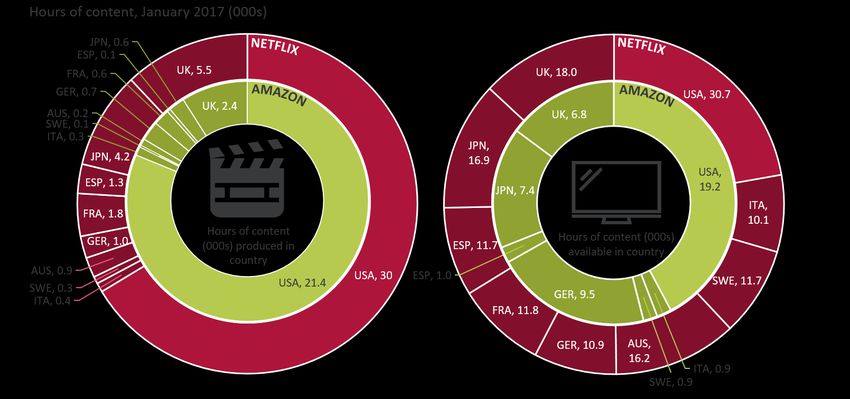
The majority of content in Amazon and Netflix’s catalogues was produced in the US
In January 2017, US productions dominated the catalogues of both Netflix and Amazon Prime Video. On
Amazon, US productions made up 81% of all video hours across our comparator countries; the Netflix
figure was 66%. UK productions came ranked second on both platforms, making up almost a fifth of
productions on Netflix and just over a tenth on Amazon. The fact that English language content is likely to
appeal to US audiences may be a factor in the high representation of UK productions.
The UK also has the second largest catalogue on Netflix (by hours of content available); unsurprising, as it
has the second largest market by subscribers among our comparator countries (Figure 49). On Amazon
Prime Video, however, subscribers in Germany can access a larger body of content – the relatively high
117
Figures derived from Ampere Analysis data.
94number of hours available may be another reason for Amazon’s success in Germany. Japan has the third
largest catalogue among our comparator countries on both platforms, in line with subscriber numbers
and investment, as outlined above.
Despite having the second largest content catalogue on Amazon Prime Video (about 9,500 hours of
content), German productions did not feature heavily on the platform (about 700 hours) in January 2017.
Ampere Analysis data from July 2017 suggest that Netflix and Amazon’s catalogues include only 1% to
10% of local content, depending on the market (with the exception of the US).118
Figure 53 Netflix and Amazon - hours of content, by country of production and distribution: January
2017
Source: Ampere Analysis
Note: Amazon refers to Amazon Prime Video, excluding Amazon Prime Video Direct. Country of production refers to
the country of origin, where a film was either produced or commissioned. Hours of content available in each country
includes duplication between the countries. Hours of available content are not available for France and Australia.
Country of origin data represents a subset of the full array of content available on Netflix and Amazon – as this
covers the 9 markets in the chart
5.2 The TV and audio-visual industry
5.2.1 Revenues
Global TV revenues reached £366 billion in 2016
Global TV revenue in 2016 reached £366bn, with pay-TV revenue accounting for more than half of this
(£200bn). Global net advertising revenue (NAR) was £138bn, while public funding from TV licence fees
was £29bn; this has changed little in nominal terms over the past four years.
118
Ampere Analysis, SVoD Content Strategies: The Drive for Originality (Thinking Local, Going Global).
95Figure 54 Global TV industry revenues (£bn), by source: 2012-2016
Subscription revenue Public funding Advertising revenue
361 366
313 310 320
137 138
126 122 126
29 29
30 28 28
195 200
157 160 166
2012 2013 2014 2015 2016
Source: IHS Markit.
Note: TV revenues are based on reported IHS market modelled data for c. 85% of global revenues and IHS market
estimates for the remainder. All revenue figures are expressed in nominal terms. All figures have been rounded to the
nearest whole number.
US TV revenue per head was more than double the next largest market
In 2016, the US had the highest TV revenues (£132bn), and the highest revenue per capita (£407). The US
was far ahead of the next largest markets, Germany (£21bn; £256 per capita) and the UK (£14bn; £218
per capita). Beyond these markets, revenues from the Swedish TV market reached £2bn in 2016, and the
Swedish TV market had the next largest per-capita revenue at £185. Penetration of pay-TV in Sweden is
one of the highest among the comparator countries, at 89% (Figure 69).
The television market in China generated £28bn in 2016, although this represents just £20 per head. In
recent years there has been significant growth in pay-TV (Figure 69) and in IPTV platforms (see Figure 68)
in China.
Figure 55 Total TV industry revenues among comparator countries (£bn): 2011-2016
237 246 261 266 275 TOTAL
USA
128 132
126
121
116
112
Europe
58 60
56 55 56 59
BRIC &
44 46 49
Nigeria
35 38
29 Asia
29 30 31 32 33 34 Pacific
2011 2012 2013 2014 2015 2016
96Source: IHS Markit
Notes: Revenues include advertising, subscriptions and sources of public funding only, and does not include OTT
services. BRIC is Brazil, Russia, India and China. Europe includes UK, France, Germany, Italy, Spain, Sweden,
Netherlands and Poland. Asia Pacific includes Japan, South Korea and Australia. All revenue figures are expressed in
nominal terms. All figures have been rounded to the nearest whole number.
Figure 56 TV revenues per capita, by revenue source (£): 2016
407
256
218
185 179
163 156
140 136
105
66 54 49
20 17 6 3
USA GER UK SWE JPN AUS NED KOR FRA ITA ESP POL BRA CHN RUS IND NGA
YoY
+2 +1 +2 +1 +2 -3 +4 +5 0 -1 +1 +2 +4 +7 +10 +13 +27
change (%)
Source: IHS Markit
Notes: Revenues include advertising, subscriptions and sources of public funding only. All figures are expressed in
nominal terms. All figures have been rounded to the nearest whole number.
Pay TV remains the largest source of TV revenue across comparators
For the UK and the majority of European comparators, subscription revenues remain the largest source of
TV revenue. However, in Italy and Spain, advertising accounted for a larger share of revenue (Italy 43%,
Spain 59%) than subscriptions. Although subscription revenues remain strong across the comparators,
pay-TV revenue’s share of the Spanish TV market has declined, despite an increase in the proportion of
pay-TV households (see Figure 69).
Pay-TV subscription revenue made up a large proportion of total revenue in the BRIC and Asian markets.
In India, where take-up of pay TV is high (92%), it accounted for 63% of total TV revenue. However, pay-
TV ARPU was only £31 in India, and alongside Russia (£22) and China (£52), it is one of the lowest among
the comparator countries. In Nigeria pay-TV take-up is only 33% (see figure x.xx), although a large
proportion of total TV revenue is from pay-TV subscriptions (77%).
Germany had the largest absolute (£9.2bn) and proportion (42%) of revenue generated from public
funding of television services. Japan and the UK received the second and third largest public funding
revenue, among the comparator countries.
97Figure 57 TV revenues among selected comparator countries (£bn): 2011 and 2016
Subscriptions Public Funding Advertising
12.5
51
5.4 10.0
43 - 4.9 9.4
9.2 4.6
9.2 4.7 3.5
8.9 4.3
81
- 15.6 3.7 3.8 4.7 2.8
2.9 2.9
68 2.1 3.4
3.3 2.2 2.2 1.8
2.7
8.0 8.0 1.5
6.4 6.2 5.4 5.9 5.4 4.9
1.4 1.2 2.2 2.1 1.8
4.6 3.8 4.6 1.8
2.7 3.2 2.5 3.0 2.5 2.3 1.3 1.4 1.3 1.0
2011 2016 2011 2016 2011 2016 2011 2016 2011 2016 2011 2016 2011 2016 2011 2016 2011 2016 2011 2016 2011 2016 2011 2016
USA CHN GER JPN UK BRA FRA IND KOR ITA AUS ESP
Source: IHS Markit
Note: The US was the largest market by a considerable margin and is accommodated here using a different scale
from the other comparator countries. All revenue figures are expressed in nominal terms.
TV revenue per head in the UK was £218 in 2016, half that of the US
In 2016, TV revenue per capita in the UK was £218, the third highest of our comparator countries after
the US (£407) and Germany (£256). The UK had the fourth highest pay-TV revenues per head, at £90 per
person per year, not far behind Sweden and South Korea, where pay-TV revenues per capita was £92 and
£91 respectively. The US had the highest pay-TV revenues per head, at £249, with little change in nominal
terms year on year. UK public funding revenue (via the licence fee) was £58 per person, the second
highest of our comparator countries, but less than Germany (£112) where payment of a licence fee is
compulsory for households regardless of whether they have a TV or radio.
Compared to the majority of comparator countries, Australia and Japan had a larger proportion of TV
revenue generated from advertising. They were also the second and third largest markets for TV
advertising revenue per capita; £86 in Australia and £79 in Japan.
Figure 58 Highest TV per-capita revenue countries, by revenue source: 2016
Subscription revenues Public funding Advertising revenues
1. US Germany US
2. Sweden UK Australia
3. South Korea Italy Japan
Source: IHS Markit
Notes: Revenues include advertising, subscriptions and sources of public funding only.
TV revenues per head for the BRIC countries and Nigeria remained the lowest among the comparator
countries in 2016.
98In France, there was a decline in the number of pay-TV subscribers, but the decline in subscription
revenues in nominal terms was offset by growth in advertising revenue, as former pay-TV subscribers
chose to supplement their free-to-air viewing with online video or other subscription services (Figure 50).
Figure 59 TV revenue per capita, by revenue source (£): 2016
407
249 256
218 Subscription
78 Public funding
185 179
163 156
90 Advertising
0.3 140 136
92 63
58 105
112 82 35
58 37 19 91 20
158 43 66
41 54 49
28 45 22
79 86 7 5 34 26 20 17
66 70 52 59 6
46 42 39 39 11 3
18 23 9 11 2.2
USA GER UK SWE JPN AUS NED KOR FRA ITA ESP POL BRA CHN RUS IND NGA
Source: IHS Markit
Notes: Revenue includes advertising, subscriptions and sources of public funding only; figures inside the bars
represent industry revenue per capita by source (£GBP). All figures are expressed in nominal terms. All figures have
been rounded to the nearest whole number.
Pay-TV revenue per pay-TV household was highest in the US in 2016 as Australia and Spain noted their
largest losses in nominal terms since 2011
The UK had the third-highest pay-TV average annual revenue per pay-TV household among our
comparator countries in 2016, behind the US and Australia. In most comparator countries pay-TV revenue
per pay-TV household increased in nominal terms between 2011 and 2016, although there were
decreases in Australia, the UK, Italy and Spain.
Despite the growing number of pay-TV households in Spain, subscription revenue (in nominal terms) has
been falling since 2011. Growth in subscriber numbers could be due to the increasing take-up of triple-
play and quad-pay offers which bundle television services with fixed telephony, broadband and mobile
services; however, these service are often ‘pay-TV-lite’ and do not drive large pay-TV revenues.
99Figure 60 Pay-TV revenue per pay-TV household, by country (£): 2016
831
395 375
289 287 281 262
220 206 194 185 176
113 90
52 31 22
USA AUS UK GER BRA ITA KOR SWE JPN FRA NED ESP POL NGA CHN IND RUS
Change since
2011 (%) 22 -27 -1 37 35 -1 35 18 17 7 12 -38 9 58 40 47 64
Source: IHS Markit
Notes: All figures are expressed in nominal terms. All figures have been rounded to the nearest whole number.
Public funding via a licence fee is an important element of TV finance in seven of our comparator
countries
At £145.50 per year, the cost of the UK licence fee was the third highest in 2016 among the comparator
countries which had a licence fee. The UK television licence fee rose to £147 on 1 April 2017, and will
continue to rise in line with inflation over the next five years.
In Germany, payment of licence fees is compulsory for all households regardless of whether they own a
TV or radio, including businesses. Public funding revenue in Germany is the largest among the EU
comparator countries and funds public broadcasters such as ZDF and regional broadcasters on the ARD
network. Sweden had the highest licence fee among the comparator countries; it uses it to fund TV and
radio channels as well as TV and radio content online. The fee is collected from all households with a TV
set (or personal computers connected to the internet). Italy had the second lowest licence fee among the
European comparators at £81.98. The licence fee was lowered by £11 in 2015, and incorporated into
electricity billing.
The TV licence fee in Japan has fallen in nominal terms since 2011, to £95.20 per year (it can be cheaper
for households if it is paid on a contractual basis, with discounts for six-monthly and annual payments). In
South Korea, the licence fee is the lowest among the comparator countries, and has remained the same
since 1981. It is collected by the Korea Electric Power Corporation, and paid for within electricity billing.
100Figure 61 Annual cost of a TV licence fee (£): 2016
191.76
172.16
145.50
112.31
95.20
81.98
46.03
19.15
SWE GER UK FRA JPN ITA POL KOR
change since
7 -3 0 11 -6 - 10 30 -
2011 (%)
Source: IHS Markit
Note: Chart excludes countries where there is no licence fee: the USA, Australia, Spain, Netherlands, Brazil, Russia,
India, China, and Nigeria. Singapore abolished TV licence fees in 2011. All figures are expressed in nominal terms.
UK broadcaster spend per head equalled the US, and was higher than the US on original content
The UK and the US had the highest broadcaster spend per capita on content, at £123, but broadcaster
spend on original content was slightly higher in the UK, at £53 compared to £50 in the US. Both were far
ahead of the other comparator countries for which data are available; the next highest spend was in
France, at £85 per capita.
Original content spend made up close to half of broadcaster spend on content across the comparator
countries. In Japan it was just under 79% of all broadcaster spend. In the US, broadcaster spend on
content and original content was greater than all other markets (£40bn for total and £16bn on original).
UK broadcaster spend on content (£8bn) and first-run original content (£3.5bn) was the highest among all
European comparator countries. The public service broadcaster (PSB) channels in the UK spent a total of
£2.1bn on first-run UK-originated content in 2016, with just under 50% of this coming from the BBC119.
In India, broadcaster spend on content increased in nominal terms from £1bn in 2012 to just over £2bn in
2016, and original content spend increased from £240m in 2012 to £730m in 2016. However, per-capita
spend was the lowest across all comparators.
119
PSB annual report 2017 (figure does not include spend on sports). Figure 16 PSB first-run UK-originated
programme spend, by genre. (https://www.ofcom.org.uk/__data/assets/pdf_file/0019/103924/psb-annual-report-
2017.pdf)
101Figure 62 Total broadcaster spend on content, among comparators (£bn): 2012-2016
Top Three
522 632 683 885 1168 TOTAL
£16.3bn
USA is on new original
39.7 £39.7bn content
36.5 37.8 USA
31.9 33.3
25.7 27.1
23.1 23.4 24.3 Europe
£3.5bn
UK is on new original
£8bn content
11.1 10.7 10.7 10.8 11.0 Asia
Pacific
2.6 3.1 3.5 3.9
2.3 £5.9bn
BRIC JAPAN
is on new original
£7.5bn
content
2012 2013 2014 2015 2016
Source: IHS Markit
Notes: All figures are expressed in nominal terms. BRIC is Brazil and India. Europe includes UK, France, Germany,
Italy, Spain, Sweden and Netherlands. Asia Pacific includes Japan, South Korea and Australia. Data not available for:
China, Nigeria, Poland and Russia. Taken from IHS Channels and Programming Intelligence. Originated programming
spend numbers do not include any spending on sports programming.
Figure 63 Total broadcaster per-capita spend on content (£): 2016
All Content Original Content
123 123
85 83
76
71
66
60
53 50 47
39 40 42 39
34
30 27 29
22
18
13
9 4 2 1
UK USA FRA AUS GER SWE ITA JPN ESP NED KOR BRA IND
Source: IHS Markit
Notes: All figures are expressed in nominal terms. Taken from IHS Channels and Programming Intelligence.
Originated programming spend numbers, do not include any spending on sports programming. All figures have been
rounded to the nearest whole number.
US online revenues were larger than all the comparator countries combined in 2016
The US had the largest total revenue from online TV and video among all the comparator countries at
£14bn in 2016, making up 10% of total TV revenue in the US.
On a per-capita basis, the US (£43), Sweden (£35), and the UK (£30) had the highest revenues from online
TV and video services in 2016. This reflects the maturity of their online markets, with high penetration of
SVoD services. Subscriptions to video streaming and on-demand services were the primary driver of
102growth in online revenue, and accounted for 56% of online TV and video revenues in the US in 2016, 54%
in Sweden and 40% in the UK.
In Italy and India, where take-up of subscriptions to streaming and on-demand services was low (see
Figure 49) and the use of free online video platforms was high (see Italy Figure 47), ad-supported video
revenue contributed the majority of online TV and video revenue in 2016. In these markets a significant
proportion of online TV and video revenue was advertising revenue from YouTube. In Italy, 47% (£174m)
and in India, 69% (£121m) of online revenue was generated from ad-supported YouTube content.
Figure 64 Total
Revenue (£m) online TV and video revenue for selected countries (£m): 2016
13,919
4,729
1,969
1,002 930 724 589 559 373 342 313 313 236 235 175 131
USA CHN UK JPN GER FRA BRA AUS ITA SWE KOR NED ESP RUS IND POL
Source: IHS Markit
Note: The US was the largest market by a considerable margin and is accommodated here using a different
scale from the other comparator countries. ‘Online TV and video revenue’ refers to advertising revenue and
subscription revenue as well as retail and rental on-demand revenue derived from online services delivering TV and
video content. Typically, it includes services such as catch-up TV services, Netflix, Xbox Video, Hulu and Hulu Plus,
iTunes and YouTube, among others. YouTube revenues are included within ad-supported video revenue. All figures
have been rounded to the nearest whole number.
103Figure 65 Online TV and video per-capita revenue for selected countries (£): 2016
43
35
30
23
18
11 11
8
6 6 5
3 3 3 2
0.13
USA SWE UK AUS NED GER FRA JPN ITA KOR ESP CHN POL BRA RUS IND
Source: IHS Markit
Note: ‘Online TV and video revenue’ refers to advertising revenue and subscription revenue as well as retail and
rental on-demand revenue derived from online services delivering TV and video content. Typically, it includes services
such as catch-up TV services, Netflix, Xbox Video, Hulu and Hulu Plus, iTunes and YouTube, among others. YouTube
revenues are included within ad-supported video revenue. All figures have been rounded to the nearest whole
number.
5.3 The TV and audio-visual consumer
5.3.1 Digital TV take-up
The UK was one of five comparator countries in which all TV services were digital at the end of 2016
The UK, Italy, Spain, Australia and Japan were the only comparator countries where all TV services were
digital at the end of 2016. The majority of countries have completed digital switchover120 but some still
have analogue cable services. Among these are the US, France, Germany, Netherlands, Sweden, Poland
and South Korea (Figure 67).
Countries which have yet to complete digital switchover are Brazil (scheduled for 2018), India (2018),
Russia (2019), China (2020) and Nigeria (2020).
Between 2011 and 2016 the greatest increases in digital television on main television sets were in Nigeria
(+62pp), India (+46pp) and Russia (+38pp). Sweden had the lowest DTV take-up among the comparator
countries in 2016, as analogue cable remains a popular option within the market (Figure 67)
120
Digital switchover is the name given to the process by which analogue terrestrial television is replaced with
digital terrestrial television
104Figure 66 Take-up of digital television on main sets: end 2016
Proportion of TV households (%)
100 100 100 100 100 98 98
92 91 88
84
80 77 76 74 73
65
UK ITA ESP AUS JPN FRA USA CHN NED POL IND KOR NGA GER RUS BRA SWE
Change since
2011 (pp)
5 5 1 8 3 7 0 26 14 19 46 22 62 16 38 18 -2
Source: IHS Markit
Note: All figures have been rounded to the nearest whole percentage.
Take-up of IPTV on main TV sets was highest in France and South Korea at the end of 2016 and was
growing fastest in China
Internet protocol television (IPTV)121 continued to compete with other digital platform technologies,
encouraged by growth of triple-play bundled services in countries with high-bandwidth broadband
infrastructure. Well-established IPTV markets include France (40%), South Korea (32%) and the
Netherlands (30%). There has been a surge in take-up of IPTV since 2015 in China (up 10pp), Russia (up
3pp) and Australia (up 3pp).
There are few IPTV-only households in the UK, due to well-established satellite and cable pay-TV
platforms alongside free-to-air digital terrestrial TV. The large majority of the 7% of UK households that
received IPTV television channels at the end of 2016 subscribed to triple-play services from either BT or
TalkTalk. Both of these providers offer hybrid digital terrestrial and IPTV services, with free-to-air
channels and a small number of subscription channels provided over the digital terrestrial platform and
additional subscription channels and on demand services over IPTV.
China had the third highest proportion of IPTV households among the comparator countries (21%; 87
million IPTV households), growing from just 11% of households in 2015. This rapid growth is likely to have
been driven by initiatives to achieve convergence across telecoms, radio, television and internet services
over a single broadband connection122123.
The availability of broadband and devices capable of using IPTV networks can affect the popularity of
IPTV. An underdeveloped internet infrastructure can be a major constraint for IPTV market growth in
121
Internet protocol television (IPTV) is the term used to describe the television platform that delivers
channels to viewers using internet protocol (IP) technology over a broadband connection.
122
Xinhua 2017, China to invest 1.2 trillion yuan in information infrastructure. (Accessed:
http://news.xinhuanet.com/english/2017-01/12/c_135977498.htm)
123
Elain Jing Zhao, The bumpy road towards network convergence in China. Global Media and China 2017, Vol. 2(1)
28-42 (Accessed: http://journals.sagepub.com/doi/pdf/10.1177/2059436416688698)
105developing countries. Speeds can be less of a limiting factor than the quality of an IPTV stream, as speeds
of 2-5 Mbit/s are generally capable of streaming standard and high-definition content.
Despite high take-up of over-the-top services in the US (84%) (Figure 49), suggesting a mature online
viewing market, the proportion of homes with IPTV was among the lowest of the comparator countries
(6%). It was also the only country in which there was a decline in the number of households with IPTV in
2016 (down by 1.5 million), as low subscription renewal affected IPTV providers. The proportion of digital
terrestrial TV (DTT) households in the US was up by three percentage points since 2015, and grew at a
faster rate than digital cable services.
At 37%, DTT take-up remains strong in the UK, although digital satellite leads the way at 40% of main TV
sets. DTT take-up is also well established in Italy, Spain and Australia. With a 56% share of main sets,
digital cable is the most popular platform in Japan, but holds a strong presence in Netherlands (48%),
China (46%), India (42%) and the US (42%).
Figure 67 TV platform take-up, main set: end 2016
Proportion of TV homes (%)
2 3 1 1
7 6 9 8 7 11 IPTV
6 5 20 17 14 21
3 23
30 32 27
40 19
14 42 13 Analogue Terrestrial
37 17
31
44 5 4 14
69 61 23 27 Digital Terrestrial
8
27 16 49
9 20
41 15 7 Analogue Satellite
24 65
2
40 46 Digital Satellite
24 35 20
56 12
48 50
28 42 23 42 46 Analogue Cable
23
30
19 7 22 23
15 2 15 12 Digital Cable
10 8 8
6
UK FRA GER ITA USA JPN AUS ESP NED SWE POL KOR BRA RUS IND CHN NGA
Source: IHS Markit/ BARB Establishment Survey
Note: Digital satellite includes free-to-air as well as paid-for services. Data include main TV sets only and are based
on a proportion of TV homes. UK data are sourced from the BARB Establishment Survey/TRP Research, for Q4 2016.
Based on main TV set in home (nominated by respondents) and from homes with a BARB working TV set. For TV sets
with multiple platforms in the UK, a hierarchy-based approach has been applied to determine the platform: DSAT
beats DCAB, DCAB beats IPTV, and IPTV beats Freeview. Digital Terrestrial = Freeview, IPTV= BT or TalkTalk or
YouView or Plusnet, Other = includes direct access to the internet such as via computer or games console or dongles
such as Amazon Firestick and Google Chromecast. This accounts for 1% not shown in the chart above. For the
purposes of this report, IPTV in the UK is digital terrestrial TV through any of BT TV/ TalkTalk/ YouView (but may
have Freeview-integrated TV) and not DSAT /DCAB/ other platforms. All figures have been rounded to the nearest
whole percentage.
106Figure 68 IPTV platform take-up: end 2016
Proportion of TV households (%)
40
32 30
21 20
17
11 9 8 7 7 6
3 2 1 0
FRA KOR NED CHN ESP SWE RUS USA JPN UK AUS GER POL ITA BRA IND
YoY change (pp) 0 0 +2 +10 +2 0 +3 -2 0 0 +3 0 0 +1 +1 0
Source: IHS Markit/ BARB Establishment Survey
Note: For the purposes of this report, IPTV in the UK is digital terrestrial TV through any of BT TV/ TalkTalk/ YouView
(but may have Freeview-integrated TV) and not DSAT /DCAB/ other platforms. All figures have been rounded to the
nearest whole percentage.
Pay-TV take-up in the UK was below the comparator countries’ average
Take-up of pay-TV in the UK was 58% at the end of 2016, three percentage points higher than in 2011, but
still below the average across the comparator countries (65%).
The UK pay-TV market has seen the growth of hybrid platform offerings, such as YouView, offered by BT
and TalkTalk, which provide lower-cost basic pay-TV services than those available via established satellite
and cable platforms, and focus on providing access to on-demand services, along with a DVR. Sky’s Now
TV is another lower-cost option, providing Sky’s own established channels to customers through a
packaged service and other video-on-demand content. Amazon also launched Amazon Channels in May
2017, a pay-TV-like platform which offers individual subscriptions to more than 40 channels and live
programming.
Among our non-European comparator countries, the US was the only one in which pay-TV take-up fell;
down from 87% in 2011 to 81% in 2016. Over this period there was a loss of 3.4 million pay-TV
households, probably affected by high pay-TV pricing in the US, and by consumers ‘cord cutting’ and
taking on-demand and streaming services124 as a cheaper alternative (see Figure 50).
Pay-TV take-up as a proportion of TV households continued to increase across the BRIC countries and
Nigeria. Nigeria had the largest increase in pay-TV households between 2011 and 2016 (up 26pp)
followed by Russia (up 18pp).
124
https://www.ofcom.org.uk/__data/assets/pdf_file/0019/107470/ICMR_2017.pdf
107Figure 69 Take-up of pay TV: end-2016
Proportion of TV households (%)
98 96
92 89 86
81
75 73 71 69
58 Average 65%
56
39
33 33 32 30
NED KOR IND SWE POL USA JPN CHN RUS FRA UK GER AUS ITA NGA ESP BRA
Change since
2011 (pp)
0 +7 +8 +2 -1 -6 +6 +15 +18 +5 +3 -2 +26 +11 -3 +6 +8
Source: IHS Markit
Note: All figures have been rounded to the nearest whole percentage.
High definition TV availability is growing in most comparator countries
High definition TV (HDTV) take-up has reached saturation in France, up from 53% in 2011 to 100% in
2016. HDTV growth in other European comparator countries has been much slower. In terms of
technology, cable HD services led the way in the Netherlands, the US, Japan and China. HD over IPTV is
now an established service in France, Sweden and South Korea. Satellite HD services are common in
Germany, Poland and Russia, and are available on the digital terrestrial platform in most comparator
countries, including the UK.
More than two-thirds of UK television homes received an HD service in 2016 (69%, or 18.9 million
households), putting the UK in sixth position among our 17 comparator countries.
Figure 70 Take-up of HD services, all sets, by platform: end 2016
Proportion of TV Households with HD services (%)
5
6
38
16
3
56 8 17
54 22 5
2
2
11 10 1
11 5
38 35 9
13 43 13 5
27 7
6
14 10 3
1
2 8 43 40 23 8
36
29 29 5 29 8
24 24
No data
22 19 19 2
5 14
10 7 10
4
0
FRA JPN AUS USA KOR UK POL ESP CHN GER ITA SWE NED BRA RUS IND NGA
Satellite Cable IPTV DTT
Source: IHS Markit
Note: figures are for HD-enabled homes (those which have a HD capable television set and receive an HD signal). All
figures have been rounded to the nearest whole percentage.
108Ultra-HD TV is slowly becoming established
Although there is currently limited availability of ultra-HD (UHD) television channels around the world,
UHD TV sets are gaining a foothold. Across the majority of comparator countries, take-up of UHD TV
(otherwise known as 4K) sets is growing significantly year on year. In the UK there were just under two
million households with UHD TV sets in 2016, comprising 7% of UK TV households.
US households had the highest take-up of UHD sets among the comparator countries. Substantial growth
occurred in 2016, as the number of households with a UHD TV set increased from 3.9 million to 10.5
million (representing 9% of TV households at the end of the year). Increased take-up across the
comparator countries is probably due to the greater affordability and commercial production of UHD TVs.
Figure 71 Household ownership of ultra-HD TV sets: end 2016
Percentage of TV homes with a UHD TV (%)
9
8 7 7
6
5 5 5
4 4 4 4
3 3
No data
1
0.2
USA CHN FRA UK SWE AUS GER NED ITA ESP POL KOR JPN RUS BRA IND NIG
YoY change
+6 +4 +5 +4 +4 +3 +3 +3 3 +3 +2 +2 +2 +1 +1 0
(pp)
Source: IHS Markit
Note: All figures have been rounded to the nearest whole percentage.
5.3.2 Broadcast television viewing
Average minutes of live broadcast television viewing per person per day fell in the majority of
comparator countries
Average live TV125 viewing across the comparator countries was 3 hours 28 minutes in 2016, two minutes
less than in 2015. Australia, the Netherlands, Sweden and China had the steepest decline in live viewing,
compared to other markets. The highest growth rates were in India and Brazil, up 7% and 9% respectively.
In the UK there was a year-on-year decline in viewing of live broadcast TV (down 3%), with consumers
watching an average of 3 hours 3 minutes of TV each day in 2016. Although still well below live viewing
figures, time-shifted126 viewing in the UK (i.e. the viewing of television programmes after they have been
broadcast, either by watching a recording or using a broadcaster’s on-demand service) was significantly
higher than in the other countries for which data were available, accounting for 14% of total daily
viewing.
125
Watching programmes broadcast at the scheduled time, not only live events such as football matches.
126
Includes any playback within a number of days after live broadcast, as well as pausing or rewinding live TV. Not all
comparator countries measure or report time-shifted viewing, so please see the methodology section for further
information.
109Time-shifted viewing in the US accounted for 11% of total viewing, the second-highest among our
comparator countries.
What is not captured below is viewing to non-broadcast services such as SVoD127, online video (long form
and short form video) and other types of non-broadcast viewing activities on devices like smartphones, all
of which are contributing to the overall decline in traditional TV viewing in many countries.
In the US (where penetration of paid-for on-demand and streaming services was 81% of TV homes)
average viewing of scheduled content128 was down by 1% year on year (4 minutes), primarily due to a
decline in live viewing. Italy and Spain also experienced declines in live viewing in 2016 (down by 3% and
2% respectively). In these markets, online video platforms such as YouTube and social media are used by
more than half of respondents (Figure 47). Despite the growing use of online platforms across the market,
Japan showed no decline in live viewing, even though almost as many respondents in Japan claimed to
watch online video as watched live content (41% of viewing on video sharing sites such as NicoNico
compared to 52% of viewing live on free-to-access channels).
Figure 72 Average minutes
Average minutes of live broadcast TV viewing per person per day: 2016
per day
Average
208 mins
262 262 254 248 244 240 230 222 213 193 183 176 170
146 144 140
proportional POL JPN BRA RUS ITA USA ESP GER FRA KOR UK AUS NED CHN IND SWE
change in minutes
of live viewing per -1 0 +9 +1 -3 -2 -2 0 -2 0 -3 -4 -4 -6 +7 -4
person per day,
2015 – 2016 (%)
Source: Médiamétrie, Eurodata TV Worldwide – One Television Year in the World 2017.
Note: Viewing in France relates to France National. Japan Kanto region, considered to be the main TV market in
Japan (national data are not available). Viewing in Australia relates to Australia Regional which is calculated on the
regions Queensland, Northern NSW, Southern NSW, Victoria & Tasmania and Regional Western Area ( the definition
of Australia regional changed in 2014 to include Regional Western Australia). All figures have been rounded to the
nearest whole number.
127
A subscription service (usually paid monthly) that offers video-on-demand content (SVoD) usually delivered via
the internet. Services may offer live streaming to a selection of channels/content as well as VoD content.
128
Scheduled TV programming which is available to all viewers simultaneously (such as those listed in electronic
programme guides (EPG)). It includes time-shifted viewing of these programmes up to a specified number of days.
110You can also read