A Newly Discovered Relation between the Critical Resolved Shear Stress and the Fatigue Endurance Limit for Metallic Materials
←
→
Page content transcription
If your browser does not render page correctly, please read the page content below
metals
Article
A Newly Discovered Relation between the Critical
Resolved Shear Stress and the Fatigue Endurance
Limit for Metallic Materials
Marijo Mlikota *         and Siegfried Schmauder
 Institute for Materials Testing, Materials Science and Strength of Materials (IMWF), University of Stuttgart,
 Pfaffenwaldring 32, 70569 Stuttgart, Germany; siegfried.schmauder@imwf.uni-stuttgart.de
 * Correspondence: marijo.mlikota@imwf.uni-stuttgart.de; Tel.: +49-711-685-67674

 Received: 24 April 2020; Accepted: 10 June 2020; Published: 17 June 2020

 Abstract: The paper introduces a valuable new description of fatigue strength in relation to material
 properties and thus a new perspective on the overall understanding of the fatigue process. Namely,
 a relation between the endurance limits and the accompanying values of the critical resolved shear
 stress (CRSS) for various metallic materials has been discovered by means of a multiscale approach
 for fatigue simulation. Based on the uniqueness of the relation, there is a strong indication that it is
 feasible to relate the endurance limit to the CRSS and not to the ultimate strength, as often done in
 the past.

 Keywords: multiscale simulation; fatigue; metals; CRSS; endurance limit

1. Introduction
      A scientific approach to the question of fatigue strength would be to consider the effects of crystal
structure on fatigue mechanisms [1–4]. Researchers from the field of fatigue are aware of the ratio
between endurance limit and ultimate tensile strength, Se /Rm (see Figure 1b). This ratio is also known as
the fatigue ratio and is typically higher for ferrous materials (including steels—see red line in Figure 1b),
which are of the body-centered cubic (BCC) type, than for non-ferrous materials (see, e.g., blue line in
Figure 1b), which possess a face-centered cubic (FCC) crystallographic structure. Furthermore, ferrous
materials generally show a pronounced “knee” in the strength-life (S-N, or Wöhler) diagram at about
106 cycles, after which the fatigue life curve flattens (see an example in Figure 2). The fatigue strength
at this point is known as the endurance limit (Se ). Interestingly, non-ferrous materials exhibit a gradual
flattening between 107 –108 cycles. Although some researchers have explained these effects in terms of
strain ageing and dislocation locking (see [4]), there is also evidence that the involved crystal structure
plays an important role [1,2].
      However, the study from [5] showed that the crystallographic structure is not the predominant
factor that determines the shape and position of the fatigue life curves in the S-N diagram, but it
is rather the parameter critical resolved shear stress (CRSS). Mlikota and Schmauder [5] reported
the existence of a pronounced transition from finite life (slope in the typical S-N curve; see Figure 2)
to the infinite life region (below the endurance limit) as well as high Se values even in some FCC
metals with relatively high CRSS magnitudes. Namely, the higher the CRSS of a certain material,
the more pronounced is the transition between the finite and the infinite life region, the higher is the
curve position in the diagram and accordingly the higher is its Se magnitude (see [5] for more details).
The present study is the follow-up study of the one published in [5] and brings new insights to the
simulation-based understanding of CRSS for the fatigue performance of metallic materials.

Metals 2020, 10, 803; doi:10.3390/met10060803                                        www.mdpi.com/journal/metals
Metals 2020, 10, 803 2 of 11
Metals 2020,
Metals 2020, 10,
10, xx FOR
FOR PEER
PEER REVIEW
REVIEW 22 of 11
of 11
500
500 900
900
Initial data
Initial data[5]
[5] BCC metals
BCC metals [4]
[4]
Revised
Rev data **
ised data 800 FCC metals
FCC metals [4]
[4]
33 800
Steels [10]
Steels [10]
1141*
AISI1141*
400
400 RR == -1,
-1, KKt == 11 Light metals
Light metals [10]
[10]
t 700
700
++
(MPa)
(MPa)
1.1123 Experimental data
Experimental data [11–14]
[11–14]
SSee == 1.0331CRSS
1.0331CRSS1.1123
limitSSee(MPa)
limitSSee(MPa)
Simulationdata
Simulation data
AISI
(Se == 1.8625CRSS)
(S 1.8625CRSS)
e 600
600
44
99.9%*
300
300
Fe99.9%*
304
500
500
Endurancelimit
Endurance limit
AISI304
33
AISI
Fe 400
400
Endurance
Endurance
22
200
200 33
300
300 44
1141
AISI1141
99.9%
Fe99.9%
200
200 22
AISI
1050
33
AA1050
100
100
Fe
RR == 0, ≅ 2.45
0, KKt ≅ 2.45 100
100 RR == -1-1
AA
22 t
SSee == 0.5142CRSS
1.0477
0.5142CRSS1.0477 22 KKtt == 11
11 11
00 00
00 50
50 100
100 150
150 200
200 250
250 00 200
200 400
400 600
600 800 1000
800 1000 1200
1200 1400
1400
CRSS (MPa)
CRSS (MPa) Tensile strength
Tensile strengthRRm (MPa)
(MPa)
m
(a)
(a) (b)
(b)
Figure
Figure 1.
1.1. (a)Relation
(a) Relationbetween
Relation betweenendurance
between endurance limit
endurance limit (S
(See)))values
values (from [5] and updated with thethe new results
Figure (a) limit (S e values(from(from[5][5]and
and updated
updated with the
with new new results
results
for
for the
the Fe
Fe 99.9%
99.9% and
and for
for the
the steel
steel AISI
AISI 1141,
1141, marked
marked with
with diamonds
diamonds and
and
for the Fe 99.9% and for the steel AISI 1141, marked with diamonds and with *) of the investigated with
with *)
*) of
of the
the investigated
investigated
metals
metals
metals and
and
and their
their
their criticalresolved
critical
critical resolvedshear
resolved shearstress
shear stress(CRSS)
stress (CRSS) values
values [6–9].
values [6–9]. (b)
[6–9].(b) Relation
(b)Relation between
Relationbetween
between SSeeSand
and ultimate
ultimate
e and ultimate
tensile strength
tensilestrength
strength(R(R(R m ) values for various metals [4,10–14], including new simulation-based S values
See Svalues
tensile mm))values
values forfor various
various metals
metals [4,10–14],
[4,10–14],including
includingnew newsimulation-based
simulation-based e values
(diamonds) and
(diamonds) and those
those fromfrom [5][5] (circles).
(circles). Simulation-based SSee values values for the standard
standard loading
loading case case
(diamonds) and those from [5] (circles). Simulation-based
Simulation-based Se valuesforforthe the standard loading case
characterized
characterizedby by loading
byloading
loading ratioratio R = −1 and stress concentration factor K = 1 are obtained from the values
ratioRR= = −1−1
andand
stress concentration Kt = 1 are
factorfactor
t
characterized stress concentration Kt obtained from the values
= 1 are obtained from the
characteristic for
characteristic for RR == 00 and
and KKtt ≅≅ 2.45
2.45 by
by using
using an an approach
approach taking
taking into
into account
account mean mean stress
stress and/or
and/or
values characteristic for R = 0 and Kt 2.45 by using an approach taking into account mean stress
loading ratio
loading ratio [10] in
in combination
combination with with the notch
notch sensitivity approach
approach [15] [15] (see
(see Appendix
Appendix A A for
for more
more
and/or loading [10]
ratio [10] in combinationthe with thesensitivity
notch sensitivity approach [15] (see Appendix A for
details).
details).
more details).
165
165
(MPa)
amplitude SSaa(MPa)
160
160
SSe,e, exp. = 155
exp. = 155 MPa
MPa[13]
[13]
155
155
Stress amplitude
SSe,e, sim. = 152
sim. = 152 MPa
MPa
150
150
Stress
145
145
AISI 1141,
AISI 1141, RR == 00
Run-out -- crack
Run-out crack retardation
retardation
140
140
1E+05
1E+05 1E+06
1E+06 1E+07
1E+07
Number of
Number of cycles
cycles to
to failure
failure N
N
Figure 2. Comparison between simulated and experimental Se values for AISI 1141 steel [13]. For details
Figure 2.
Figure 2. Comparison
Comparison between
between simulated
simulated and
and experimental
experimental SSee values
values for
for AISI
AISI 1141
1141 steel
steel [13].
[13]. For
For
on the numerical determination of Se values, see [5,16,17].
details on the numerical determination of S values, see [5,16,17].
details on the numerical determination of Se values, see [5,16,17].
e
2. Methods and Materials
2. Methods
2. Methods andand Materials
Materials
2.1. Methods and Reference to Previous Work
2.1. Methods
2.1. Methods and
and Reference
Reference to
to Previous
Previous Work
Work
A study published in [5] by Mlikota and Schmauder dealt with the numerical estimation of
AA study
the fatiguestudy published in
life published
represented in [5]
[5]the
in by Mlikota
by Mlikota and
form ofand Schmauder
S-NSchmauder dealt with
dealt
curves of metals with the
withthe numerical
numerical
BCC and FCCestimation
estimation of the
of the
crystallographic
fatigue life
fatigue life represented
represented in the
in the form of S-N
form of S-N curves of metals with BCC and FCC crystallographic
structures and with different magnitudes of curves
CRSS. of
Anmetals
examplewithofBCC and FCC crystallographic
a simulation-based S-N curve is
structures and
and with
with different
different magnitudes
magnitudes ofof CRSS.
CRSS. An
An example
example ofof aa simulation-based
simulation-based S-N
S-N curve
curve is
shown in Figure 2 for BCC steel AISI 1141. Such fatigue life curves are obtained by determiningisthe
structuresMetals 2020, 10, 803 3 of 11
number of cycles
Metals 2020, forPEER
10, x FOR initiation
REVIEWof a short crack under the influence of microstructure (N ini ; Figure 3 of 113b)
and subsequent number of cycles for the growth of a long crack (Nprop ; Figure 3c), respectively. Final
shown
failure of ainspecimen
Figure 2 foror BCC steel AISIoccurs
a component 1141. Such
at thefatigue
number lifeofcurves
cyclesare
Nf obtained
= Nini + by determining
Nprop the
. Micro-models
number of cycles for initiation of a short crack under the influence of microstructure (Nini; Figure 3b)
containing microstructures of the materials are set up by using the finite element method (FEM) and
and subsequent number of cycles for the growth of a long crack (Nprop; Figure 3c), respectively. Final
are analyzed in combination with the Tanaka-Mura (TM) equation [18,19] in order to estimate the
failure of a specimen or a component occurs at the number of cycles Nf = Nini + Nprop. Micro-models
number of cycles required for crack initiation (see Figure 3b and especially [5] for more details). Long
containing microstructures of the materials are set up by using the finite element method (FEM) and
crack growth analysis is typically based on classical fracture mechanics.
are analyzed in combination with the Tanaka-Mura (TM) equation [18,19] in order to estimate the
A dislocation model forms the physical basis of the TM equation (Equation (1)), which is frequently
number of cycles required for crack initiation (see Figure 3b and especially [5] for more details). Long
used to determine
crack growth analysis whenis atypically
grain, subjected to an outer
based on classical cyclic
fracture loading, will develop a slip band and
mechanics.
subsequently a micro-crack. The number of cycles,
A dislocation model forms the physical basis of N g the TM for
, needed micro-crack
equation nucleation
(Equation within
(1)), which is a
single grain can
frequently used betoderived
determineas follows
when a[18,19]:
grain, subjected to an outer cyclic loading, will develop a slip
band and subsequently a micro-crack. The number of cycles, Ng, needed for micro-crack nucleation
Ng = as
within a single grain can be derived 8GWfollows ν)(∆τ − 2CRSS)2 πd,
c /(1 −[18,19]: (1)
One of the parameters of the TM Ngmodel
= 8GWc(Equation
/(1 − ν)(Δτ (1))
− 2CRSS)
is the2πd,
CRSS, which is a threshold value (1) of
the shear stress along the glide direction that a dislocation needs to surpass in order
One of the parameters of the TM model (Equation (1)) is the CRSS, which is a threshold value of to start moving.
According
the shearto the TM
stress along model, micro-cracks
the glide form
direction that along slip bands
a dislocation needs to (see Figurein3b),
surpass depending
order on grain
to start moving.
size (i.e., slip band length) d, the average shear stress range ∆τ on the slip band,
According to the TM model, micro-cracks form along slip bands (see Figure 3b), depending on grain the shear modulus
G, size
the crack initiation
(i.e., slip energy
band length) d, W
thec ,average
Poisson’s ratio
shear ν, and
stress theΔτ
range CRSS
on the[16,17,20–22].
slip band, theAshear
moremodulus
extended
andG,detailed
the crackdescription of theWimplementation
initiation energy c, Poisson’s ratio ν, ofand
the the
TMCRSSequation into FEM-based
[16,17,20–22]. modelling
A more extended andand
detailed of
simulation description of the implementation
the crack initiation process has been of the TM equation
reported into FEM-based
in publications modelling
of the authors of thisand
study
simulation of the crack
in [5,16,17,20,23–25] and initiation
by other process has been
researchers, too,reported in publications of the authors of this study
in [21,22,26,27].
in The
[5,16,17,20,23–25] and by other
multiscale approach researchers,
for fatigue too, in [21,22,26,27].
simulation, consisting of CRSS determination either from
The multiscale approach for fatigue simulation,
micro-pillar tests (MPT) or from molecular dynamics (MD) simulations consisting of CRSS determination
(both in Figure either
3a),from
crack
micro-pillar tests (MPT) or from molecular dynamics (MD) simulations
initiation simulations based on the TM equation (Figure 3b) and long crack growth simulations (both in Figure 3a), crack
initiation
based simulations
on fracture based principles
mechanics on the TM equation (Figure
(Figure 3c), 3b) and
has been long crack
previously growth simulations
reported based
in [8,16,24,25,28,29].
on fracture mechanics principles (Figure 3c), has been previously reported in [8,16,24,25,28,29]. The
The methodology forms the basis of the past [5] and present research work, which has been conducted
methodology forms the basis of the past [5] and present research work, which has been conducted
with the aim to further elucidate the relevance of the parameter CRSS for fatigue strength in general.
with the aim to further elucidate the relevance of the parameter CRSS for fatigue strength in general.
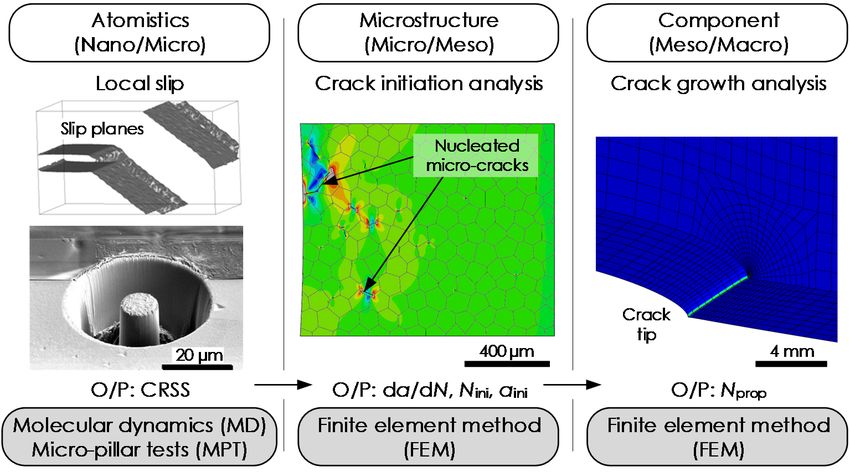
(a) (b) (c)
Figure
Figure 3. 3. Multiscaleapproach—coupling
Multiscale approach—coupling of of methodologies
methodologies at atthe
therelevant
relevantscales
scalesandandaccompanying
accompanying
outputs (O/P). (a) Determination of the parameter CRSS either from
outputs (O/P). (a) Determination of the parameter CRSS either from molecular dynamics molecular dynamics (MD)
(MD)
simulations or from micro-pillar tests (MPT). (b) Determination of crack growth
simulations or from micro-pillar tests (MPT). (b) Determination of crack growth rate (da/dN) rate (da/dN) and
and
number
number of of stress
stress cyclesfor
cycles forcrack
crackinitiation (Nini)) from
initiation(N from crack
crack initiation
initiationanalysis.
analysis.(c)(c)Determination
Determination of of
ini
number
number of of stress
stress cyclesfor
cycles forcrack
crackpropagation
propagation(N (Nprop))[5,8,23,30].
prop [5,8,23,30].Metals 2020, 10, 803 4 of 11
2.2. Materials
Table 1 contains metallic materials considered in the study from [5] and their mechanical properties,
namely, the Young’s modulus E, the shear modulus G, the Poisson’s ratio υ, the yield strength Rp0.2 ,
the ultimate strength Rm , their average grain size d, and eventually the CRSS values. The details on
boundary and loading conditions as well as on specimen geometry that were applied in the study can
be found in [5], too. It is suitable to indicate here that all the materials’ constitutive laws have been
defined as purely elastic, i.e., just by using the elastic material constants. In another study of Mlikota
and Schmauder [17] on aluminum alloy AlSi8Cu3, it has been shown that plasticity does influence the
fatigue performance of this alloy, however, not significantly.
Table 1. Mechanical properties of the considered metals.
E G Rp0.2 Rm d CRSS
Material υ
(GPa) (GPa) (MPa) (MPa) (µm) (MPa)
AISI 304 188 79.0 0.26 322 [31] 574 [31] 30 160 [9]
AISI 1141 200 78.125 0.28 564 [13] 875 [13] 60 117 [8]
Fe 99.9% 205 81.0 0.28 260 [32] 414 [33] 65 35 [7]
AA 1050 72 26.0 0.33 95 [34] 110 [34] 65 14 [6]
2.3. New Insights into Previous Work
As reported by several researchers, the CRSS may be up to 100 times larger in BCC steels than in
metals with FCC crystal structures [4]. However, after a detailed survey, it was observed that certain
FCC steels also exist which have an unusually high CRSS (e.g., austenitic stainless steel AISI 304 with a
160 MPa high CRSS, see Table 1). As already mentioned, BCC metals typically show a pronounced
transition from finite life to the endurance limit region, and on the other hand, certain FCC metals
with a low CRSS show relatively smoother transition between the two regions in the S-N diagram.
In addition to that, the results from [5] illustrate (see Table 2) the existence of definite endurance
limits in the considered BCC (AISI 1141 and Fe 99.9%) as well as FCC steels (AISI 304 and AA 1050).
Despite being an FCC material, the austenitic stainless steel AISI 304 shows an untypically high Se
value of 103 MPa (expressed in terms of nominal stress amplitude Sa for loading ratio R = 0 and stress
concentration factor Kt 2.45—see Table A1 for more details), which is higher than the Se value
estimated for the BCC steel AISI 1141 (76 MPa for CRSS = 117 MPa). The remaining two investigated
metals, the BCC-based pure iron (Fe 99.9%) and the FCC-based high purity aluminum alloy (AA)
1050 possess, according to the numerical study from [5], relatively low endurance limits, i.e., 22 and
8 MPa, respectively.
Table 2. Simulation-based endurance limits (Se ) from [5] of the investigated materials in comparison
with experimental values (Se values are expressed in terms of nominal stress amplitude Sa ). For details
on how to deduct Se values for R = −1 and Kt = 1 (axial loading), see Appendix A.
Se (MPa)/Sim. Se (MPa)/Sim. Se (MPa)/Exp.
Material Lattice CRSS (MPa)
R = 0, Kt 2.45 R = −1, Kt = 1 R = −1, Kt = 1
AISI 304 FCC 160 [9] 103 [5] 303.7 325 [14]
AISI 1141 BCC 117 [8] 76 [5] 190.7 450 [13]
Fe 99.9% BCC 35 [7] 22 [5] 49.7 222 [12]
AA 1050 FCC 14 [6] 8 [5] 19.5 29 [11]
According to the observations from [5], the magnitude of the CRSS seems to be directly responsible
for the magnitude of the simulated Se values of all investigated materials. The simulation-based
magnitudes of Se from [5] have been tabulated in Table 2 (see fourth column). Furthermore, these values
from the fourth column of Table 2 have been converted to the case of an unnotched sample (Kt = 1) with
purely alternating stress (R = −1) in order to compare them with the experimental Se values; see fifthMetals 2020, 10, 803 5 of 11
and sixth columns, respectively. For more details on how to deduct Se values for Kt = 1 and R = −1,
see Appendix A. It is opportune to indicate that the authors realized in the time after publication of
the first paper [5] on the CRSS relevance for the fatigue performance of metallic materials and before
performing the present study that the values of Se in [5] represent maximum nominal stress (Smax ) and
not nominal stress amplitude (Sa ) as given there. Since the R ratio selected in the present simulations
was 0 (for axial loading and Kt 2.45), the revised Se values in Table 2 (fourth column) are two times
lower than those published in [5] (Sa = Smax /2 for R = 0).
As visible in Table 2, the numerical study provided relatively good agreement between the
calculated Se values and the experimentally determined Se values of some investigated materials (AISI
304 and AA 1050). This observation refers firstly to AISI 304 steel whose numerically determined Se
value of 303.7 MPa well fits the experimental value of 325 MPa that can be found in literature [14]
(see Appendix A for more details). A relatively good agreement, however with a slight underestimation,
was achieved for the aluminum alloy AA 1050 (19.5 versus 29 MPa [11]). An exception is the value
determined for the steel AISI 1141 of 190.7 MPa, which is considerably lower than the experimental
counterpart (450 MPa [13]). It is expected that a better agreement with the experimental results can
be achieved by selecting another—considerably higher—CRSS magnitude. The CRSS of 117 MPa
calculated by means of MD for BCC α-Fe by Hummel [8] was used in the initial study [5] due to the lack
of a more appropriate value for the steel AISI 1141. The reason to expect a higher CRSS magnitude—and
by that a higher Se value—for the considered steel, AISI 1141, are its improved mechanical properties
over iron—achieved by microstructural modifications, i.e., by the addition of small amounts of the
micro-alloying elements such as vanadium (V, 0.053 wt%) [13,35]. It is known that such alloying
elements contribute to the strength in general, but also to the CRSS magnitude. Another reason to
expect a higher CRSS is the relatively high Rp0.2 of around 560 MPa for this steel. Another divergence
from the values that can be found in literature is seen for Fe 99.9%; the numerically obtained Se value of
49.7 MPa is considerably lower than the experimental value of 222 MPa, as reported in [12]. Here again
the CRSS magnitude could be considered as a reason for the discrepancy. Namely, the CRSS value of
35 MPa extracted from MPT of Rogne and Thaulow [7] and used in [5] is considerably lower than the
MD-based 117 MPa [8] for BCC α-Fe.
Interestingly, when these four simulation-based Se values of the investigated metals (see Table 2)
are plotted versus their Rm values (see Table 1), again a similar observation from Figure 1b follows;
namely, the Se -Rm points of AA 1050 (green circle denoted with number 1) and AISI 304 (golden circle
denoted with number 4)—agreeing well with the Se experiments in Table 2—fall into the range of
points characteristic for their groups of materials, i.e., to light metals and steels, respectively. On the
other hand, the Se -Rm points of the two other metals—Fe 99.9% (purple circle denoted with number
2 in Figure 1b) and AISI 1141 (blue circle denoted with number 3 in Figure 1b)—deviate considerably
from the data representing steels and BCC metals, the same as they deviate from the experimental Se
values from Table 2 (see red crosses in Figure 1b). This observation suggests that the Se values and by
that the CRSS values, too, of the last two metals might be too low. It is necessary to point out once again
that simulation-based Se values for the standard loading case characterized by loading ratio R = −1
and stress concentration factor Kt = 1 (Figure 1b) are obtained from the Se values characteristic for
R = 0 and Kt 2.45 (direct results from the simulations) by using an approach taking into account mean
stress and/or loading ratio [10] in combination with the notch sensitivity approach [15] (see Figure 1a
as well as Appendix A for more details).
3. Results
3.1. Relation between the Critical Resolved Shear Stress and the Fatigue Endurance Limit
When the numerically determined Se values of the four investigated metals from the initial study
published in [5] are plotted with respect to their initially prescribed CRSS values (see both values in
Table 2), an interesting relation can be observed, as shown in Figure 1a. Namely, the Se and CRSSMetals 2020, 10, 803 6 of 11
values relate to each other in a linear manner, despite considering incorrect CRSS values in some cases
(Fe 99.9% and AISI 1141). This newly discovered relation can be expressed by a power-law:
Se = m0 CRSSs , (2)
where m0 is the intercept with the y-axis in Figure 1a and s the slope of the dotted lines. According
to the power-law approximation, m0 equals 0.5142 and s 1.0477 for loading ratio R = 0 and stress
concentration factor Kt 2.45. Interestingly, the slope factor s is approximately equal to 1 in this case.
The Se -CRSS relation can also be expressed by using a linear function, as Se = 0.65CRSS for these
specific R (= 0) and Kt ( 2.45) values. However, the power-law approximation is preferably used due
to higher accuracy, while the simple linear relationship is practically simpler and easier to use. It is
noteworthy that the parameters m0 and s of Equation (2) are dependent on R ratio, Kt , etc. For the
standard loading case (R = −1 and Kt = 1), m0 = 1.0331 and s = 1.1123, while the slope of the linear
function is equal to 1.8625 (see Figure 1a).
3.2. Application of the Newly Discovered Relation
Even though based purely on the simulation results and just partly validated, the Se -CRSS relation
(Equation (2)) can be used as a valuable tool in the next step to shed some light on the two cases in
Table 2 (Fe 99.9% and AISI 1141) where the discrepancies with respect to the experimental results have
been observed. A rather straightforward case to clarify is the one of Fe 99.9%, where by using the
CRSS = 117 MPa [8] for BCC α-Fe directly in the Se -CRSS relation (for R = 0 and Kt 2.45), an endurance
limit of 75.5 MPa is obtained. To prove the approach also from the numerical side, an additional
simulation with the CRSS value of 117 MPa was performed, resulting in an Se value of 74 MPa, which
matches well the experimental Se = 222 MPa [12] when translated to the case characterized by R = −1
and Kt = 1 (200 MPa; see Table 3 as well as Appendix A for more details). This could be a confirmation
that the initially used [5] and MPT-based CRSS of just 35 MPa [7] is too low. The other case of AISI
1141 can be approached from another side; namely, by knowing the target Se = 155 MPa from the
experimental study of Fatemi et al. [13] (R = 0 and Kt 2.45), an estimation of the necessary CRSS
to reach this Se value using the multiscale fatigue simulation approach (see Figure 3) can be done
√ √
by means of the Se -CRSS relation (Equation (2)): CRSS = s (Se /m0 ) = 1.0477 (155/0.5142) = 232.5 MPa.
To validate this estimation, is was necessary to perform additional simulations to determine the
endurance limit by taking all the input parameters the same as in the study on AISI 1141 from [5] and
just by replacing the previously used CRSS of 117 MPa [8] with the new Se -CRSS relation-based value
of 232.5 MPa. The failure cycles resulting from the Se simulations are presented in Figure 2 versus the
applied amplitude levels (Sa = 145–160 MPa, R = 0) and are, at the same place, compared with the
experimental result. These results confirm the estimation of the CRSS magnitude of 232.5 MPa for the
steel AISI 1141 by using the Se -CRSS relation as being correct; the numerically obtained Se = 152 MPa
is slightly lower than the experimentally derived Se = 155 MPa [13] (= 450 MPa for R = −1 and Kt = 1;
see Table 3), which seems to be an acceptable deviation of 2% only.
Table 3. Simulation-based Se values of the investigated materials (revised with the new results for the
steel AISI 1141 and for the Fe 99.9%, marked with * in comparison with experimental values. For details
on how to deduct Se values for R = −1 and Kt = 1, see Appendix A.
Se (MPa)/Sim. Se (MPa)/Sim. Se (MPa)/Exp.
Material Rm (MPa) CRSS (MPa)
R = 0, Kt 2.45 R = −1, Kt = 1 R = −1, Kt = 1
AISI 304 574 [31] 160 [9] 103 [5] 303.7 325 [14]
AISI 1141 * 875 [13] 232.5 (Equation (2)) 152 438.5 450 [13]
AISI 1141 875 [13] 117 [8] 76 [5] 190.7 450 [13]
Fe 99.9% * 414 [33] 117 [8] 74 200 222 [12]
Fe 99.9% 414 [33] 35 [7] 22 [5] 49.7 222 [12]
AA 1050 110 [34] 14 [6] 8 [5] 19.5 29 [11]Metals 2020, 10, 803 7 of 11
Moreover, data from Table 2 can now be revised with the new results for the steel AISI 1141 and
for Fe 99.9% in Table 3. Aside from that, these new simulation-based results are added to Figure 1 and
at the same place visually compared with the experimental values for these metals (see red crosses in
Figure 1b).
It is important to note that no matter whether there is a correct (i.e., validated by a correct resulting
Se value of an investigated existing material) or incorrect CRSS value, there is always a linear relation
between the used CRSS value and the numerically obtained Se value, as can be seen in Figure 1a.
In addition, and in contrast to the initial data from Figure 1b (see circles denoted with numbers
2 and 3), the Se -Rm points of the two revised metals—Fe 99.9% (purple diamond denoted with number
2) and AISI 1141 (blue diamond denoted with number 3)—agree well with the experimental values for
these metals (see red crosses) as well as falling into the acceptable range of points characteristic for steels
and BCC metals. This suggests that the revised Se values of these two metals should be correct—as
well as the accompanying CRSS values—similar to those of AA 1050 (green circle denoted with number
1 in Figure 1b) and AISI 304 (golden circle denoted with number 4 in Figure 1b), which were already
considered correct in the initial study from [5].
4. Discussion
It follows from these observations that the Se -CRSS relation (Equation (2)) introduces a valuable
new description of fatigue strength relations in material properties and a new perspective on the
overall understanding of the fatigue process, especially in comparison to contemporary relations where
Se is being related to, e.g., Rm in a non-unique manner (see Figure 1b). Accordingly, it seems to be
more logical to relate Se to CRSS and not to Rm due to the scattering of Rm that results from different
strain hardening levels (i.e., cold-working) of the material [36], in addition to other strengthening
mechanisms like grain boundary strengthening and phase boundary strengthening, which on the
other hand have no influence on the CRSS (see [5] for more details on the known and applicable linear
superpositioning principle of the strengthening mechanisms that contribute to the CRSS magnitude).
5. Conclusions
To conclude, the presented analysis yields a groundbreaking view on the importance of the
parameter critical resolved shear stress (CRSS) for estimating the fatigue strength of metallic materials.
The newly discovered linear relation between the endurance limit (Se ) and CRSS provides a facet
of fatigue theory which is numerically predictive and which allows the selection of fatigue resistant
materials. Even though additional simulations as well as experimental studies are planned to uphold
this finding, the Se -CRSS relation can already now be used to estimate endurance limits of metallic
materials solely from their CRSS values—which can be on the other hand estimated from micro-pillar
tests, from molecular dynamics simulations or by using the linear superpositioning principle of the
strengthening mechanisms that contribute to its magnitude.
Author Contributions: Conceptualization, both authors; methodology, M.M.; validation, M.M.; formal analysis,
M.M.; investigation, M.M.; data curation, M.M.; writing—original draft preparation, M.M.; writing—review and
editing, both authors; visualization, M.M.; supervision, S.S.; funding acquisition, both authors. All authors have
read and agreed to the published version of the manuscript.
Funding: This research was funded by Deutsche Forschungsgemeinschaft (DFG; German Research Foundation),
grant number SCHM 746/222-1.
Acknowledgments: The authors wish to acknowledge gratefully the permission of respected journals and authors
to use their data and graphics.
Conflicts of Interest: The authors declare no conflict of interest.Funding: This research was funded by Deutsche Forschungsgemeinschaft (DFG; German Research Foundation),
grant number SCHM 746/222-1.
Acknowledgments: The authors wish to acknowledge gratefully the permission of respected journals and
authors to use
Metals 2020, 10, their
803 data and graphics. 8 of 11
Conflicts of Interest: The authors declare no conflicts of interest.
Appendix A
Appendix A
The endurance limit (S ) value for the stress concentration factor (K ) equal to 1 (i.e., notch radius
The endurance limit (See) value for the stress concentration factor (Kt)t equal to 1 (i.e., notch radius
r = 0 mm—unnotched sample) can be deduced from any Se value determined at Kt > 1 (i.e., r > 0) by
r = 0 mm—unnotched sample) can be deduced from any Se value determined at Kt > 1 (i.e., r > 0) by
multiplying it by a factor K , which is commonly called fatigue stress concentration factor, i.e., [15,37]:
multiplying it by a factor fat Kfat, which is commonly called fatigue stress concentration factor, i.e.,
[15,37]:
Se,Kt1 = Se Kfat , (A1)
Se,Kt1 = SeKfat, (A1)
The factor Kfat is determined from the factor Kt by using the expression
The factor Kfat is determined from the factor Kt by using the expression
Kfat==11++ q(K
Kfat q(Ktt − 1),
− 1), (A2)
(A2)
where
whereqqisisthe
thenotch
notchsensitivity
sensitivityand
andcan
canbe
beobtained
obtainedfor
fordifferent
differenttypes
typesof
ofmetals
metalsfrom
fromaadiagram
diagramqq
versus r, as shown in Figure A1 [15].
versus r, as shown in Figure A1 [15].
1
0.9
Notch sensitivity q
0.8
0.7
0.6 Steels (1.4 GPa)
Steels (1.0 GPa)
0.5
Steels (0.7 GPa)
0.4 Steels (0.4 GPa)
AA 2024
0.3
0 0.5 1 1.5 2 2.5 3 3.5 4
Notch radius r (mm)
Figure A1. Notch sensitivity charts for steels with different ultimate strengths (Rm ) and aluminum
Figure A1. Notch sensitivity charts for steels with different ultimate strengths (Rm) and aluminum
alloys AA 2024 subjected to reversed bending or reversed axial loads. For larger notch radii, the use of
alloys AA 2024
the values subjected to reversed
of q corresponding to r = 4bending or reversed axial
mm is recommended [15].loads. For larger notch radii, the use
of the values of q corresponding to r = 4 mm is recommended [15].
Furthermore, any Se value determined for a non-zero mean stress (Sm , 0, i.e., R , −1) can be
Furthermore, any SSemvalue
translated to the zero determined
case (S for a non-zero mean stress (Sm ≠ 0, i.e., R ≠ −1) can be
m = 0, R = −1; often referred to as the standard loading case) as
translated to
follows [10]: the zero S m case (Sm = 0, R = −1; often referred to as the standard loading case) as follows
[10]: √
Se,R-1 = Se [1 − (Sm /Rm )], (A3)
By combining these two approachesS(Equations
e,R-1 = Se √[1 − (Sm/Rm)], (A3)
(A1) and (A3)), it can explained how the Se values
characterizing
By combiningpurely alternating
these two approaches = −1) and for
stress (R (Equations an and
(A1) unnotched sample
(A3)), it (Kt = 1) from
can explained howTables
the Se2
and 3 were determined. Table A1 shows the translation of the simulation-based S
values characterizing purely alternating stress (R = −1) and for an unnotched samplee (Kt = 1) of values the
from
investigated
Tables 2 and 3metals
were from loading Table
determined. and geometry
A1 shows conditions defined
the translation ofby = 0 and Kt 2.45 values
theRsimulation-based to the
Se values of
R =investigated
the −1 and Kt =metals
1 case. from loading and geometry conditions defined by R = 0 and Kt ≅ 2.45 values
to theThe
R = translation
−1 and Kt =of the experimental Se values (from Tables 2 and 3) of the investigated metals from
1 case.
loading and geometry conditions defined by different R and Kt values to the R = −1 and Kt = 1 case is
shown in Table A2.
The Se value for high purity aluminum (AA 1050/1100) reported in [11] (34.5 MPa, Table A2) is
obtained for purely alternating stress (R = −1) conditions and by using an R.R. Moore machine and
unnotched rotating-beam specimen. In such a case, a Marin equation [15,38] can be used to adjust the
Se value to the axial loading case by applying load modification factor kc :
Se,axial = kc Se,bending , (A4)Metals 2020, 10, 803 9 of 11
where kc is equal to 0.85 for axial loading [15].
Table A1. Simulation-based Se values of the investigated materials (revised with the new results for
the steel AISI 1141 and for the Fe 99.9%, marked with *, see Section 3 for more details) translated to the
case of an unnotched sample (Kt = 1) and of purely alternating stress (R = −1).
Se (MPa)
Se (MPa) Se (MPa)
Sm Rm R = −1
Material R=0 Kt q Kfat R=0
(MPa) (MPa) Kt = 1
Kt 2.45 Kt = 1
(Axial)
AISI 304 103 [5] 2.53 0.83 2.27 233.8 233.8 574 [31] 303.7
AISI 1141 * 152 2.39 0.90 2.25 342.2 342.2 875 [13] 438.5
AISI 1141 76 [5] 2.39 0.90 2.25 171.1 171.1 875 [13] 190.7
Fe 99.9% * 74 2.41 0.80 2.13 157.5 157.5 414 [33] 200.0
Fe 99.9% 22 [5] 2.41 0.80 2.13 46.8 46.8 414 [33] 49.7
AA 1050 8 [5] 2.46 0.84 2.23 17.8 17.8 110 [34] 19.5
Stress concentration factors (Kt ) are determined from the numerical model of the notched sheet sample from [13]
and vary between each material slightly due to different material properties defining their stress-strain responses.
Kt = 2.45 is the average value.
Table A2. Experimental Se values of the investigated materials translated to the case defined by Kt = 1
and R = −1.
Se (MPa)
Se (MPa)
Se Sm Rm R = −1
Material R L Kt q Kfat R=0
(MPa) (MPa) (MPa) Kt = 1
Kt = 1
(Axial)
AISI 304 217 [14] −1 a 1.6 0.83 1.50 -> - 574 [31] 325
AISI 1141 155 [13] 0 a 2.39 0.90 2.25 348.9 348.9 875 [13] 450
Fe 99.9% 150 [12] −1 a 1.6 0.80 1.48 -> - 414 [33] 222
AA 1050 34.5 [11] −1 b 1 - - -> - 110 [34] 29
Stress concentration factor of the AISI 1141 steel (Kt = 2.39) is determined from the numerical model of the notched
sheet sample from [13] and varies slightly from the value reported in the same source (Kt = 2.75). The Kt values for
the notched sheet specimens of AISI 304 steel (see [14]) and of Fe 99.9% (see [12]) are determined as recommended
in [15]—see page 1034, Figure A-15-3. L—loading type; a—axial, b—bending.
References
1. Ferro, A.; Montalenti, G. On the effect of the crystalline structure on the form of fatigue curves. Philos. Mag.
1964, 10, 1043. [CrossRef]
2. Ferro, A.; Mazzetti, P.; Montalenti, G. On the effect of the crystalline structure on fatigue: Comparison
between body-centred metals (Ta, Nb, Mo and W) and face-centred and hexagonal metals. Phil. Mag. J. Theor.
Exp. Appl. Phys. 1965, 12, 867–875. [CrossRef]
3. Buck, A. Fatigue properties of pure metals. Int. J. Fract. Mech. 1967, 3, 145–152. [CrossRef]
4. Grosskreutz, J.C. Fatigue mechanisms in the sub-creep range. ASTM 1971, 495, 5–60.
5. Mlikota, M.; Schmauder, S. On the critical resolved shear stress and its importance in the fatigue performance
of steels and other metals with different crystallographic structures. Metals 2018, 8, 883. [CrossRef]
6. Jennings, A.T.; Burek, M.J.; Greer, J.R. Microstructure versus Size: Mechanical properties of electroplated
single crystalline Cu nanopillars. Phys. Rev. Lett. 2010, 104, 135503. [CrossRef] [PubMed]
7. Rogne, B.R.S.; Thaulow, C. Strengthening mechanisms of iron micropillars. Philos. Mag. 2015, 95, 1814–1828.
[CrossRef]
8. Božić, Ž.; Schmauder, S.; Mlikota, M.; Hummel, M. Multiscale fatigue crack growth modelling for welded
stiffened panels. Fatigue Fract. Eng. Mater. Struct. 2014, 37, 1043–1054. [CrossRef]
9. Monnet, G.; Pouchon, M.A. Determination of the critical resolved shear stress and the friction stress in
austenitic stainless steels by compression of pillars extracted from single grains. Mater. Lett. 2013, 98, 128–130.
[CrossRef]
10. Dietmann, H. Einführung in die Elastizitäts- und Festigkeitslehre; Alfred Kröner Verlag: Stuttgart, Germany, 1991.Metals 2020, 10, 803 10 of 11
11. MatWeb—The Online Materials Information Resource. Available online: http://www.matweb.com/search/
DataSheet.aspx?MatGUID=db0307742df14c8f817bd8d62207368e (accessed on 7 May 2020).
12. Islam, M.A.; Sato, N.; Tomota, Y. Tensile and plane bending fatigue properties of pure iron and iron-phosphorus
alloys at room temperature in the air. Trans. Indian Inst. Met. 2011, 64, 315–320. [CrossRef]
13. Fatemi, A.; Zeng, Z.; Plaseied, A. Fatigue behavior and life predictions of notched specimens made of QT
and forged microalloyed steels. Int. J. Fatigue 2004, 26, 663–672. [CrossRef]
14. Atzori, B.; Meneghetti, G.; Ricotta, M. Analysis of the fatigue strength under two load levels of a stainless
steel based on energy dissipation. Frattura Integr. Strutt. 2011, 17, 15–22. [CrossRef]
15. Budynas, R.G.; Nisbett, J.K. Shigley’s Mechanical Engineering Design, 10th ed.; McGraw-Hill Education:
New York, NY, USA, 2015.
16. Mlikota, M.; Schmauder, S.; Božić, Ž. Calculation of the Wöhler (S-N) curve using a two-scale model.
Int. J. Fatigue 2018, 114, 289–297. [CrossRef]
17. Mlikota, M.; Schmauder, S. Virtual testing of plasticity effects on fatigue crack initiation. In Advances
in Engineering Materials, Structures and Systems: Innovations, Mechanics and Applications; Zingoni, A., Ed.;
CRC Press: London, GB, 2019; pp. 587–592.
18. Tanaka, K.; Mura, T. A dislocation model for fatigue crack initiation. J. Appl. Mech. 1981, 48, 97–103.
[CrossRef]
19. Tanaka, K.; Mura, T. A theory of fatigue crack initiation at inclusions. Metall. Trans. A 1982, 13, 117–123.
[CrossRef]
20. Mlikota, M.; Staib, S.; Schmauder, S.; Božić, Ž. Numerical determination of Paris law constants for carbon
steel using a two-scale model. J. Phys. Conf. Ser. 2017, 843, 012042. [CrossRef]
21. Glodež, S.; Jezernik, N.; Kramberger, J.; Lassen, T. Numerical modelling of fatigue crack initiation of
martensitic steel. Adv. Eng. Softw. 2010, 41, 823–829. [CrossRef]
22. Jezernik, N.; Kramberger, J.; Lassen, T.; Glodež, S. Numerical modelling of fatigue crack initiation and growth
of martensitic steels. Fatigue Fract. Eng. Mater. Struct. 2010, 33, 714–723. [CrossRef]
23. Mlikota, M.; Schmauder, S.; Božić, Ž.; Hummel, M. Modelling of overload effects on fatigue crack initiation
in case of carbon steel. Fatigue Fract. Eng. Mater. Struct. 2017, 40, 1182–1190. [CrossRef]
24. Mlikota, M.; Schmauder, S. Numerical determination of component Wöhler curve. DVM Bericht 2017,
1684, 111–124.
25. Božić, Ž.; Schmauder, S.; Mlikota, M.; Hummel, M. Multiscale fatigue crack growth modeling for welded
stiffened panels. In Handbook of Mechanics of Materials; Schmauder, S., Chen, C.-S., Chawla, K.K., Chawla, N.,
Chen, W., Kagawa, Y., Eds.; Springer: Singapore, 2018; pp. 1–21.
26. Huang, X.; Brueckner-Foit, A.; Besel, M.; Motoyashiki, Y. Simplified three-dimensional model for fatigue
crack initiation. Eng. Fract. Mech. 2007, 74, 2981–2991. [CrossRef]
27. Briffod, F.; Shiraiwa, T.; Enoki, M. Fatigue crack initiation simulation in pure iron polycrystalline aggregate.
Mater. Trans. 2016, 57, 1741–1746. [CrossRef]
28. Božić, Ž.; Mlikota, M.; Schmauder, S. Application of the ∆K, ∆J and ∆CTOD parameters in fatigue crack
growth modelling. Tech. Gaz. 2011, 18, 459–466.
29. Boži, Ž.; Schmauder, S.; Mlikota, M. Fatigue growth models for multiple long cracks in plates under cyclic
tension based on ∆KI, ∆J-integral and ∆CTOD parameter. Key Eng. Mater. 2011, 488–489, 525–528.
30. Jin, H.-H.; Ko, E.; Kwon, J.; Hwang, S.S.; Shin, C. Evaluation of critical resolved shear strength and deformation
mode in proton-irradiated austenitic stainless steel using micro-compression tests. J. Nucl. Mater. 2016,
470, 155–163. [CrossRef]
31. Krompholz, K.; Ullrich, G. Investigations into the fatigue crack initiation and propagation behaviour in
austenitic stainless steel X5 CrNi 18 9 (1. 4301). Materialwiss. Werkstofftech. 1985, 16, 270–276. [CrossRef]
32. Bao, W.P.; Xiong, Z.P.; Ren, X.P.; Wang, F.M. Effect of strain rate on mechanical properties of pure iron.
Adv. Mater. Res. 2013, 705, 21–25. [CrossRef]
33. Keil, B.; Devletian, J. Comparison of the mechanical properties of steel and ductile iron pipe materials.
In Pipelines 2011: A Sound Conduit for Sharing Solutions, Proceedings of the Pipelines Conference 2011, Seattle, WA,
USA, 23–27 July 2011; Jeong, D.H.S., Pecha, D., Eds.; American Society of Civil Engineers: Reston, VA, USA,
2011; pp. 1301–1312.
34. Lorenzino, P.; Navarro, A.; Krupp, U. Naked eye observations of microstructurally short fatigue cracks.
Int. J. Fatigue 2013, 56, 8–16. [CrossRef]Metals 2020, 10, 803 11 of 11
35. Yang, L.; Fatemi, A. Impact resistance and fracture toughness of vanadium-based microalloyed forging steel
in the as-forged and Q&T conditions. J. Eng. Mater. Technol. 1996, 118, 71–79.
36. Schijve, J. Fatigue of Structures and Materials; Springer Netherlands: Dordrecht, The Netherlands, 2009.
37. Bhaduri, A. Mechanical Properties and Working of Metals and Alloys; Springer Nature: Singapore, 2018.
38. Marin, J. Mechanical Behavior of Engineering Materials; Prentice Hall: Englewood Cliffs, NJ, USA, 1962.
© 2020 by the authors. Licensee MDPI, Basel, Switzerland. This article is an open access
article distributed under the terms and conditions of the Creative Commons Attribution
(CC BY) license (http://creativecommons.org/licenses/by/4.0/).You can also read