RE-GREENING WASHINGTON, DC: A Green Roof Vision Based on Quantifying Storm Water and Air Quality Benefits
←
→
Page content transcription
If your browser does not render page correctly, please read the page content below
RE-GREENING WASHINGTON, DC:

                             A Green Roof Vision
                            Based on Quantifying
                      Storm Water and Air Quality Benefits

           Washington, DC: 2002                 Washington, DC: 2025

Casey Trees Endowment Fund
Barbara Deutsch, ASLA, ISA, Senior Director
Heather Whitlow, Green Infrastructure Fellow

Limno-Tech, Inc.
Michael Sullivan, Vice President
Anouk Savineau, PE, Project Engineer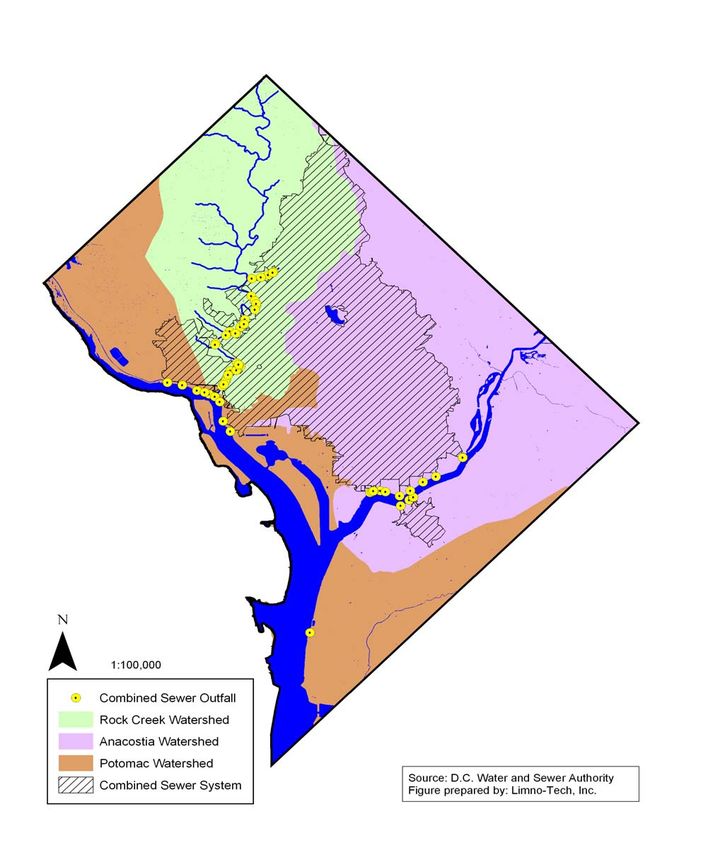
Table of Contents

Introduction................................................................................................................................................. 1

Research Goals........................................................................................................................................... 2

Methodology ............................................................................................................................................... 2
      General Approach ............................................................................................................................ 2
      Green Roof Opportunity Area .......................................................................................................... 2
      Coverage Scenarios......................................................................................................................... 3
      Types of Green Roofs ...................................................................................................................... 5
      Storm Water Model .......................................................................................................................... 5
      Air Quality Model.............................................................................................................................. 7
      Target Green Roof Coverage .......................................................................................................... 7

Findings....................................................................................................................................................... 7
       Storm Water Model Findings ........................................................................................................... 7
       Air Quality Model Findings ............................................................................................................. 10
       Target Green Roof Coverage ........................................................................................................ 10
       Water and Air Quality Benefits for the Target Green Roof Coverage............................................ 11
       Summary Findings at Target Green Roof Coverage ..................................................................... 12

Recommendations.................................................................................................................................... 13

Next Steps ................................................................................................................................................. 13

Areas for Further Study ........................................................................................................................... 14
       Hydrologic Modeling of Storm Water Benefits ............................................................................... 14
       Green Build-out Model for DC........................................................................................................ 14
       Heat Island Modeling ..................................................................................................................... 14
       Economic Cost/Benefit Analysis .................................................................................................... 14

Final Thoughts .......................................................................................................................................... 15

                                                        List of Tables and Figures

Table 1: Summary of land and building areas in Washington, DC ............................................................... 3
Table 2: Summary of building areas used in green roof benefit calculations ............................................... 3
Table 3: Impact of green roofs on storm water runoff volume ...................................................................... 8
Table 4: Number of annual rain events that trigger combined sewer overflows........................................... 9
Table 5: Reduction in the number and volume of CSO discharges triggered by annual rain events ........... 9
Table 6: Green roof air pollutant removal and street tree equivalence....................................................... 10
Table 7: Storm water runoff reduction for target green roof coverage scenario ......................................... 11
Table 8: Reduction in the number and volume of CSO discharges for target green roof coverage........... 12

Figure 1: Green roof-ready area ...................................................................................................................3
Figure 2: Distribution of “green roof-ready” buildings in Washington, DC ....................................................4
Figure 3: Mass balance used to calculate roof runoff ...................................................................................5
Figure 4: Location of watersheds, sewer systems, and CSO outfalls in the District.....................................6
Figure 5: Comparison of roof runoff for conventional roofs and green roofs ................................................8
Figure 6: Proportions of air pollutants removed by green roofs..................................................................10
Figure 7: Air pollutant removal for target green roof scenario ....................................................................12

Casey Trees Endowment Fund
Limno-Tech, Inc.                                                                                                                                     08/24/05
Introduction

This paper presents a quantitative assessment of the storm water and air quality benefits provided by
green roofs at different coverage scenarios in Washington, DC. Quantifying these benefits allows the
contribution of green roofs to be included in developing solutions to air and water quality problems in the
District of Columbia, improving public health, optimizing capital investment in municipal infrastructure, and
guiding future growth as the city redevelops.

The District of Columbia is a 61.4 square mile area, home to 572,000 residents, and the capital of the
United States. In the last 30 years, the City:

        Lost 200,000 residents to the surrounding metropolitan area 1
        Lost 64% of its areas with heavy tree cover2
        Increased storm water runoff by 34%3

At this time, District of Columbia residents pay some of the highest taxes in the United States, yet the
District:

        Does not meet federal water quality standards for the Anacostia, Potomac, and Rock Creek
        Rivers
        Must invest in a Long Term Control Plan (LTCP) to manage its combined sewer overflows
        (CSOs). Current cost is $1.9 billion for three large underground storm water storage tunnels.
        Is not meeting federal air quality standards for ground-level ozone and particulate matter 4
        Is in jeopardy of losing approximately $120 million/ year in Federal Highway Funds for not
        meeting federal air quality standards
        Has one of the highest asthma rates in the country: 6.5% of children5 and 5% of adults6

Mayor Anthony Williams is committed to increasing the District’s population by 100,000 residents by 2010
to revitalize the city and provide the tax base necessary to support city services. The mayor is also
committed to ensuring that there is an overall benefit to the environment from this increased infill and
redevelopment. His vision to clean up the Anacostia River and revitalize its neighborhoods led to a
unique partnership between District and Federal Government and the establishment of the Anacostia
Waterfront Initiative (AWI) in 2000. His legacy will also include the revision of the City’s Comprehensive
Plan, last updated in 1984, and the development and implementation of an Environmental Agenda to
clean the City’s air and water.

Approximately 15% of District land is covered with buildings and approximately 14 million square feet (sf)
of additional building footprint area is proposed in the next 20 years7, primarily in the downtown business
area, near transportation corridors and metro stations, and in the Anacostia Waterfront Initiative area. By
many indicators, Washington is currently considered to be one of the hottest real estate markets in the
country.

While the design, construction, and operation of buildings account for significant economic opportunity in
DC and 20% of all economic activity in the United States8, buildings also account for 40% of raw material
consumption, 35% of total energy use, 65% of electricity use, 12% of fresh water supplies, 88% of
potable water supplies, and 30% of greenhouse gas emissions9. Therefore, green building and green
infrastructure strategies are critical to minimizing the environmental impacts of development.

Green roofs provide significant opportunities to minimize building impacts and provide multiple
environmental and economic benefits. In addition to reducing heat island effect, energy usage, and raw
material consumption by typically doubling the life of the roof10, green roofs provide air and water quality
benefits.

Casey Trees Endowment Fund                                                                       Page 1 of 15
Limno-Tech, Inc.                                                                                    08/24/05
Green roofs store rain and consequently reduce storm water runoff volumes and the rate of runoff. The
District of Columbia is served by both combined and separate storm sewer systems. In a municipal
separate storm sewer system (MS4), reducing runoff lowers the amount of untreated polluted storm water
that discharges directly to receiving waters. By reducing the rate of runoff, green roofs help to control
erosion around storm water inlet and outlet points. In a combined sewer system (CSS), where storm
water and wastewater share the same pipes, green roofs improve water quality in receiving streams by
reducing the number of combined sewer overflow discharges that occur when the system’s capacity is
exceeded by increased storm water volumes.

Green roofs, like all vegetation, provide air quality benefits. They remove ozone, particulate matter, and
other pollutants from the air through physical and biological processes. Green roofs also reduce
temperatures, which can preclude the chemical reaction that produces ground-level ozone.

Research Goals

The goals of this research are to:

    1. Quantify the contribution green roofs can make toward improving air and water quality in the
       District of Columbia at different green roof coverage scenarios
    2. Assess benefits at different coverage scenarios and propose a green roof coverage objective to
       form the basis of a Green Roof Vision for DC
    3. Identify next steps and areas for further study

Methodology

General Approach

This research determines and assesses the water and air quality benefits at different green roof coverage
scenarios for existing buildings and proposed development throughout the District. The storm water
benefits were estimated using a model created by LimnoTech, Inc, which developed the modeling for the
DC Water and Sewer Authority’s (WASA) Long Term Control Plan for combined sewer overflows. The air
quality benefits were estimated using the Urban Forest Effects model (UFORE), developed by the United
States Department of Agriculture (USDA) Forest Service. A green roof coverage objective was proposed
based on the estimated water and air benefits, the mix of existing and proposed development, and
projected and actual green roof coverage in other cities.

Green Roof Opportunity Area

The opportunity area for green roof coverage in the District of Columbia was determined by considering
all existing and proposed buildings with footprints greater than 10,000 square feet. This size building is
typically a commercial, industrial, government, or large residential building and was selected for the
relative ease of widespread green roof implementation.

Existing building footprints were obtained from the DC Office of the Chief Technology Officer (OCTO) and
reflect conditions as of 2002. For these buildings, the rooftop area was assumed to equal the building
footprint area. The proposed development area was obtained from the DC Office of Planning and
includes both planned and proposed projects that will come online in the next 2-15 years. Based on
discussions with the Office of Planning, the rooftop area for proposed development was assumed to
cover 80 percent of the lot.

Casey Trees Endowment Fund                                                                    Page 2 of 15
Limno-Tech, Inc.                                                                                 08/24/05
The amount of rooftop area available for green roof coverage
Existing was identified as the “green roof ready-area”. It was assumed
Rooftop that green roof vegetation would cover 80% of the area of each
roof to account for standard rooftop features such as the HVAC
system and roof access (Figure 1).
Buildings comprise approximately 15 percent of the District’s
total land area. Using 80% of the footprint of buildings greater
than 10,000 square feet, Washington DC currently has
Greenroof
approximately 75 million square feet of rooftop area available
(80% of Existing Rooftop) for green roof projects, or 29 percent of the total building area.
Table 1 summarizes the building areas for the entire city.
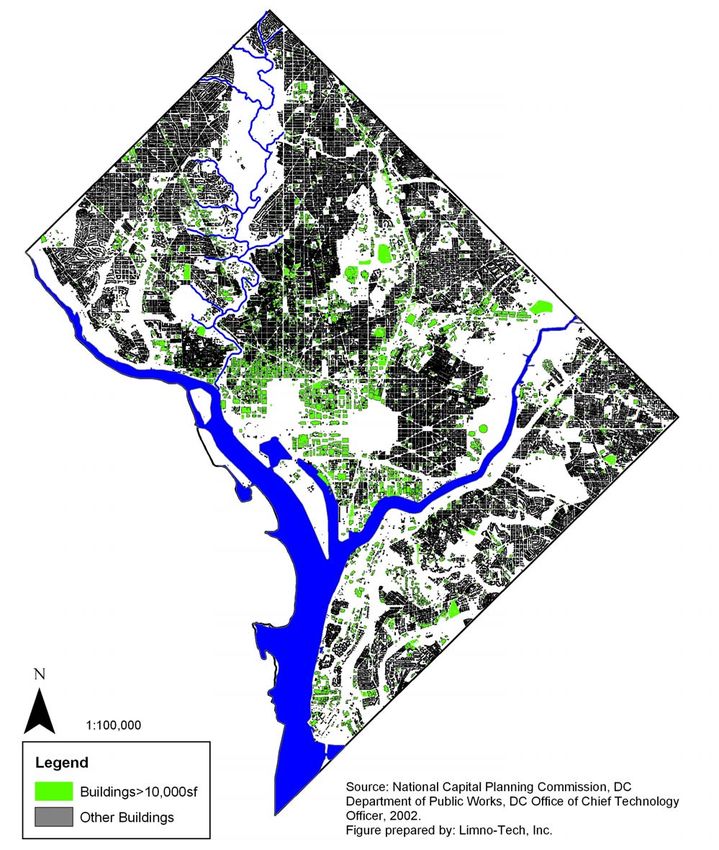
Figure 1: Green roof-ready area Figure 2 shows the spatial distribution of the “green roof-ready”
buildings in the District.
Table 1: Summary of land and building areas in Washington, DC
Land/Building Description Area (sq ft) Percentage
Total land area in DC 1,711,500,000
Total building footprint in DC 262,043,000 15% of total land area
Existing 247,781,000 95% of total building footprint area
Proposed (new) 14,262,000 5% of total building footprint area
Total building footprint >10,000sf 93,713,000 36% of total building footprint area
Existing 79,740,000 85% of bldg>10,000sf area
Proposed (new) 13,973,000 15% of bldg>10,000sf area
Total “green roof-ready” area (80% of footprint) 74,970,000 29% of total building footprint area
Existing 63,792,000 85% of “green roof-ready” area
Proposed (new) 11,178,000 15% of “green roof-ready” area
Coverage Scenarios
Six scenarios were used to explore benefits of green roof coverages ranging from 0% to 100% coverage.
Coverages were calculated as a percentage of the green roof-ready area. For example, 100% green roof
coverage is in effect 80% of the rooftop area for buildings over 10,000 sf; 20% green roof coverage is in
effect 16% of the rooftop area for buildings over 10,000 sf (Table 2).
Table 2: Summary of building areas used in green roof benefit calculations
% of Total
Scenario Total Green % of Roof Space
Building
(% Green roof Roof Ready on Buildings >
Footprint Area
Coverage) Area (sf) 10,000 sf
in DC
Case 1 (0%) 0 0% 0%
Case 2 (20%) 14,994,000 16% 6%
Case 3 (40%) 29,988,000 32% 11%
Case 4 (60%) 44,982,000 48% 17%
Case 5 (80%) 59,976,000 64% 23%
Case 6 (100%) 74,970,000 80% 29%
Casey Trees Endowment Fund Page 3 of 15
Limno-Tech, Inc. 08/24/05Figure 2: Distribution of “green roof-ready” buildings in Washington, DC Casey Trees Endowment Fund Page 4 of 15 Limno-Tech, Inc. 08/24/05
Types of Green Roofs

Extensive green roofs utilize soil depths of 2-6 inches, require minimal maintenance, and typically can be
built with no additional structural support to the building thereby offering greater opportunity for
widespread application. Intensive green roofs utilize more than 6 inches of soil, can support greater plant
mass such as shrubs and trees, require greater maintenance for plants, and typically involve additional
structural support to bear the added weight of the green roof. For each of the six scenarios, it was
assumed that 80% of green roofs would be extensive green roofs and 20% would be intensive.

Storm Water Model

The storm water model was built by Limno-Tech to quantify the cumulative contribution green roofs make
toward reducing storm water runoff and combined sewer overflow events in the District of Columbia. The
model was designed specifically for the District of Columbia’s sewer system, where approximately one-
third of land is served by a CSS and two-thirds by an MS4. Storm water benefits were determined for the
District as a whole and within the three watersheds of the District: the Anacostia River, the Potomac
River, and Rock Creek (Figure 4).

A simple mass balance was used to estimate roof runoff, as illustrated in Figure 3.

       P            E

                                       R      =        P        –         E            –    S
                                  (roof runoff)   (precipitation)   (evapotranspiration)   (storage)

               S

              R
    Figure
Figure     4: Mass
       3: Mass     balance
               balance used to calculate roof runoff

The storm water benefits were calculated based on “average year” conditions. A review of 50 years of
rainfall data at Ronald Reagan National Airport showed that the year 1990 is most representative of an
average year. The hourly precipitation record for 1990 was obtained from the National Weather Service.
The mass balance assumes green roof storage is regenerated through evapotranspiration.
Evapotranspiration rates were obtained from the Virginia State Climatology Office. Based on these rates,
it was estimated that storage would completely regenerate if more than four days elapse between rain
events. The model assumes 2 inches of rainwater storage for extensive green roofs and 4 inches for
intensive.11 Conventional roofs store approximately 0.04 inches of rain, as determined by using the
Natural Resources Conservation Service (NRCS) curve number methodology.

The reduction in CSOs was calculated by comparing the storage capacity provided by green roofs to the
overflow volume discharged at each combined sewer outfall for each rain event. If the green roof storage
capacity is greater than the overflow volume, then no overflow event occurs. If the storage capacity is
less than the overflow volume, an overflow event will occur. CSO discharge volumes for each rain event
in 1990 were obtained from the Long Term Control Plan.

DC WASA and the District of Columbia Department of Health, Watershed Protection Division reviewed
the findings to assess their significance.

Casey Trees Endowment Fund                                                                             Page 5 of 15
Limno-Tech, Inc.                                                                                          08/24/05
Figure 4: Location of watersheds, sewer systems, and CSO outfalls in the District Casey Trees Endowment Fund Page 6 of 15 Limno-Tech, Inc. 08/24/05
Air Quality Model

The USDA Forest Service’s Urban Forest Effects (UFORE) model was used to determine the air quality
benefits provided by green roofs. This model, developed by Dave Nowak at the Syracuse Research
Station, uses local hourly pollution concentrations, meteorological data, and plant-specific air pollution
removal rates to quantify the benefits provided by urban forests. Air pollutants include: ground-level
ozone, particulate matter, sulfur dioxide, nitrogen dioxide, and carbon monoxide.

The UFORE model air pollutant removal depends on the type of vegetation. The UFORE model has
been developed for trees, shrubs, and grasses, however no removal rate data exists for sedums, which
are the typical vegetation type for extensive green roofs in the Washington area. A 50:50 mix of grasses
and evergreen shrubs was used by researchers at the University of Toronto’s Environment Canada and
recommended by the USDA Forest Service to estimate typical green roof composition. It was assumed
that this combination will approximate the DC-wide mix of evergreen and deciduous vegetation used in
intensive and extensive green roofs, both in terms of seasonal foliage change and the size and shape of
the leaves.

The air quality benefits from green roofs were then compared to the air quality benefits obtained from
street trees for the District of Columbia as determined in the Casey Trees 2002 Street Tree Inventory12.

Target Green Roof Coverage

The determination of the target green roof coverage was based on:

        Significance of the benefits provided at the different green roof coverage scenarios
        Green roof coverage in other cities
        Ease of implementation in Washington, DC

The storm water and air quality benefits were then determined for this target green roof coverage.

Findings

Storm Water Model Findings

On a per roof basis, the storm water mass balance model predicted that an extensive green roof can
reduce roof runoff volumes by approximately 65 percent, while an intensive roof can reduce runoff by 85
percent. Using a combination of 80% extensive and 20% intensive ratio across all green roof-ready
buildings in the District, roof runoff volume would decrease by as much as 69% as compared to
conventional rooftops (Figure 5).

On a cumulative basis, the findings of the storm water runoff model for all six cases over an average year
of precipitation are shown in Table 3. As Case 2 shows, at the minimum coverage scenario of 20% of all
“green roof-ready” buildings, 23 million gallons would be added to the city’s storage capacity. This is the
equivalent of approximately 80 Olympic sized swimming pools. Over the course of an average year, this
translates into 297 million gallons of precipitation that would be captured by the green roof instead of
entering the combined or storm sewer system. At 100% coverage, if all of the buildings over 10,000
square feet were green roofed, almost 1,500 million gallons could be stored throughout the course of a
year.

Casey Trees Endowment Fund                                                                     Page 7 of 15
Limno-Tech, Inc.                                                                                  08/24/05
Runoff Volume
65%
Reduction 69%
Reduction
85%
Reduction
Coventional Roof Extensive Intensive Greenroof 80% Extensive,
Greenroof 20% Intensive
Figure 5: Comparison of roof runoff for conventional roofs and green roofs
The reduction in city-wide storm water runoff volume that green roofs would provide in an average year is
shown in the final column of Table 3. While the absolute values of storm water volume retention are
considerable, they comprise a small percentage of the total runoff generated by the entire city. The
magnitude of the impact of green roofs is diluted when analyzed at the city-wide level because buildings
covering 10,000 square feet or more make up just 6% of the total city area. Yet, in areas of high-density
development dominated by impervious land covers, such as the downtown commercial core, green roofs
would provide significant reductions in storm water volume.
Table 3: Impact of green roofs on storm water runoff volume
Annual Annual
Total Reduction in
Scenario Total Green Storage Citywide
Available Annual
(% Green roof roof Area Provided by Runoff
Roof Storage Citywide
Coverage) (Square feet) Green roofs Volume
(Million gal) Runoff
(Million gal) (Million gal)
Case 1 (0%) 0 2 0 25,550 0%
Case 2 (20%) 14,994,000 23 297 25,250 1.2%
Case 3 (40%) 29,988,000 45 594 24,950 2.3%
Case 4 (60%) 44,982,000 68 891 24,660 3.5%
Case 5 (80%) 59,976,000 90 1,188 24,360 4.6%
Case 6 (100%) 74,970,000 113 1,485 24,060 5.8%
Because green roofs prevent and delay roof runoff, they also impact the number of combined sewer
overflow events in the District. For the different green roof scenarios, Table 4 shows the number of
rainfall events that trigger CSOs in an average year in each of the District’s three watersheds. It also
shows how the number of overflow events would decrease under each of the six green roof scenarios.
While increasing the number of green roofs would have no effect on the number of rain events that cause
overflows in the Potomac River watershed, even 20% green roof coverage would significantly lower the
number of rain events leading to overflows into Rock Creek. Rain events leading to overflows in the
Casey Trees Endowment Fund Page 8 of 15
Limno-Tech, Inc. 08/24/05Anacostia watershed would be moderately reduced with increasing green roof coverage. It is important to
note that even one such rain event has adverse effects on water quality, since the receiving streams for
the discharges experience high bacteria levels, depletion of dissolved oxygen, and accelerated erosion of
stream banks.
Table 4: Number of annual rain events that trigger combined sewer overflows
Scenario Anacostia River Potomac River Rock Creek
Case 1 (0%) 73 72 28
Case 2 (20%) 71 72 18
Case 3 (40%) 70 72 18
Case 4 (60%) 67 72 14
Case 5 (80%) 67 72 12
Case 6 (100%) 66 72 12
When the capacity of the combined sewer is exceeded during a rain event, the excess flow is discharged
directly to the Anacostia River, the Potomac River, or Rock Creek through a CSO outfall. There are 60
CSO outfall points in the District, 17 in the Anacostia River, 14 in the Potomac River, and 29 in Rock
Creek (Figure 3). A single rain event could trigger anywhere from zero to 60 discharges depending on its
intensity and duration. There are 73 rain events in an average year that can trigger discharges at any of
the 60 outfalls, resulting in many discharges of unprocessed sewage to the District’s river system. Table
5 shows the reduction in the total number of CSO discharges triggered by rain events in an average year
for the different green roof scenarios.
Table 5: Reduction in the number and volume of CSO discharges triggered by annual rain events
Anacostia River Potomac River Rock Creek Total
# of CSO Outfalls 17 14 29 60
Number Volume Number Volume Number Volume Number Volume
Case 1 (0%) 0% 0 MG 0% 0 MG 0% 0 MG 0% 0 MG
Case 2 (20%) 7% 52 MG 13% 15 MG 38% 8 MG 13% 75 MG
Case 3 (40%) 9% 104 MG 24% 33 MG 46% 13 MG 19% 150 MG
Case 4 (60%) 13% 155 MG 26% 38 MG 56% 17 MG 23% 210 MG
Case 5 (80%) 15% 206 MG 28% 48 MG 61% 20 MG 25% 273 MG
Case 6 (100%) 17% 254 MG 32% 56 MG 62% 23 MG 28% 334 MG
When Table 5 is analyzed alongside Table 4, it becomes apparent that although green roofs have only a
moderate impact in reducing the annual number of rain events that lead to discharges, they significantly
lower the number of discharges that occur for each rain event. Implementing green roofs on just 20% of
green roof-ready buildings would prevent 13% of the discharges that occur every year, thereby keeping
approximately 75 million gallons of raw sewage from entering the District’s river systems.
In addition to CSO benefits, green roofs will also impact the volume of storm water that enters DC’s
separate sewer system. The separate storm sewer flows are discharged directly to the receiving waters
without treatment, and carry many pollutants such as oils, nutrients, bacteria, and metals.
WASA has stated that these storm water benefits are significant for both the CSO and MS4 areas with
respect to meeting DC water quality objectives, and that they could potentially provide significant savings
in capital investment in the LTCP. The District Department of Health agrees and has stated that the
findings of this analysis will serve as the basis for creating additional incentives and regulations to support
wide-scale implementation of green roofs.
Casey Trees Endowment Fund Page 9 of 15
Limno-Tech, Inc. 08/24/05Air Quality Model Findings
For the UFORE model, a 50-50 grass/evergreen shrub mix was used to approximate the average
composition of green roofs. Figure 6 displays the proportions of the various pollutants removed by this
type of green roof vegetation mix. As the figure shows, the highest pollutant removal is for ozone (O3),
followed by particulate matter less than 10 microns in diameter (PM10). High concentrations of these two
pollutants are responsible for the federal air quality standard violations in the Washington Metropolitan
area. Green roofs also remove substantial amounts of sulfur dioxide (SO2), nitrogen dioxide (NO2), and
carbon monoxide (CO).
Because an average vegetation mix was used in the
SO2 UFORE model, the pollution removal at different
coverage scenarios depends only on the green roof
CO 5% area. Table 6 shows the total metric tons of these air
13% pollutants that would be removed annually under the
O3 different green roof coverage scenarios.
NO2 13% 35%
In order to assess the significance of the air quality
benefits provided by green roofs, the air pollutant
removal values were compared to those provided by
PM10 street trees. The UFORE model had previously been
34% run for the 105,900 street trees in the District13, taking
into account the species mix, size, and condition of
those trees. Using the total pollution removed by all of
Figure 6: Air pollutant removal from green the street trees in the District, the removal rate of an
Figure 6: Proportions of air pollutants
f “average” street tree was calculated for each pollutant.
removed by green roofs
Table 6 lists the number of street trees that would remove an equivalent amount of pollution as the green
roofs under each coverage scenario.
Table 6: Green roof air pollutant removal and street tree equivalence
Scenario Total Annual
Equivalent # of DC Street Trees
(% Green roof Pollutant Removal
Coverage) (Metric Tons) O3 PM10 SO2 NO2 CO
Case 1 (0%) 0 0 0 0 0 0
Case 2 (20%) 11.6 17,300 23,000 19,100 18,700 19,300
Case 3 (40%) 23.2 34,500 46,000 38,300 37,400 38,500
Case 4 (60%) 34.8 51,800 68,900 57,400 56,100 57,800
Case 5 (80%) 46.4 69,000 91,900 76,500 74,800 77,000
Case 6 (100%) 58.0 86,300 114,900 95,700 93,500 96,300
Target Green Roof Coverage
The determination of the target green roof coverage was based on:
Significance of the benefits provided at the different green roof coverage scenarios
Green roof coverage in other cities
Ease of implementation in Washington, DC
Casey Trees Endowment Fund Page 10 of 15
Limno-Tech, Inc. 08/24/05Findings show storm water and air quality benefits to be significant at the lowest green roof coverage
scenario of 20%. A 20% green roof coverage would prevent, on average, 13% of CSO discharges,
thereby keeping 75 million gallons of raw sewage from entering the District’s river systems. This
coverage would also provide the same air quality benefits as approximately 19,500 trees. Based on
efforts in other municipalities, a 20% green roof coverage appears to be a reasonable and feasible target
for the District of Columbia.
At this time Germany is estimated to have anywhere from 14 - 27% green roof coverage depending on
considerations regarding existing flat roofs, new construction, all buildings, certain cities, or the country at
large. The city of Chicago has implemented policies and incentives that encourage the installation of
green roofs on new construction and major renovations, which has resulted in over 120 projects totaling
over 1.6 million square feet of green roof in various stages of contracted development. The city of
Portland Oregon has developed policies and incentives to facilitate wide-scale implementation of green
roofs. Once the City’s Clean River Incentive and Discount Program is running, green roof coverage is
expected to quickly and significantly increase.
A number of initiatives underway in DC provide an opportunity to facilitate similar wide-scale
implementation of green roofs in the District. These include the establishment of the new DC Department
of the Environment, the update of the Comprehensive Plan, and the Water and Sewer Authority’s Long
Term Control Plan to manage Combined Sewer Overflows.
Based on these factors, a starting target green roof coverage for DC was assumed to be 20%. A
scenario for achieving 20% coverage was then developed by prioritizing coverage on proposed
development in order to facilitate implementation. In this case, if 80% of the proposed green roof-ready
building areas and 20% of the existing green roof-ready building areas had green roofs, there would be
21.7 million square feet of green roof area in DC. This is the approximate equivalent of 20% of the total
roof area on all buildings greater than 10,000 square feet.
Water and Air Quality Benefits for the Target Green Roof Coverage
The storm water and air quality benefits were calculated for the target green roof coverage. Tables 7 and
8 below show the findings of the storm water model assuming that 20% of existing and 80% of new
development have green roofs. The same assumptions used in the original six scenarios apply. The
green roofs would add 33 million gallons to the city’s storm water storage capacity. The cumulative
storage over the course of an average year would exceed 430 million gallons. The number of CSO
discharges would decrease by 15%.
Table 7: Storm water runoff reduction for target green roof coverage scenario
Total Annual
Total Reduction
Green roof Storage
Available in Annual
Target Green Roof Coverage Area Provided by
Roof Storage Citywide
(Square Green roofs
(Million Gal) Runoff
Feet) (Million Gal)
Existing Dev (20% Green roofs) 12,758,000 19 253 1.0%
Proposed Dev (80% Green roofs) 8,943,000 13 177 0.8%
Total 21,701,000 33 430 1.7%
Casey Trees Endowment Fund Page 11 of 15
Limno-Tech, Inc. 08/24/05Table 8: Reduction in the number and volume of CSO discharges for target green roof coverage
Anacostia River Potomac River Rock Creek Total
# of CSO Outfalls 17 14 29 60
# Volume # Volume # Volume # Volume
Existing Dev (20% Green roofs) 5% 43 MG 13% 14 MG 37% 8 MG 12% 65 MG
Proposed Dev (80% Green roofs) 6% 36 MG 3% 3 MG 2% 2 MG 4% 41 MG
Total 9% 79 MG 14% 16 MG 39% 9 MG 15% 104 MG
Air pollution removal from green roofs at the target coverage is shown in Figure 7. On average, the air
quality benefits are equivalent to those that 28,000 street trees would provide.
7.00
6.00
6.00 5.66
5.00 Total = 16.80 Metric Tons of
Air Pollutants Removed
Metric Tons
4.00
25,000
Street 33,300
3.00 Street
Trees
Trees 2.21 2.17
2.00
27,700 27,100
1.00 Street Street 0.77
Trees Trees
27,900
0.00
O3 PM10 SO2 NO2 CO
Figure 7: Air pollutant removal for target green roof scenario
Summary Findings at Target Green Roof Coverage
If 80% of all proposed and 20% of all existing green roof-ready buildings had green roofs, the resulting
21,700,000 square feet of green roofs would provide the following storm water and air quality benefits:
Storm Water Management
30 million gallon increase in the city’s storm water storage capacity
(Proposed Long-Term Control Plan tunnels could store 194 million gallons)
430 million gallons of rainwater stored over the course of an average year
(The equivalent of 1700 Olympic-sized swimming pools)
1.7% reduction in citywide runoff
Casey Trees Endowment Fund Page 12 of 15
Limno-Tech, Inc. 08/24/0515% reduction in the total number of CSO discharges per year
o 9% reduction in discharges to the Anacostia River
o 14% reduction in discharges to the Potomac River
o 39% reduction in discharges to Rock Creek
The DC Water and Sewer Authority (WASA) has stated that these storm water benefits are significant
with respect to meeting DC water quality and storm water objectives, and that they could potentially
provide significant savings in capital investment in the LTCP. The District Department of Health agrees
the findings of this analysis will serve as the basis for creating additional incentives and regulations that
support more wide-scale implementation of green roofs.
Air Quality
Annual removal of 16.8 tons of air pollutants (O3, SO2, CO, NO2, and particles)
(The equivalent of approximately 28,000 street trees)
Annual removal of 6.0 tons of ground-level ozone from the air
(The equivalent of approximately 25,000 street trees)
Annual removal of 5.7 tons of particles from the air
(The equivalent of approximately 33,000 street trees)
The air quality benefits are approximately 25% of the contribution of DC’s 105,900 street trees,
suggesting that green roofs would make a significant contribution to air quality improvements. Further
work is required to determine additional significance of these findings for air quality planning in the
District.
Recommendations
Based on the findings at the target green roof coverage, the recommended green roof coverage objective
is:
20 years/ 20% coverage/ 20 million sf
To meet the “20-20-20” objective would require leadership from both the DC and Federal Government to
direct that all new buildings in the District have a green roof, and that every existing roof be replaced with
a green roof when it needs to be replaced. Given that roofs in the Washington area typically last 10-20
years, significant environmental improvements would be achieved in less than one generation.
Next Steps
The next steps are to communicate the findings of this study, achieve support for the proposed “20-20-20”
Vision, finalize objectives, and develop an implementation strategy in partnership with city and federal
agencies and stakeholders. Implementation of the Green Roof Vision for DC will require coordination and
integrated resource management amongst the outstanding planning initiatives underway in the District:
Establishment of the new DC Department of the Environment
Mayor’s Environmental Agenda
Mayor’s Anacostia Waterfront Initiative
Update of DC Comprehensive Plan
Water and Sewer Authority’s Long Term Control Plan (LTCP) to manage CSOs
Metropolitan Washington Council of Government’s State Implementation Plan to meet air
quality targets
Casey Trees Endowment Fund Page 13 of 15
Limno-Tech, Inc. 08/24/05Areas for Further Study Potential areas for further study to support District-wide implementation include: Hydrologic Modeling of Storm Water Benefits The storm water modeling presented in this paper provides a general understanding of the impacts of green roofs on storm water quantity and combined sewer overflows. More detailed and robust modeling is necessary to understand how green roofs can be used to minimize combined sewer overflows and influence the detailed design of the proposed storage tunnels as described in the WASA’s LTCP. Future modeling efforts would include building a detailed hydrologic and hydraulic (H&H) model using software such as the Danish Hydraulic Institute MOUSE program. This model was already used for the development of the city’s LTCP, and could be built upon to determine the effects of green roofs on storm water quantity and quality. The advantage of using a robust H&H model is the ability to calibrate and validate to real time conditions, and predicting the frequency, volume and duration of CSOs relative to long term rainfall records and the state or condition of the combined sewer system (such as existing conditions or future condition with various CSO controls). Green Build-out Model for DC As part of the master planning process, jurisdictions often create a build-out scenario to determine how future development will look if current plans and policies are carried out to the maximum extent. The process is helpful for evaluating various policies and growth scenarios. In a similar manner, creating a green build-out model for Washington DC, will quantify the benefits of trees and green roofs under different coverage scenarios. This data can then be used to guide the form of future development and optimize capital investment in municipal infrastructure. Heat Island Modeling Heat island modeling depends on an area’s climate, topography, and pattern of development. Because heat island simulations involve the creation of a mesoscale atmospheric simulation model, their use in estimating the impacts of green roofs on ambient air temperature has been limited. The few green roof heat island studies that have been completed have yielded promising results. Findings from an Environment Canada study of Toronto in 2002, indicate that relatively minimal green roof implementation, approximately 6% of the total available roof space, would reduce summer air temperatures in the city by 1-2oC (1.8-3.6 oF). Creating a heat island model for Washington DC would allow a prediction of the overall reduction in temperature, as well as the air quality benefits and energy savings resulting from decreased demand for air conditioning. Economic Cost/Benefit Analysis With green roof cover objectives and associated benefits quantified, cost estimates, cost benefit analyses, and implementation strategies for city-wide implementation can be developed. In addition to storm water and air quality benefits, other benefits of green roof cover can be quantified and considered for implementation to reflect the value of the multiple benefits provided. Casey Trees Endowment Fund Page 14 of 15 Limno-Tech, Inc. 08/24/05
Final Thoughts

There is an unprecedented convergence of planning initiatives and opportunities to develop and retrofit
the District of Columbia with green infrastructure.

This research quantifies the contribution made by green roofs to improve the City’s air and water, and is a
first step to determining the optimal balance of green and gray infrastructure to reduce capital investment,
provide other public and private benefits, and create a legacy for the capital of the United States as a
Model Green City.

Storm water and air quality benefits are only two of the many benefits green roofs and green
infrastructure provide. The value of green roofs should be evaluated in context with the other multiple
benefits.

1
  United States Census Bureau, 2000
2
   American Forests, Urban Ecosystems Analysis, 2000
3
  American Forests, Urban Ecosystems Analysis, 2000
4
  Metropolitan Washington Council of Governments, 2005
5
  Children’s Environmental Health Network, 2004
6
  DC Department of Health, 2004
7
  DC Office of Planning, 2005 (Development classified as under construction, planned 2-5 years, and
proposed/conceptual)
8
  National Institute of Standards and Technology and the National Science and Technology Council. Construction
industry statistics, 1995
9
  United States Department of Energy, Energy Efficiency and Renewable Energy Network (EREN). Center
of Excellence for Sustainable Development, 2003
10
   Green Roofs for Healthy Cities, 2005
11
   Green Roofs for Healthy Cities, 2005
12
   Casey Trees Endowment Fund, 2003
13
   Casey Trees Endowment Fund, 2003

Casey Trees Endowment Fund                                                                         Page 15 of 15
Limno-Tech, Inc.                                                                                       08/24/05
You can also read