TASMAN GROWTH PROJECTIONS 2021 2051 - TASMAN'S 10 YEAR PLAN 2021
←
→
Page content transcription
If your browser does not render page correctly, please read the page content below
TASMAN’S 10 YEAR PLAN 2021

TASMAN GROWTH PROJECTIONS 2021 – 2051
Summary of Council’s Growth Model as Supporting Information for
                the Long Term Plan 2021 – 2031
One of Council’s Strategic Priorities is “Enabling positive and sustainable
development”. Enabling development and infrastructure to provide homes for our
community is also one of the key topics in the Long Term Plan (LTP) 2021-2031
consultation document, Planting the Seeds for Tasman’s Future. The decisions we
make now, the seeds we plant, the things we choose to care for and nurture over the
next few years, will determine the shape of Tasman District in the future.
Council is required by legislation to ensure there is sufficient development capacity
to meet Tasman’s expected demand for residential and business land. Enabling
housing supply is one way to help address housing affordability issues.
Tasman District Council has developed a Growth Model to inform our plans to
provide for growth with sufficient infrastructure and zoned land in the right location
at the right time.
The Model is updated every three years as part of developing the LTP (LTP). This
summary is provided as supporting information for the LTP 2021-2031. It outlines
when and where Council expects new development, based on the LTP’s updated
population growth scenario and proposed infrastructure programme.

                                                                                         1
CONTENTS
EXECUTIVE SUMMARY ............................................................................................................................ 3
PLANNING FOR GROWTH ....................................................................................................................... 5
HOW THE GROWTH MODEL FITS INTO COUNCIL’S PLANNING .............................................................. 5
GROWTH MODEL DEFINITIONS .............................................................................................................. 6
DEMAND PROJECTIONS .......................................................................................................................... 8
Demand for new dwellings ................................................................................................................. 8
Population growth .............................................................................................................................. 8
Ageing population ............................................................................................................................. 10
Household size .................................................................................................................................. 11
Holiday homes and other dwellings for non-residents..................................................................... 12
Business land projections ................................................................................................................. 12
CAPACITY ESTIMATES............................................................................................................................ 12
ROLLOUT STRATEGY AND GROWTH MODEL OUTPUTS ........................................................................ 13
Residential Growth ........................................................................................................................... 13
Business Growth ............................................................................................................................... 14
CONSIDERATION OF OTHER SCENARIOS .............................................................................................. 16
Additional development capacity margins ....................................................................................... 17
QUALITY ASSURANCE ............................................................................................................................ 17
Appendix 1: The Growth Model Process .............................................................................................. 19
Appendix 2: Data for Demand Projections ........................................................................................... 20
Household size .................................................................................................................................. 20
Holiday homes and other dwellings for non-residents..................................................................... 20
Business land projections ................................................................................................................. 21
Appendix 3: Stats NZ Areas used to calculate baseline population for Growth Model Areas ............. 22
Appendix 4: Growth Model Areas by Ward .......................................................................................... 23
Appendix 5: Conversion of Business Demand forecasts to Growth Model Areas ................................ 23
2EXECUTIVE SUMMARY
The Long Term Plan (LTP) 2021 – 2031 assumes that Tasman District’s population is projected to
grow by almost 20,000 between 2021 and 2051. This is based on the medium scenario of updated
population projections for Tasman which Council commissioned in 20191. Council’s long-term
planning aims to determine how best to provide for this projected population growth, and the
associated growth in Tasman’s housing and business activity, with sufficient infrastructure and
zoned land in the right location at the right time.
Council has developed a Growth Model which provides 30-year demand and supply projections for
residential and business development for 20 discrete geographic areas. Every three years, the
Council updates its Growth Model, based on the LTP growth assumption, to predict future
residential and business development across the Tasman District for the following 30 years.
The key demographic assumptions affecting future demand are:
o ongoing population growth over the next 30 years, driven by net migration gains, with the
rate of growth slowing over time
o an ageing population, with population increases in residents aged 65 years and over
o a decline in average household size, mainly due to the ageing population, with an
increasing number of people at older ages who are more likely to live in one or two person
households.
The overall population of Tasman is expected to increase by 7,700 residents between 2021 and
2031, to reach 64,300 (assuming the medium scenario). Council is planning for 4,300 new dwellings
over the next ten years, and a further 7,500 dwellings between 2031 and 2051. Council has planned
for 160 new business properties (retail, commercial or industrial) over the next ten years, and a
further 335 new properties between 2031 and 2051.
The rollout (supply) in each Growth Model area is the number of new dwellings or business
properties we assume can and will be built. This is based on the demand projections, each area’s
feasible developable capacity (with any necessary servicing and zoning), and knowledge of
forthcoming development proposals and landowner intentions. If an area is unlikely to have enough
serviced development capacity to provide sufficient rollout to meet demand, this has been offset by
more rollout in other areas. The rollout numbers form the growth assumption for the LTP 2021-2031
and inform other models, including the calculation of Rates and Development Contributions.
Using the Growth Model, Council has assessed that there is sufficient developable residential land
capacity to provide enough new dwellings to at least meet demand for the District as a whole for the
30-year period. In terms of specific settlements, Council anticipates that Brightwater and Motueka
are unlikely to have sufficient development capacity for all or part of the next ten years. To offset
the undersupply in Brightwater and Motueka in Years 1-10, Council has assumed a higher rate of
development in Richmond in the short to medium term. A staged suite of infrastructure upgrades for
Brightwater will enable some development by Year 4 and will enable sufficient capacity from Year
10. To address the long-term (Years 11-30) undersupply of residential land in Motueka, Council is
planning for the development of a significant area of land in Lower Moutere, which was identified in
the Nelson Tasman Future Development Strategy (FDS).
1
Tasman District Projections 2018-2053 provided by Natalie Jackson Demographics Ltd, November 2019
3Council has planned for the supply of business land to at least meet demand throughout the District
for the next ten years.
Table 1: LTP Growth Assumption by Area, 2021 – 2031
Growth Model Area Population Change Number of New Business
2021-2031 New Dwellings Properties
Brightwater 263 131 4
Collingwood 10 13 2
Kaiteriteri 20 46
Māpua/Ruby Bay 620 317 7
Mārahau 37 32
Motueka 657 449 35
Moutere 1,162 569
Murchison 50 37 3
Pōhara/Ligar/Tata Bay 25 52 6
Richmond 3,671 1,781 81
Riwaka 5 13 1
St Arnaud 16 71 1
Tākaka 56 54 12
Tapawera 18 14 2
Wakefield 535 242 4
Ward Remainder Golden Bay 103 132
Ward Remainder Lakes Murchison 132 112
Ward Remainder Motueka 71 78
Ward Remainder Moutere Waimea 164 140
Ward Remainder Richmond 73 61
Total District 7,686 4,344 160
There is always a degree of uncertainty when making assumptions about the future, and the Covid-
19 pandemic has created even more uncertainty in the development of this LTP. The model was
based on the best information available at the time and is not intended to be an exact forecast of
when and where development will actually occur. While the Growth Model and Council’s planning
aims to ensure that the availability of serviced, zoned land is not a constraint on housing supply, the
actual supply of new dwellings for sale is largely determined by the private sector, including
landowners, financial institutions and the construction industry.
It is conventional to see the medium population growth scenario as indicating the most likely
scenario. However, the high and low scenarios also need to be considered for potential effects on
Council’s financial estimates, infrastructure needs, and zoning requirements. Council will continue to
monitor data on construction and population trends. The FDS will be updated in 2022 and the
Growth Model will be updated in 2023 to inform the next LTP. For now, based on the proposed
infrastructure programme in the LTP 2021-2031, the Growth Model indicates there would still be
sufficient serviced and zoned capacity District-wide for ten years under the high growth scenario.
4PLANNING FOR GROWTH
One of Council’s Strategic Priorities for the LTP 2021-2031 (LTP) is “Enabling positive and sustainable
development”. This aligns with the sustainable development approach required by the Local
Government Act 2002. Council must take into account the social, economic, environmental, and
cultural well-being of Tasman, and the reasonably foreseeable needs of future generations2. Council
is required by legislation to ensure there is sufficient development capacity to meet Tasman’s
expected demand for residential and business land3.
Enabling development and infrastructure to provide homes for our community is one of the key
topics for consultation on the LTP. Ensuring we have enough serviced and zoned land for housing
and business development will be a key focus for Council. We know that housing affordability is a
real issue for our residents, and also for those wanting to move to our beautiful region. Although
Council can’t solve the affordability problem alone, we can be part of the solution. In our LTP we are
planning to provide the infrastructure services required (including drinking water, wastewater,
stormwater, roads, footpaths, reserves and community facilities) to enable new subdivisions and
housing intensification to occur.
HOW THE GROWTH MODEL FITS INTO COUNCIL’S PLANNING
The Growth Model is a District-wide, long term development planning tool. The Model provides 30-
year projections of new residential dwellings and new business properties, for 15 settlements and 5
Ward remainder areas.
The latest update of the Growth Model has been guided by the Nelson Tasman Future Development
Strategy4 (FDS), which is a joint strategy between Tasman District Council and Nelson City Council.
The FDS is a high level strategy which identifies future growth areas for various types of housing and
business development, including intensification, expansion and rural residential.
The development scenario from the Growth Model sets the strategic direction for the Council’s
LTPning framework, to enable the Council to provide for growth with sufficient infrastructure and
zoned land in the right location at the right time.
The Growth Model outputs inform the LTP and the Resource Management Plan5, as well as
supporting documents such as Activity Management Plans, Financial and Infrastructure Strategies,
and the Development and Financial Contributions Policy.
2
Ss 3, 10 and 14, Local Government Act 2002
3
Ss 30 and 31 of the Resource Management Act 1991; National Policy Statement on Urban Development 2020
4
Future Development Strategy FDS | Tasman District Council, adopted by Council in July 2019.
5
The Tasman Resource Management Plan in currently being reviewed and will be known as the Tasman
Environment Plan
5GROWTH MODEL DEFINITIONS
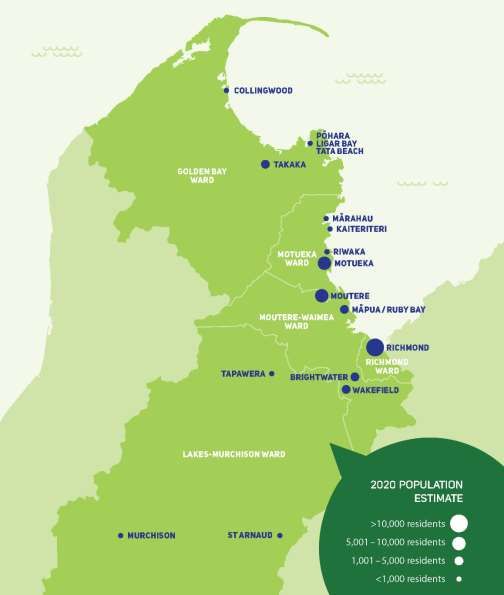
The Growth Model 2021 provides demand and supply projections for 20 discrete Growth Model
areas in the District (15 settlements and 5 Ward remainder areas). The 15 settlements are discrete
geographic areas where the majority of the District’s population is concentrated. The number of
residents in each settlement ranges from the largest towns of Richmond and Motueka, to smaller
communities such as St Arnaud, Collingwood and Mārahau. The five Ward remainder areas are the
rural areas outside of the 15 settlements, where approximately a quarter of Tasman’s population
reside.
The Model generates outputs for five time periods:
Pre-LTP Years (2019/2020 and 2020/2021)
Years 1-3 of LTP (2021/2022 - 2023/2024)
Years 4-10 (2024/2025 – 2030/2031)
Years 11-20 (2031/2032 – 2040/2041)
Years 21-30 (2041/2042 – 2020/2051).
6The commentary in this document focuses on Year 1 onwards, unless otherwise stated.
The key concepts of the Growth Model are the demand, capacity and rollout for future
development in each Growth Model area (settlements or Ward remainder areas).
•Demand is defined as the number of new dwellings or business properties
that are needed, based on the population projection scenario.
Demand
•Development capacity is the potential yield for new dwellings or business
properties on land which is likely to be developable, taking into account
Development hazard risk, terrain, existing buildings and land use, infrastructure availability,
Capacity zoning and density, and developer/landowner intentions.
•Rollout (supply) is the number of new dwellings or business properties we
assume can and will be built, based on future demand and development
Rollout capacity. The rollout numbers form the growth assumption for the LTP 2021-
(supply) 2031.
Refer to Appendix 1 for further details on the process for updating the Growth Model every 3 years.
The model was based on the best information available at the time and is not intended to be an
exact forecast of when and where development will actually occur. There are several factors which
are difficult to predict such as population migration patterns; economic activity; developer and
landowner decisions; and natural events. While the Growth Model and Council’s planning aim to
ensure that the availability of serviced, zoned land is not a constraint on housing supply, the actual
supply of new dwellings for sale is largely determined by the private sector, including landowners,
financial institutions and the construction industry.
7DEMAND PROJECTIONS
Updated population projections are used to calculate future demand for new residential dwellings
and business properties.
The key demographic assumptions affecting future demand are:
o ongoing population growth over the next 30 years, driven by net migration gains, with the
rate of growth slowing over time
o an ageing population, with population increases in residents aged 65 years and over
o a decline in average household size, mainly due to the ageing population with an increasing
number of people at older ages who are more likely to live in one or two person
households.
Demand for new dwellings
The Growth Model estimates each area’s future demand for residential dwellings based on three
components: population change, household size, and non-resident dwelling demand, e.g. holiday
homes.
Population growth
The overall population of Tasman is expected to increase by 7,700 residents between 2021 and
2031, from 56,600 to 64,300. Most of the overall population growth will be driven by net migration
gains (more people moving to Tasman District than leaving). The District will experience ongoing
population growth over the next 30 years but the rate of growth will slow over time.
In the absence of up-to-date Stats NZ population projections, Council engaged Natalie Jackson
Demographics Ltd (NJD)6 to provide District and Ward population and household projections,
incorporating Census 2018 data, with low, medium, high scenarios7. The projections were based on
Tasman’s long-term demographic trends (births and deaths) and observed migration trends for
2006-2018. After considering recent estimated population and dwelling growth rates, Council has
assumed the medium growth scenario for the LTP. This updated growth scenario is significantly
higher than the rate assumed in the LTP 2018-2028, which was based on the medium/high scenario
of Stats NZ projections based on the 2013 Census.
The following graph shows the three growth scenarios for Tasman’s population growth between
2018 and 2053. The graph also shows Stats NZ’s population estimates for 2003 to 2018. The three
population projections (low, medium, and high growth) incorporate different fertility, mortality, and
migration assumptions for Tasman. Further information on the population projections is available in
the report available on our website here.
6
Tasman District Projections 2018-2053 provided by Natalie Jackson Demographics Ltd, November 2019
7
Due to delays in Census 2018 data, Stats NZ population projections were not updated in time to inform the
Growth Model and the LTP.
8Tasman District Population Estimates and Projections
100000
90000
80000
70000
60000
50000
40000
2003 2008 2013 2018 2023 2028 2033 2038 2043 2048 2053
High Projection Scenario Medium Projection Scenario (LTP Assumption)
Low Projection Scenario Estimated Population
Figure 1: Estimated and projected population series, 2003 – 2053, Tasman District
Under the medium scenario, the Motueka, Moutere-Waimea and Richmond Wards are projected to
experience the greatest growth in population. The Golden Bay Ward population is projected to peak
in the 2030’s and then decline slightly, offsetting some of the growth in 2018-2028. The Lakes-
Murchison Ward population is projected to plateau around 2038. These projections reflect each
Ward’s age structure and its migration trends (net gains/losses) for different age groups.
Positive net migration is the major contributor to the District’s growth and increasingly offsets
natural decrease (more deaths than births). All Wards are expected to experience natural decrease
at some point during the projection period. The shift reflects Tasman’s ageing population, with high
proportions at older ages. This situation is projected for a large proportion of New Zealand’s local
authorities, around 40 per cent of which are projected to be experiencing natural decrease within
the next two decades.
The updated population projections from NJD were available by Ward, for five-year periods from
2018-2053. The Ward population projection by NJD were used to estimate population growth in
each Growth Model area, for each year set in the Model.
The population growth in each Growth Model areas was based on the following:
Establishing a baseline 2018 population for each area based on Stats NZ geographic
boundaries, Census 2018 data, Stats NZ population estimates as at June 2018, and Council
data on residential dwellings (See Appendix 3)
Allocating a share of each Ward’s population growth, taking into consideration demographic
trends, development trends (e.g. building consents), and future development capacity.
Population projections for each area have then been calculated based on the model’s growth and
development scenario. The population growth at the District level is consistent with the 30-year
projections provided by NJD, based on demographic trends. However, Council’s projections at the
9Ward level may differ slightly to NJD, based on our assumptions of the location and timing of new
residential dwellings.
Table 2: Summary of Population Projections
Growth Model Area Total Population (as at 30 June)
2019 2021 2031 2041 2051
Brightwater 2,294 2,391 2,654 2,975 3,307
Collingwood 270 273 283 274 247
Kaiteriteri 367 371 391 404 415
Māpua/Ruby Bay 2,657 2,779 3,399 4,005 4,500
Mārahau 142 149 186 212 177
Motueka 8,027 8,306 8,962 9,803 9,409
Moutere 5,682 5,908 7,069 8,936 11,386
Murchison 479 491 541 555 542
Pōhara/Ligar/Tata Bay 600 606 632 633 612
Richmond 15,169 15,606 19,277 21,388 23,255
Riwaka 617 620 625 597 575
St Arnaud 114 120 136 132 118
Tākaka 1,387 1,402 1,458 1,449 1,396
Tapawera 305 309 327 330 324
Wakefield 2,453 2,528 3,063 3,382 3,662
Ward Remainder Golden Bay 3,148 3,177 3,280 3,257 3,167
Ward Remainder Lakes Murchison 2,863 2,892 3,024 3,076 3,049
Ward Remainder Motueka 1,844 1,904 1,975 2,217 2,474
Ward Remainder Moutere Waimea 4,258 4,333 4,497 4,697 4,884
Ward Remainder Richmond 2,403 2,418 2,491 2,558 2,611
Total District 55,076 56,583 64,269 70,881 76,110
Ageing population
Under the medium scenario, all age groups in Tasman are projected to experience growth. However,
the highest growth continues to be in the 65+ age group, whose proportion is projected to increase
from 21% in 2018 to 34% in 2048. This increase, known as structural ageing, means that total
population growth rates are projected to slow down over time. Once a population has more than
20% aged 65 years and over, it is usually approaching the end of natural increase.
1030,000
25,000
20,000
Population
15,000
10,000
5,000
-
0-14 Years 15-39 Years 40-64 Years 65 Years and over
2008 2013 2018 2023 2028 2033 2038 2043 2048 2053
Figure 2: Estimated and projected population by age group, 2008-2053, Tasman District
In 2018, the proportion aged 65+ years ranged from 17.2 per cent for Lakes-Murchison Ward to 23.0
per cent for Motueka Ward. By 2048, these proportions are projected to be somewhat higher under
all projection scenarios, with Lakes-Murchison maintaining the youngest age structure throughout,
and the oldest being variously shared by Golden Bay Ward and Richmond Ward.
Table 3: Percentage of population aged 65+ years, by Ward, 2018-2048
Projected percentage aged 65+ years, medium scenario, by Ward
Ward 2018 2033 2048
Golden Bay 22.5 34.4 37.0
Lakes-Murchison 17.2 27.8 29.1
Motueka 23.0 29.2 31.6
Moutere-Waimea 18.0 29.4 34.0
Richmond 21.8 31.4 37.0
TASMAN 20.8 30.4 34.3
8
Refer to the full report from NJD for age group projections by Ward.
At this stage, projections by age group are only available by Ward and are used as a proxy for the
Growth Model areas within each Ward (see Appendix 4).
Household size
The ageing population is driving a change in the average household size, projected to decrease from
2.5 residents per household in 2018, to 2.4 in 2028 and 2.3 in 2038. The numbers of one-person
households and couple-without-children households are projected to increase. Refer to Appendix 2
for further details on household size projections in the Growth Model.
8
Tasman District Projections 2018-2053 provided by Natalie Jackson Demographics Ltd, November 2019
11Holiday homes and other dwellings for non-residents
The Growth Model also considers non-resident demand for holiday home properties or temporary
worker accommodation and assumes that each settlement will maintain the current proportion of
dwellings which are used for these purposes.
There is a significant proportion of holiday homes, and a corresponding increase in the population
during holiday seasons, in the following communities: St Arnaud (80%), Kaiteriteri (60%), Mārahau
(30%), and Pōhara/Ligar/Tata (50%).
Refer to Appendix 2 for further details on holiday home projections in the Growth Model.
Business land projections
Business growth is measured by the number of new retail, commercial and industrial properties.
Council assumes there will be continued growth in demand for business land. This is based on a 2016
business land forecasting model from consultants, Property Economics, using the medium growth
scenario for Tasman9 and Nelson10. The forecasting model incorporates national and regional
economic trends, employment projections, and employment-to-land ratios. Further details on the
business land projections are available in Appendix 2. Council is in the process of procuring an
updated business land forecasting model, which will inform the next LTP.
CAPACITY ESTIMATES
The amount of feasible developable capacity and the sequencing of rollout (supply) across the
District, for both residential and business development, are based on the following information and
assumptions:
recommendations from the FDS for future growth areas
an initial assessment of developability, taking into account land use factors such as hazard
risk, network services and settlement form
geo-spatial data on developable land area, including terrain and existing buildings
future zoning and density, including average lot size
excluding land required for other uses, such as infrastructure, roads, community facilities or
open space
building consents, subdivision consents and applications, and approved Special Housing
Areas
knowledge of forthcoming development proposals and landowner intentions
the location and timing of proposed infrastructure capital works programme in the LTP
2021-2031, including the Infrastructure Strategy.
The Growth Model assumes that zoning rules will be in place to enable the types of development
identified in the FDS.
9
Tasman District Projections 2018-2053 provided by Natalie Jackson Demographics Ltd, November 2019
10
Stats NZ Subnational Population Projections 2013(base)-2043 update (released 22 February 2017)
12ROLLOUT STRATEGY AND GROWTH MODEL OUTPUTS
Rollout (supply) is the number of new dwellings or business properties we assume can and will be
built, based on the demand projections and development capacity estimates. If a settlement is
unlikely to have enough development capacity to provide sufficient rollout to meet demand, this has
been offset by more rollout in other settlements which do have capacity. The rollout numbers form
the growth assumption for the LTP 2021-2031.
We have generally aimed for rollout to equal demand District-wide, and then by Ward and for most
individual settlements based on the following rollout and infrastructure strategy:
Enable development in Richmond and Māpua to meet their demand (Y1-30), with excess
capacity in Richmond enabled to provide for partial undersupply in Brightwater and
Motueka in Years 1 - 10.
Enable all Motueka’s development capacity (Y1-20), noting this only partly meets demand.
A staged suite of infrastructure upgrades for Brightwater over 30 years, enabling some
development by Year 4 and sufficient capacity enabled from Year 10.
Enable development in Moutere (Years 11-30) to address Motueka undersupply from
approximately 2038 (in the Lower Moutere Hills area identified in the FDS).
Golden Bay and Lake-Murchison generally have sufficient land supply to enable enough
new dwellings to meet demand, without requiring further Council growth-related
infrastructure.
By aiming for rollout to equal demand District-wide in Tasman, we have assumed that Nelson City
will provide adequately for growth with a sufficient supply of new residential dwellings and business
properties which is in line with recent population growth trends.
For Years 10-30, we estimate rollout based on an assumption that the new Resource Management
Plan (Tasman Environment Plan) rules will enable the types of development identified in the FDS,
and will stop development in hazard risk areas.
Residential Growth
Council has planned for 4,300 new dwellings over the next ten years, and a further 7,500 dwellings
between 2031 and 2051. As shown in Table 3, Council has identified sufficient capacity to enable
enough new dwellings to at least meet the demand (as forecast by the model) District wide. At the
individual area level, some settlements are providing for others, as outlined above.
Council anticipates that Brightwater and Motueka are unlikely to have sufficient development
capacity for all or part of the next ten years. Some development in Brightwater will be enabled by
Year 4, once the Waimea Community Dam and new pump station construction are complete,
enabling a sufficient water supply. Further infrastructure investment in Brighwater from Year 10 will
enable sufficient development capacity. Motueka’s development is constrained by a combination of
servicing and zoning. Council is planning sufficient infrastructure servicing in Years 1 to 20 to enable
development of all the residential land in Motueka, especially the western side of High St. However,
development in the other parts of Motueka will remain limited, due to natural hazard risks in the
east and a preference to avoid expansion into productive land on Motueka’s outskirts.
To offset the undersupply in Brightwater and Motueka in Years 1-10, Council has assumed a higher
rate of development in Richmond in the short to medium term. To address the long-term (Years 11-
30) undersupply of residential land in Motueka, Council is planning for the development of a
significant area of land in Lower Moutere. This area was identified in the FDS as Lower Moutere Hills,
13an expansion area for medium to low density development with potential yield of 1,360 dwellings
between 2039 – 2048.
Council has not planned to enable increased capacity in Riwaka as this land is flood prone. This does
not prevent new houses from being built in this area but it does signal that Council’s preference is
for this demand to be taken up elsewhere in the Motueka Ward area.
Table 4: Summary of Residential Demand and Rollout Projections
Growth Model Area Dwellings
Demand Rollout Demand Rollout
Years 1-10 (2021-2031) Years 11-30 (2032-2051)
Brightwater 210 131 358 360
Collingwood 13 13 2 2
Kaiteriteri 46 46 77 73
Māpua/Ruby Bay 314 317 628 628
Mārahau 32 32 60 29
Motueka 744 449 1,576 580
Moutere 569 569 1,130 2,130
Murchison 37 37 25 25
Pōhara/Ligar/Tata Bay 52 52 33 33
Richmond 1,170 1,781 2,345 2,339
Riwaka 17 13 33 -
St Arnaud 74 71 17 15
Tākaka 54 54 25 25
Tapawera 14 14 10 10
Wakefield 174 242 328 328
Ward Remainder Golden Bay 132 132 74 74
Ward Remainder Lakes Murchison 109 112 120 122
Ward Remainder Motueka 165 78 305 325
Ward Remainder Moutere Waimea 210 140 331 307
Ward Remainder Richmond 61 61 124 124
Total District 4,197 4,344 7,560 7,529
Business Growth
Business growth is measured in the number of new business properties (retail, commercial,
industrial). Council has planned for 160 new business properties over the next ten years, and a
further 353 new lots between 2031 and 2051.
Council has planned for rollout to at least meet demand throughout the District for the next ten
years. Rollout (supply) estimates are based on an assessment of each settlement’s feasible
developable capacity and knowledge of forthcoming development proposals and landowner
intentions.
14Table 5: Summary of Business Demand and Rollout Projections
Business Properties
Demand Rollout Demand Rollout
Settlement Years 1-10 Years 11-30
Brightwater 4 4 9 9
Collingwood 2 2 2 2
Māpua/Ruby Bay 7 7 12 12
Motueka 35 37 68 74
Murchison 3 3 4 4
Pōhara/Ligar/Tata Bay 6 6 10 10
Richmond 81 81 205 205
Riwaka 3 1 6 -
St Arnaud 1 1 2 2
Tākaka 12 12 23 6
Tapawera 2 2 4 2
Wakefield 4 4 8 9
160 160 353 335
While there is generally sufficient business land to meet future demand District wide, further work is
planned to assess the demand and capacity beyond Year 10 for the specific types of business land
(retail, commercial, industrial). Council is in the process of procuring an updated business land
forecasting model. However, based on current data, there appears to be a potential shortfall after
Year 10 of retail/commercial business land in Brightwater and Wakefield, offset by a surplus of land
zoned for industrial use. Council has also identified a potential shortfall of all types of business land
in Tākaka from around Year 15. Council will investigate the provision of further business land in the
review of the FDS and new zoning when developing the Tasman Environment Plan.
Council has not planned to enable increased capacity in Riwaka as this land is flood prone. Council
assumes the future shortfall in business land in Riwaka will be offset by extra development in
Motueka.
The Growth Model has assumed some of the projected demand for business land can be met from
undeveloped land for existing vacant or underused business properties, but has not accounted for
potential capacity from vacant commercial or industrial buildings. This means actual capacity is likely
to be higher in reality and the shortfall is likely to lower, compared with the model’s estimates.
15CONSIDERATION OF OTHER SCENARIOS
The model was based on the best information available at the time and is not intended to be an
exact forecast of when and where development will actually occur. There is always a degree of
uncertainty when making assumptions about the future. There are several factors which are difficult
to predict such as population migration (either to/from overseas or within New Zealand); the
proportion of dwellings used as holiday houses; developer and landowner activity; and natural
events. Positive net migration is the major contributor to the District’s population growth and could
be affected by housing supply, house prices and incomes in other regions and countries.
The Covid-19 pandemic has created even more uncertainty in the development of this LTP.
Migration patterns could be affected by international border restrictions or an increase in the
number of returning New Zealanders.
Natalie Jackson Demographics Ltd provided three sets of projections, ‘high’, ‘medium’ and ‘low’, and
noted “changing economic, political and social circumstances can have an impact on the underlying
assumptions regarding births, deaths, and especially migration, and cause trends to fluctuate
between the upper and lower bounds.”
It is conventional to see the medium scenario as indicating the most likely scenario. However, the
high and low scenarios also need to be considered for potential effects on Council’s financial
estimates, infrastructure needs, and zoning requirements.
If population growth is higher than assumed, debt incurred by Council to fund the growth related
portion of infrastructure will be repaid more quickly than assumed through the collection of
Development Contributions. However, higher growth than planned could also result in an
insufficient amount of serviced land (including infrastructure) for development and a potential
worsening of housing affordability. Council may be required to undertake further plan changes to
the Tasman Resource Management Plan or Tasman Environment Plan, and/or increase its
investment in infrastructure to make more land for development available. For now, the Growth
Model is indicating there is sufficient serviced and zoned capacity to meet demand under the
medium scenario for 30 years and under the high growth scenario for at least ten years.
If population growth is lower than assumed it may take longer for Development Contributions to pay
off debt incurred to fund growth related infrastructure. Council may need to revise its capital works
programme for growth related infrastructure. The forecast increases in rates and development
contributions may be smaller than anticipated.
Council acknowledges that there is unmet latent, or residual, demand in some parts of the District.
While the Growth Model doesn’t quantify or include this in future demand projections, it reinforces
why Council needs to plan for growth, ensure sufficient developable land capacity with extra
capacity margins, and consider a higher growth scenario.
Council will continue to monitor data on construction and population trends. The FDS will be
reviewed in 2021/2022 and the Growth Model will be updated in 2023 to inform the next LTP (2024
– 2034).
16Additional development capacity margins
The National Policy Statement on Urban Development (NPS-UD) also requires Council to provide an
additional margin of feasible development capacity in urban areas which is 20% above the projected
demand for the next ten years, and 15% above the demand projected for 2031 – 2051.
Under the NPS-UD, Nelson and Tasman is a tier 2 Urban Environment. The two Councils have agreed
that the urban environment for Nelson and Tasman comprises Richmond (including Hope),
Brightwater, Wakefield, Māpua and Motueka – in Tasman, and in Nelson: the city itself and all
suburbs, extending to Hira and Cable Bay.
An assessment of the development capacity in the urban environment of Tasman indicates that we
will meet the NPS-UD’s requirement for the additional margin of feasible development capacity.
QUALITY ASSURANCE
This is the sixth iteration of the Growth Model and the model is continuously reviewed and
improved.
Before the latest update of the Growth Model, Council engaged Utility Limited to conduct a peer
review and to identify potential improvements. The most significant changes to the Model were:
Consistent definitions and interpretation of Demand and Rollout outputs of the Growth
Model, to meet the requirements of the Ratings Model and Development Contributions
Model.
Use of a top-down approach to population projections by Growth Model area, based on
demographics, development trends and developable capacity.
Estimates of household size change for each Growth Model area use percentage change,
rather than an absolute decrease.
Review of Growth Model area boundaries to more closely align with new Stats NZ
boundaries and with FDS growth areas.
Use of consistent conversion rates for business land, from hectares to lots, for demand and
rollout.
There is an internal quality assurance process of the pre-work calculations and inputs, including the
population, household size, and business land projections by Growth Model area.
The inputs and outputs of the Growth Model have also been checked against recent trends in
population and dwelling growth, and against Stats NZ projections.
In recent years, Tasman has experienced relatively high rates of population growth. The average
annual population increase over the three years to June 2020 was 2.0% per annum, while the annual
average over the last ten years was 1.6% (which included an increase in 2011 following the
Canterbury earthquakes).
The Growth Model projects annual population growth of 1.3% for 2021-2031, based on the medium
growth scenario. In the report on Tasman’s population projections11, it was noted that the
projections result in relatively modest annual average growth rates when compared with recent
years, but advised against assuming growth would continue at a high level unabated. It was also
11
Report, page 20
17noted that the projections already assumed relatively high net migration compared with previous
Stats NZ projections, and growth rates are also likely to decline over time as structural ageing
increases. The rates for the medium scenario aligned well with the average growth over 2006 –
2018.
In recent years, Tasman has also experienced increasing numbers of consented new dwellings. The
average annual increase in the three years to June 2020 was for 419 new dwellings. The average
over the last ten years was 340 new dwellings a year.
The Growth Model projects an average of 451 new dwellings a year for Years 1-3 (2021 – 2024),
dropping to 427 a year for 2024 – 2031.
As with population growth, dwelling demand is projected to slow down over time.
Annual number of new dwellings
Consented for 2016-2020
491
500
406 395
369 381
400
300
200
100
0
2016 2017 2018 2019 2020
Year ended June
Figure 3: Annual number of new dwellings consented, 2016-2020, Tasman District
Average annual number of new dwellings
Projected for 2021-2051
500 451
427 416
400
337
300
200
100
0
Years 1-3 Years 4-10 Years 11-20 Years 21-30
Figure 4: Annual average number of new dwellings projected, 2021-2051, Tasman District
18Appendix 1: The Growth Model Process
Every three years, the Council updates its Growth Model to predict future residential and business
development across the Tasman District for the following 30 years.
Updated population projections are used to calculate future demand for new residential dwellings
and business properties.
Each update of the Growth Model involves three rounds of staff workshops involving a multi-
disciplinary team, including engineers, planners and resource scientists. Development capacity and
rollout is calculated for Growth Model areas by splitting the area into smaller sections, known as
Development Areas (DA). The boundaries of Growth Model areas and DA’s have been reviewed to
align with the FDS, which has identified growth areas (e.g. intensification, expansion).
Round Three:
Round One: Round Two: How much
What land is What is the potential
development is likely
developable? yield/capacity?
and where will it be?
In the first round of workshops, each DA is assessed for developability, taking into account land use
constraints and opportunities such as infrastructure availability and zoning. Preference is given to
land which minimises hazard risks and avoids productive land.
In the second round of workshops, the potential yield of each DA is calculated in terms of existing
vacant lots and potential new lots. Council’s GIS team provide spatial data on the total developable
area and staff estimate the following variables for each DA:
average lot size once developed
the proportion needed for roads, other infrastructure, greenspace, and community buildings
the extent that a DA’s terrain will affect its potential for development
the proportion of properties which are realistically likely to subdivide or redevelop over the
next 30 years.
In the third round of workshops, staff estimate the location and timing of new development (rollout)
for 2021-2051, in line with the population growth scenario (demand).
This is based on the:
potential yield of each DA (from Round 2)
availability of infrastructure
current zoning or potential rezoning
past development trends
current or planned subdivisions
developer or landowner intentions.
The development rollout has also been guided by the FDS which identifies growth areas (e.g.
intensification, expansion).
Following the workshops there is a reconciliation process to ensure there is sufficient rollout to meet
the total projected demand for Tasman. If a settlement is unlikely to have enough rollout to meet
demand, this has been offset by more rollout in other settlements which have capacity.
19Appendix 2: Data for Demand Projections
Household size
Initial values for each Growth Model area were based on Census 201312 data on the average number
of residents in occupied dwellings, for relevant Statistical Areas (SA2) or Area Units. Household size
projections for Tasman show a declining trend and it is assumed that all Growth Model areas
experience a decline at the same rate, based on Stats NZ and NJD household size projections.
Table 6: Household Size Projections by Growth Model Areas
Growth Model Area 2021 2031 2041 2051
Brightwater 2.73 2.62 2.5 2.42
Collingwood 2.18 2.09 2 1.94
Kaiteriteri 2.2 2.11 2.02 1.95
Māpua/Ruby Bay 2.42 2.32 2.22 2.15
Mārahau 2.2 2.11 2.02 1.95
Motueka 2.41 2.31 2.21 2.14
Moutere 2.59 2.48 2.38 2.3
Murchison 2.02 1.94 1.85 1.79
Pōhara/Ligar/Tata Bay 2.25 2.16 2.06 2
Richmond 2.57 2.46 2.35 2.28
Riwaka 2.4 2.3 2.2 2.13
St Arnaud 2.13 2.04 1.95 1.89
Tākaka 2.26 2.16 2.07 2
Tapawera 2.41 2.31 2.21 2.14
Wakefield 2.84 2.72 2.6 2.51
Ward Remainder Golden Bay 2.18 2.09 2 1.94
Ward Remainder Lakes Murchison 2.35 2.25 2.15 2.08
Ward Remainder Motueka 2.37 2.27 2.17 2.1
Ward Remainder Moutere Waimea 2.64 2.52 2.41 2.34
Ward Remainder Richmond 2.83 2.72 2.6 2.51
Holiday homes and other dwellings for non-residents
The proportion of holiday homes in each area is estimated using Council’s dwellings counts dataset.
This dataset was initially based on dwelling numbers from Council’s rating database for a previous
iteration of the Growth Model. The rating database was not designed to provide this information
and therefore it is a source of uncertainty through limited accuracy. However, the dataset has been
12
This was consistent with the approach taken by Natalie Jackson Demographics Ltd, who noted that lower
quality occupancy data for Census 2018 was producing anomalous results.
20progressively updated using building consents for new dwellings and estimates the base year count
of dwellings for each area.
Subtracted from that count is the estimated number of dwellings occupied by residents, based on
estimated resident population and household size. The remaining number of dwellings provides the
proportion of dwellings for non-residents, which the Growth Model assumes to be constant in future
years.
Business land projections
Demand for business land has been modelled using the medium growth scenario for Tasman13 and
Nelson14. The Nelson-Tasman business land forecasting model, provided in 2016 by Property
Economics, estimates future land requirements for three different types of business land (industrial,
office, retail). The model incorporates national and regional economic and demographic trends,
employment projections, and employment to land ratios. The land requirements assume that
development will be ‘at grade’, i.e. single storey.
The model considers the wider economic catchment and retail network of both Nelson and Tasman,
and assumes the geographic distribution of the existing retail network in the commercial centre
hierarchy across both regions is maintained.
The Property Economics estimates future land requirements in five-year periods to 2038 and this has
been extrapolated to 2053 assuming the same growth rates as the 2033 – 2038 year set.
The Property Economics model produces projected demand for business land in hectares while the
Growth Model requires demand to be expressed as the number of lots. The projections are
converted from hectares to lots using an average lot size, by type, by Growth Model area. The
average lot sizes are based on a field survey conducted over summer 2018/2019, of developed,
zoned business land lots.
The business land projections for each Growth Model area15 are based on the distribution of zoned
land across the District. However, the Property Economics Model report noted that, under the zoned
distribution scenario, Brightwater has an elevated industrial land demand due to the Carter Holt
Harvey Mill being zoned industrial. This is a ‘one off’ anomaly and the estimated land requirements
for Brightwater are more appropriately added to Richmond’s future requirements (the adjacent
town with significantly more growth). The future demand for industrial land in Brightwater has been
assumed to be the same as Wakefield, as the two areas have similar population, location and
settlement form.
Council is in the process of procuring an updated business land forecasting model, which will inform
the next LTP.
13
Tasman District Projections 2018-2053 provided by Natalie Jackson Demographics Ltd, November 2019
14
Stats NZ Subnational Population Projections 2013(base)-2043 update (released 22 February 2017)
15
Refer to Appendix 5 for the conversion of the Property Economics model projections to Growth Model
areas.
21Appendix 3: Stats NZ Areas used to calculate baseline population for
Growth Model Areas
Deriving the population growth for each Growth Model area requires a baseline population. The
baseline 2018 population for each area is based on Stats NZ geographic boundaries, Census 2018
data, Stats NZ population estimates as at June 2018, and Council data on residential dwellings.
This table identifies which Stats NZ geographic areas are used to establish the baseline population
for each Growth Model area.
* The boundaries for Growth Model areas marked with an asterix do not perfectly align with Stats
NZ boundaries. Therefore, the Stats NZ population for these areas has been adjusted using the ratio
between Census dwelling counts for the relevant Stats NZ area and Council’s GIS dwelling count data
for the Growth Model area.
Table 7: Stats NZ areas used to calculate Growth Model areas population
Growth Model Area Stats NZ Geographic Area for baseline population
(Statistical Area 2 (SA2) or Urban-Rural Area)
Brightwater Brightwater SA2
Collingwood Collingwood Rural Settlement
Kaiteriteri Kaiteriteri Rural Settlement
Māpua/Ruby Bay* Ruby-Mapua SA2
Mārahau* Marahau Rural Settlement
Motueka* Motueka North SA2, Motueka East SA2, Motueka West SA2
Moutere* Lower Moutere SA2 and Moutere Hills SA2
Murchison Murchison Rural Settlement
Pōhara/Ligar Bay/Tata Beach* Pohara and Ligar Bay Rural Settlements
Richmond Richmond West SA2, Richmond Central SA2, Ben Cooper
Park SA2, Wilkes Park SA2, Templemore SA2, Easby Park
SA2, Fairose SA2
Riwaka* Riwaka Rural Settlement
St Arnaud St Arnaud Rural Settlement
Tākaka Takaka SA2
Tapawera* Tapawera Rural Settlement
Wakefield* Wakefield SA2
Ward Remainders Ward Areas, less the population in relevant settlements
22Appendix 4: Growth Model Areas by Ward
This table shows which Growth Model areas belong to each Ward.
Ward Growth Model Areas
Golden Bay Tākaka, Pōhara/Ligar Bay/Tata Beach, Collingwood, Ward Remainder
Lakes-Murchison Murchison, Tapawera, St Arnaud, Ward Remainder
Motueka Motueka, Moutere (part), Riwaka, Kaiteriteri, Mārahau, Ward Remainder
Moutere-Waimea Moutere (part), Māpua/Ruby Bay, Brightwater, Wakefield, Ward
Remainder
Richmond Richmond, Ward Remainder
The Moutere area is assumed have 60% of its baseline population in the Moutere-Waimea Ward,
and 40% in the Motueka Ward. However, for the first ten years of the LTP, the majority of growth in
Moutere will be in the Moutere-Waimea Ward portion. In later years (Years 21-30), with
development planned in the Lower Moutere Hills area identified in the FDS, the majority of
Moutere’s development will be in the Motueka Ward portion.
Appendix 5: Conversion of Business Demand forecasts to Growth
Model Areas
The Property Economics model projections are for larger geographic areas than some Growth Model
areas. For those areas that do not align, the Property Economics projections have been apportioned
to the Growth Model areas based on population share. For Richmond/Māpua, we have assumed a
greater share will be in Richmond, due to the relatively higher share of zoned business land.
Property Economics Model Area Growth Model Areas
Tākaka Tākaka, Pōhara/Ligar Bay/Tata Beach
Richmond Richmond, Māpua/Ruby Bay
Motueka Motueka, Riwaka
23You can also read