Review of Demographics and Land Use - INTRODUCTION - Howard ...
←
→
Page content transcription
If your browser does not render page correctly, please read the page content below
Chapter 2: Demographics and Land Use Chapter 2 Review of Demographics and Land Use INTRODUCTION Chapter 2 presents and analyzes demographic data and land use to assess the need for transit in the Central Maryland region, including the area served by the Regional Transit Agency (RTA) of Central Maryland. It includes an analysis of population and demographic data, and analysis of land use and travel patterns that provide a context for evaluating the existing transit network. It includes a general population profile, identification and evaluation of underserved population subgroups, and a review of the demographic characteristics pertinent to a Title VI analysis. Data sources include the U.S. Census Bureau and American Community Survey (ACS) estimates. This chapter also presents a land use profile based on the major trip generators and commuting patterns in Anne Arundel County, Howard County, and the portions of Northern Prince George’s County served by the RTA. This information will inform the evaluation of the current transit network and guide the development of service alternatives and subsequent plan recommendations. This chapter is divided into the following two sections. Population Profile Community and Land Use POPULATION PROFILE This section provides an analysis of current and future population trends for the Central Maryland region, as well as an analysis of the demographics of population groups that often depend on transportation options beyond an automobile. Population Trends, 1990-2015 Table 2‐1 presents information on population trends for the state of Maryland and the Central Maryland region for the period from 1990 to 2015. During the 25‐year period, the state, region, and county all experienced population growth. The region as a whole experienced a population growth of over 40 percent for this period, led by a 62 percent growth in Howard County’s population. The City of Laurel and Anne Arundel County (less the City of Annapolis) also exceeded statewide growth rates with population increases over 30 percent, compared to the statewide figure of 24 percent. Of note is that this combined regional population (846,403) exceeds that of the City of Baltimore (621,849 in 2015) and is close to the overall Central Maryland 2-1 Transit Development Plan
Chapter 2: Demographics and Land Use

population of Prince George’s County (909,535 in 2015—some of which is included in the
Central Maryland estimate).

Table 2‐1: Historic and Current Population, 1990‐2015

                                                      Population                          Population Percent Change
 Place
                                                                                          1990 ‐   2000 ‐       1990‐
                                     1990          2000         2010          2015
                                                                                           2000     2010        2015
 Maryland                          4,781,468 5,296,486 5,773,552 5,930,538                10.8%     9.0%        24.0%
                    1
 Central Maryland                   601,557      721,620      811,462       846,403       20.0%    12.5%        40.7%
                        2
 Anne Arundel County                394,591      453,818      499,262       516,439       15.0%    10.0%        30.9%
 Howard County                      187,328      247,842      287,085       304,115       32.3%    15.8%        62.3%
 Prince George's County
                                    19,638        19,960       25,115        25,849        1.6%    25.8%        31.6%
 (Laurel)3
Source: U.S. Census Bureau 1990, 2000 & 2010, and 2015 American Community Survey 5‐Year Estimates
Notes:
    1. Includes Anne Arundel County, minus Annapolis + Howard County + only Laurel of Prince George’s County.
    2. The City of Annapolis is excluded from the population.
    3. Only includes the City of Laurel.

Population Forecasts, 2025-2045
The Maryland Department of Planning, Projections and State Data Center prepare county
population projections for the state in 10‐year increments. Currently forecasts are available
through the year 2045, and these are presented in Table 2‐2. Because these are county‐level
estimates it is not possible to separate the area of Prince George’s County served by the RTA,
or the City of Annapolis from Anne Arundel County. However, the basic picture presented by
the county‐level data is that the population growth will continue for the region, but at a much
slower pace as can be seen in Figure 2‐1 which shows the trend line.

Table 2‐2: Future Population Projections, 2025‐2045

                                 2025 Population          2035 Population      2045 Population
 Place
                                   Projection               Projection           Projection
 Maryland                           6,336,500                6,676,900            6,968,700
 Central Maryland
 Anne Arundel County                  584,400                608,950                  637,900
 Howard County                        355,700                369,500                  372,350
 Prince George's County               938,000                967,850                  995,900
Source: Maryland Department of Planning, Projections and State Data Center, 2017

Central Maryland                                      2-2
Transit Development Plan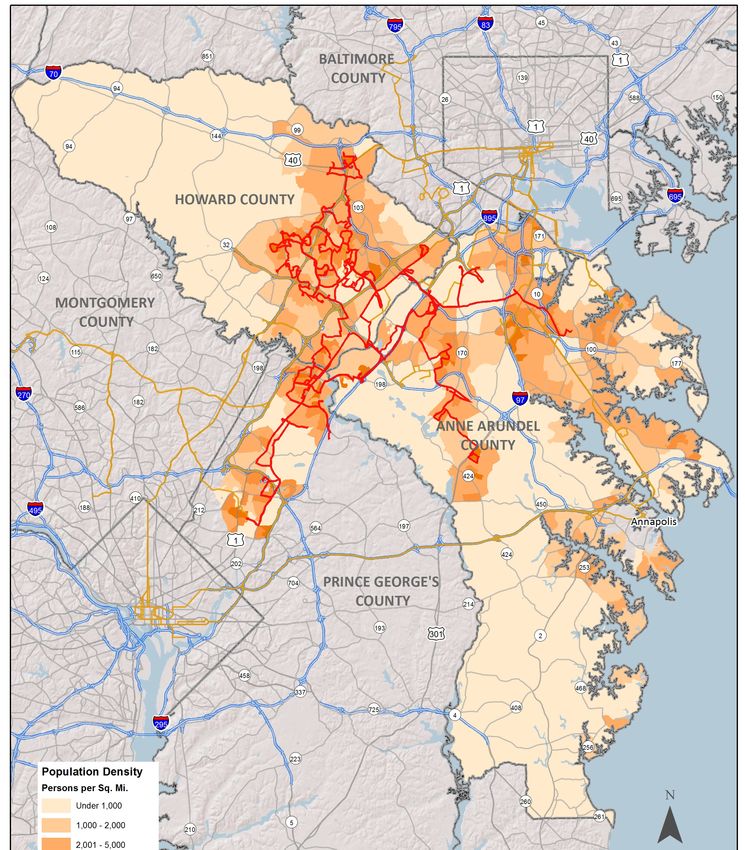
Chapter 2: Demographics and Land Use

Figure 2‐1: Historical and Projected Population, 1990‐2045

               2,200,000

               2,000,000

               1,800,000
  Population

               1,600,000

               1,400,000

               1,200,000

               1,000,000
                           1990     2010         2010          2015         2025         2035         2045
                                                               Year

                                             Population         Trendline

Note: Population projections (2025, 2035, & 2045) are on available at the countywide level. The above numbers include
countywide population for Anne Arundel, Howard, and Prince George’s Counties.

Demographic Change—Aging Population
In addition to overall population growth, another factor which will affect the need for public
transportation is the aging of the baby boomer generation in the Central Maryland region.
Table 2‐3 presents projections from the Maryland Department of Aging indicating that over
the period 2010‐2040 the population of persons 60 and above will increase 50.4 percent in
Anne Arundel County, 82.34 percent in Howard County, and 68.3 percent in Prince George’s
County. The growth in this age group peaks by 2030 and then begins to decline.

While a significant number of persons continue to drive as they age, the percentage of non‐
drivers increases as a cohort ages, increasing the need and demand for public transportation
to maintain mobility. Both Howard and Anne Arundel County have programs to provide
demand‐responsive transportation to seniors, age 55 and above in Anne Arundel, and 60 and
above in Howard County. The implication is that these services will face calls to expand, and
there will be a need to implement and maintain quality fixed‐route services and provide travel
training to those who do not know how to use public transportation.

Central Maryland                                        2-3
Transit Development Plan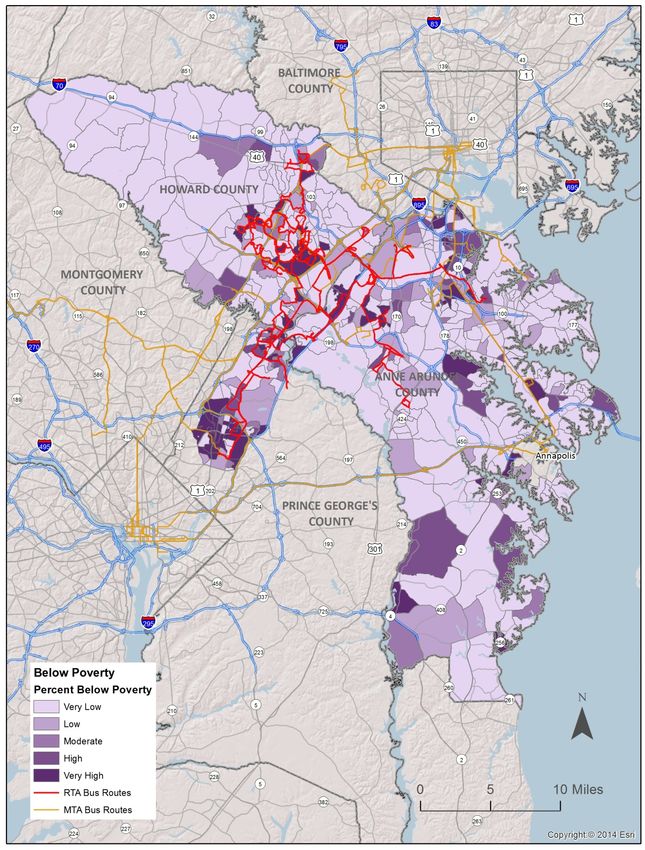
Chapter 2: Demographics and Land Use

Table 2‐3: Central Maryland 60+ Population Projections by Jurisdiction

                                                                                Percent Change
Jurisdiction                 2010         2020         2030          2040         2010‐20140
Anne Arundel County            92,695      120,290     142,972       139,412        50.4%
Howard County                  44,750       65,120      82,140        81,599        82.3%
Prince George's County       137,473       192,853     233,444       231,367        68.3%
Regional Total               274,918       378,263     458,556       452,378        64.6%
State of Maryland           1,058,253     1,439,791   1,717,931     1,701,414       60.8%

Population Density

The population of the region is not spread uniformly across this large area, but is
concentrated in a number of population centers that have developed around historic
communities, transportation facilities, or as a result of planned development. Figure 2‐2
presents a map of the region showing the population density in terms of per persons per
square mile.

As can be seen in the population density map, the Central Maryland region has a greater
population density in Eastern Howard County and in Western and Northern Anne Arundel
County. Portions of Anne Arundel County on the peninsulas extending into the Chesapeake
Bay also have higher population densities. Western Howard County and Southern Anne
Arundel County are both rural in nature by policy, as the counties have adopted land‐use
plans that preserve low density and limit development. Much of the region has developed
with typical suburban land use patterns with relatively low residential density, though there
are areas with concentrations of multi‐family and townhouse development.

Population density is often an effective indicator of the types of public transit services that are
most feasible within a study area. While exceptions exist, an area with a density of 2,000
persons per square mile will generally be able to sustain frequent, daily fixed route transit
service. Conversely, an area with a population density below 2,000 persons per square mile
may be better suited for deviated fixed route, flex schedule, or dial‐a‐ride service. As can be
seen in the map, the existing transit network generally provides service in or between the
areas with supportive residential density.

Central Maryland                               2-4
Transit Development Plan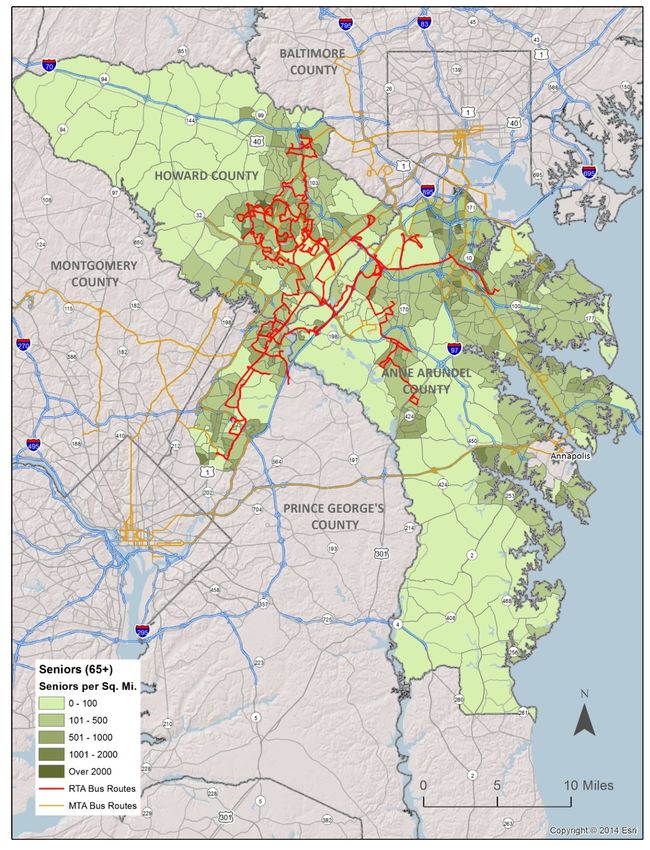
Chapter 2: Demographics and Land Use

Figure 2‐2: Population Density

Figure 2‐3: Employment Density

American Community Survey (ACS) 5 Year Sample – 2011 to 2015

Central Maryland                                               2-5
Transit Development Plan
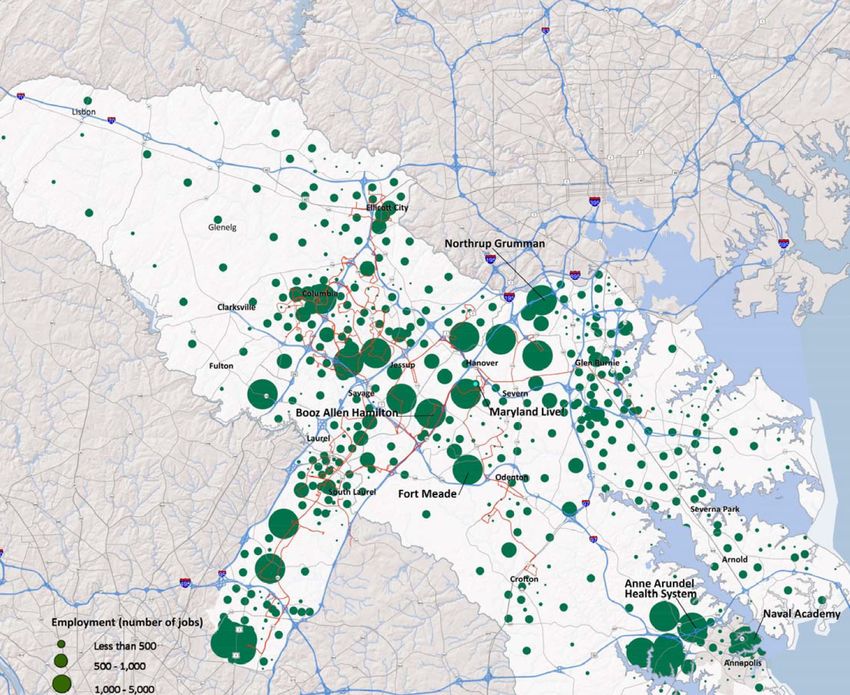
Chapter 2: Demographics and Land Use

Employment Density

Figure 2‐3 presents employment densities for the region, again with the transit network as an
overlay. As can be seen employment is more concentrated, but in a number of areas that
represent key destinations for transit services. These include the Columbia area, Ellicott City,
Elkridge, Jessup, Laurel, College Park, Arundel Mills, Glen Burnie, and Annapolis. Several
other major employment centers do not appear on the density map as having a high density,
because the employment is spread out over large areas—Baltimore‐Washington Thurgood
Marshall Airport (BWI), Fort Meade and the National Security Agency (NSA).

Figure 2‐4 presents a map with the location of jobs in the region, showing the number of jobs
by location, rather than the density of employment. As expected, jobs are concentrated along
the I‐95/U.S.1/295 corridor, with major concentrations in Columbia, North Laurel, the
Gateway, Guilford and Jessup areas of Howard County; in Brooklyn Park/North Linthicum,
BWI, Arundel Mills, National Business Park/Fort Meade, Parole and Annapolis.

Central Maryland                             2-6
Transit Development Plan
Chapter 2: Demographics and Land Use

Figure 2‐3: Employment Density: Jobs Per Square Mile

 American Community Survey (ACS) 5 Year Sample – 2011 to 2015

Central Maryland                                                2-7
Transit Development Plan
Chapter 2: Demographics and Land Use

Figure 2‐4: Central Maryland Employment—Number of Jobs

Central Maryland                    2-8
Transit Development Plan
Chapter 2: Demographics and Land Use
Transit Dependent Populations
Public transportation need may be determined by identifying the relative sizes and locations
of transit dependent populations. Transit dependent populations may include individuals
who do not have access to a personal vehicle or who are unable to drive themselves due to age
restrictions or disability. The analyses of transit dependent population uses data from the
American Community Survey five‐year estimates (2010‐2014) and presented by Census block
group. Determining the location of these populations assists in the evaluation of current
transit services and the extent to which services meet community needs.
Transit Dependent Index (TDI)
The Transit Dependence Index (TDI) is an aggregate measure that utilizes recent data from
the American Community Survey (ACS) 5‐Year Estimates and the United States Decennial
Census to display relative concentrations of transit dependent populations. Five factors make
up the TDI calculation:
Population density per square mile,
Zero vehicle households,
Elderly population,
Youth population, and
Below poverty population.
For each factor, individual block groups were classified according to the prevalence of the
vulnerable population relative to the study area average. The factors were then combined to
create an overall index depicting the relative transit dependence of each block group (low,
elevated, moderate, high, or very high)—as compared to the average values of the study area.
The classifications are determined by comparing transit dependent populations of each block
group to the average for the entire study area. A block group classified as “low” may still have
a significant transit dependent population, since classifications are relative; a block group
with a “low” classification may have as high as the area average transit dependent population.
Classifications are defined in Table 2‐4.
Central Maryland 2-9
Transit Development Plan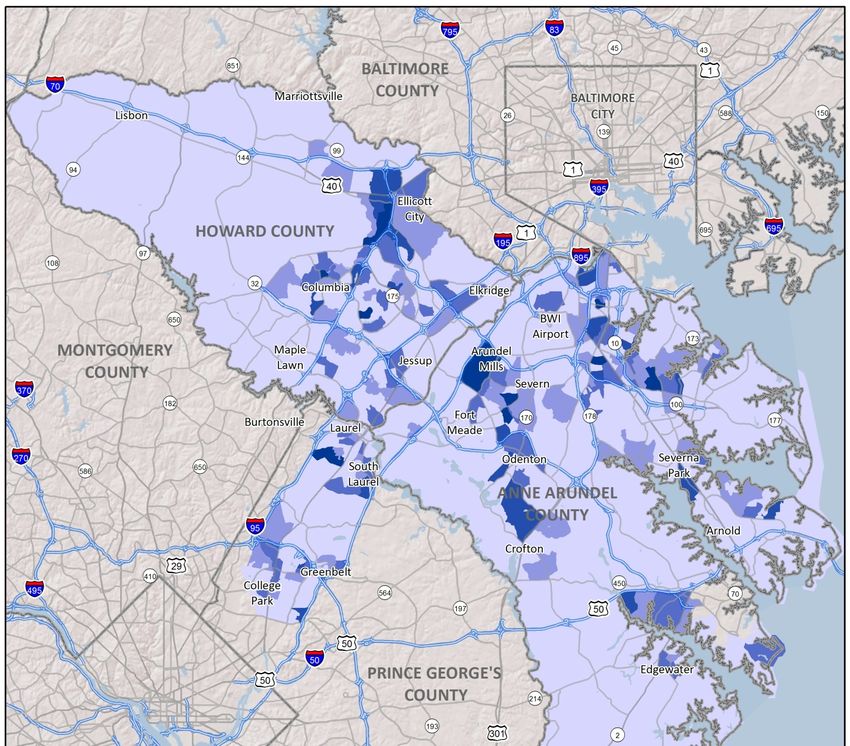
Chapter 2: Demographics and Land Use

Table 2‐4: Transit Dependent Index Classifications

 Number of Persons or Households                                                           Class
 Less than or equal to the study area average                                               Low
 Greater than the study area average and up to 1.33 times the average                     Elevated
 Greater than 1.33 times the average and up to 1.67 times the average                    Moderate
 Greater than 1.67 times the average and up to two times the average                        High
 Greater than two times the study area average                                            Very high

From a transit perspective, the TDI illustrates the areas of greatest overall need. While some
block groups show low need, they may include major destinations that should be served by
transit. It should be noted that because of the different factors considered, it is possible that a
given Census tract could be identified as having a high transit need or dependence based on
having a high proportion of seniors—who might well have higher incomes and higher auto
ownership, with relatively little need for transit services. Or a given tract may have a high
youth population that results in a ranking of high need—but again with higher incomes and
auto ownership it may have a lower need for transit. The impact of these factors is more
evident in the analysis of the individual factors that make up the overall index. The individual
factors are presented later in this chapter.

As illustrated in Figure 2‐5, the relative classification system utilizes averages in ranking
populations. For example, areas with less than average transit dependent population fall into
the low classification, and areas that are more than twice the average are classified as “very
high”. Classifications elevated, moderate, and high fall between the average and twice the
average; these classifications are divided into thirds.

Figure 2‐5: Transit Dependent Populations Classification System

Central Maryland                                      2-10
Transit Development Plan
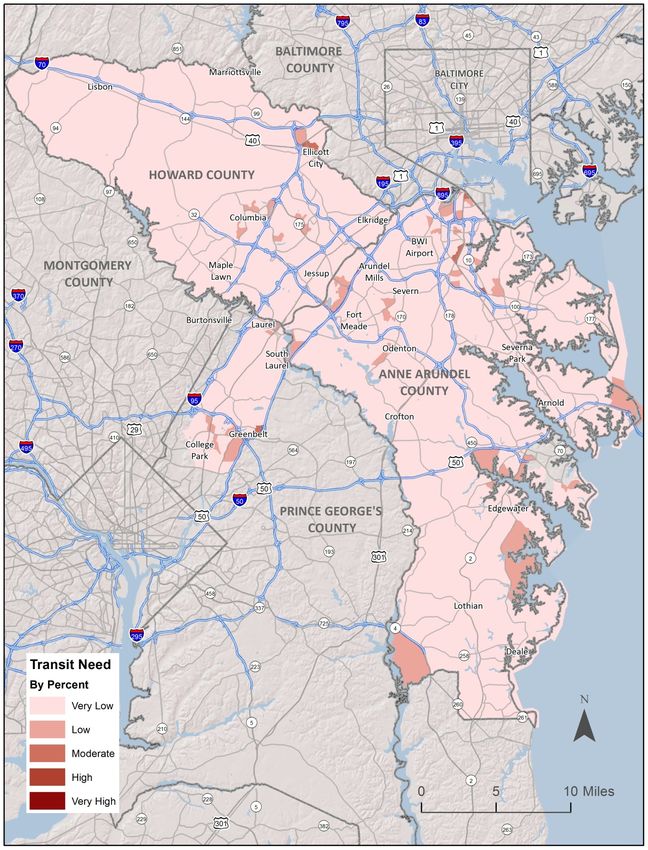
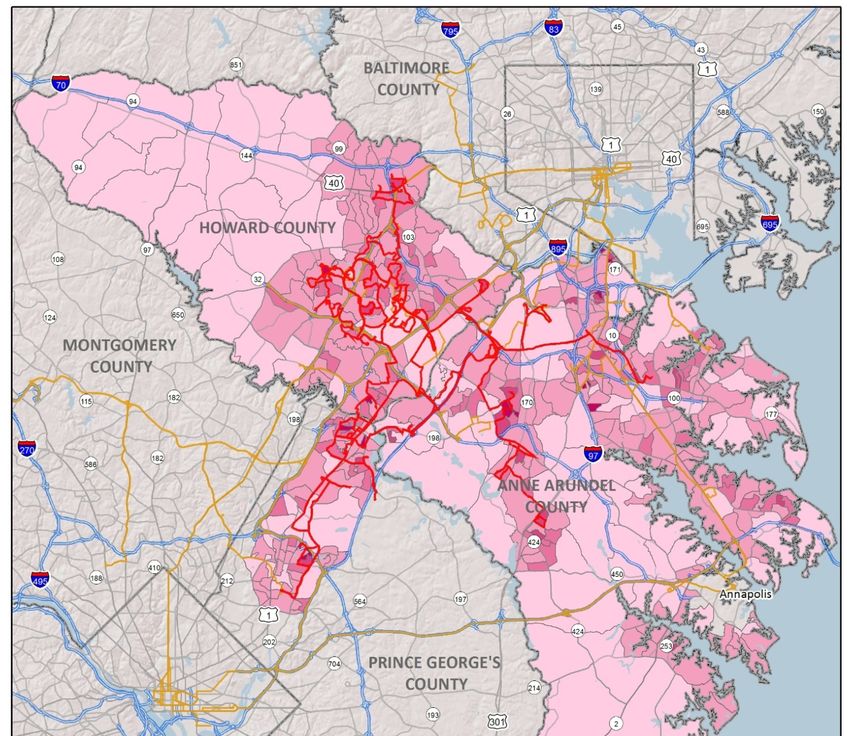
Chapter 2: Demographics and Land Use

Transit Dependence Index—Density

Figure 2‐6 displays the results of the TDI analysis of Central Maryland, based on the density of
the populations with higher levels of transit need. Areas shown in darker shading are
reflective of a higher density of persons with a potentially greater need for public
transportation. The high needs areas are somewhat scattered, but again the existing transit
network generally connects these areas, though in many cases it would require transfers for
riders to access major activity centers.

Transit Dependence Index—Percentage

The Transit Dependence Index Percent (TDIP) provides a complement to the TDI density
analysis. It is nearly identical to the TDI measure with the exception of the population
density. By removing the population per square mile factor the TDIP measures the degree
rather than the amount of vulnerability. TDIP represents the percentage of population within
the block group with socioeconomic characteristics above the average, and follows the TDI’s
five‐tiered categorization of very low to very high. Figure 2‐7 presents a map showing areas in
which a high percentage of the population with a transit need is located, rather than where
there are high numbers of persons in need.

By showing the degree of need rather than the total amount of need, TDIP can show where
there is high transit need in areas with lower population densities. In other words, TDI will
show high need in areas with larger transit dependent populations, and TDIP will show high
need in areas where transit dependent persons make up a larger portion of the total
population, regardless of population size. As can be seen in the map, based on percentage
areas some lower density areas such as Wayson’s Corners in Anne Arundel County now show
some level of transit dependence, though in many cases areas with a high density of need also
have a high percentage of residents that potentially need transit services.

Central Maryland                            2-11
Transit Development Plan
Chapter 2: Demographics and Land Use

Figure 2‐6: Transit Need Index‐Based on Density of High Needs Populations

 American Community Survey (ACS) 5 Year Sample – 2011 to 2015

Central Maryland                                                2-12
Transit Development Plan
Chapter 2: Demographics and Land Use

Figure 2‐7: Transit Need Index‐Percentage

 American Community Survey (ACS) 5 Year Sample – 2011 to 2015

Central Maryland                                                2-13
Transit Development Plan
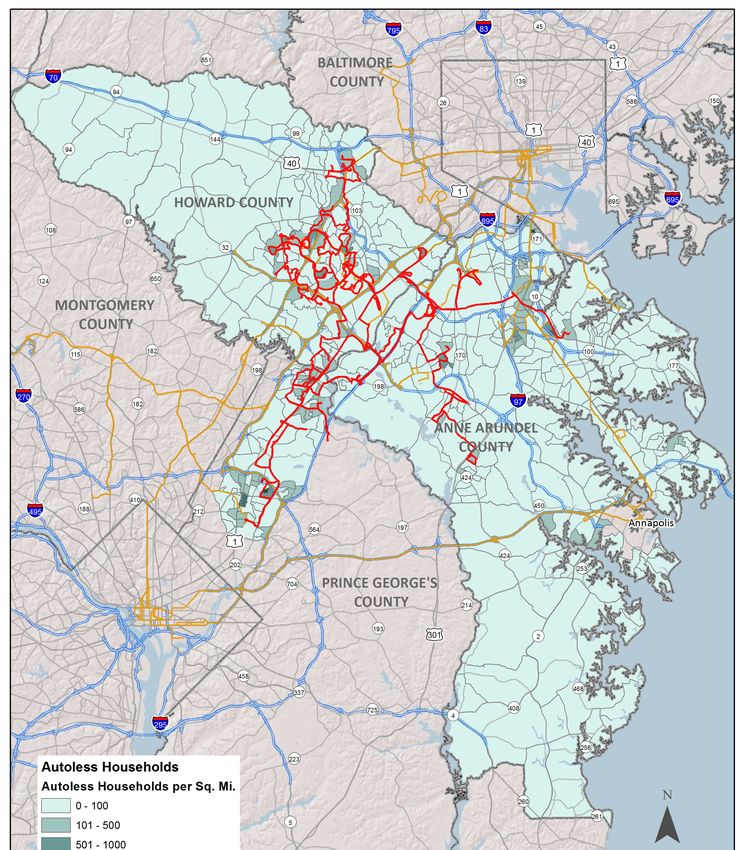
Chapter 2: Demographics and Land Use

Analysis of Individual Needs Factors
As noted above, the use of a combined index of potential transit dependence can sometimes
mask variations that may indicate a greater or lesser need for transit based in the impact of
one or two factors. For that reason each of the factors is presented separately.

Autoless Households

Households without at least one personal vehicle are more likely to depend upon the mobility
offered by public transit than those households with access to a car. Although households
with no automobiles are reflected in both the TDI and TDIP measures, displaying this
segment of the population is important because many land uses in the region are at distances
too far for non‐motorized travel. Figure 2‐8 presents the relative density of households with
no personal vehicles available, with the existing RTA and MTA transit networks. As can be
seen, the result of many years of planning is that essentially all the areas that are relatively
high in autoless households are served at some level by the existing transit network.

Central Maryland                            2-14
Transit Development Plan
Chapter 2: Demographics and Land Use

Figure 2‐8: Autoless Households

American Community Survey (ACS) 5 Year Sample – 2011 to 2015

Central Maryland                                               2-15
Transit Development Plan
Chapter 2: Demographics and Land Use

Older Populations

Individuals ages 65 and older may scale back their use of personal vehicles as they age,
leading to a greater reliance on public transportation compared to those in other age
brackets. Illustrated in Figure 2‐9, the senior population is more dispersed throughout the
region. Areas in Southern Howard County, Central Anne Arundel, Severn, South Glen Burnie,
Harundale, Crofton, Arnold, Severna Park, Jacobsville, Lake Shore, Edgewater, Heritage
Harbour, all show moderate to high densities of seniors but are not served by fixed‐route
services. In both Anne Arundel and Howard there are significant county‐wide demand‐
response programs providing transportation for senior populations in areas with limited
fixed‐route transit service.

Central Maryland                          2-16
Transit Development Plan
Chapter 2: Demographics and Land Use

Figure 2‐9: Older Populations (Persons Ages 65 and Older)

  American Community Survey (ACS) 5 Year Sample – 2011 to 2015

Central Maryland                                                 2-17
Transit Development Plan
Chapter 2: Demographics and Land Use

Youth Populations

Youths and teenagers, ages 10 to 17, who cannot drive or are just starting to drive but do not
have an automobile available may utilize public transit to reach jobs, activities, shopping or
social activities. The youth population is also dispersed throughout the study area, but there
are particular areas with a high density of youth lacking transit service in Howard County
along Route 103 in between Ellicott City and Route 100, in the River Hill area, in the Kings
Contrivance area east of Route 29, in the Elkridge area west of I‐95, and in the
Waterloo/Sherwood Crossing area west of I‐95. In the portion of Prince George’s County
served by the RTA an area with a high density of youth population lacking RTA or MTA
service is the Ammendale/West Beltsville area. In Anne Arundel County residential areas of
Fort Meade, Arundel Hills and areas east of I‐97 south of I‐695, Pasadena, Crofton,
Millersville, Severna Park, and along College Parkway to Saint Margarets are all areas with a
moderate or high density of youth and minimal or no fixed‐route transit. The density of youth
populations can be seen in Figure 2‐10.

Central Maryland                           2-18
Transit Development Plan
Chapter 2: Demographics and Land Use

Figure 2‐10: Density of Youth Populations (Ages 10‐17)

  American Community Survey (ACS) 5 Year Sample – 2011 to 2015

Central Maryland                                                 2-19
Transit Development Plan
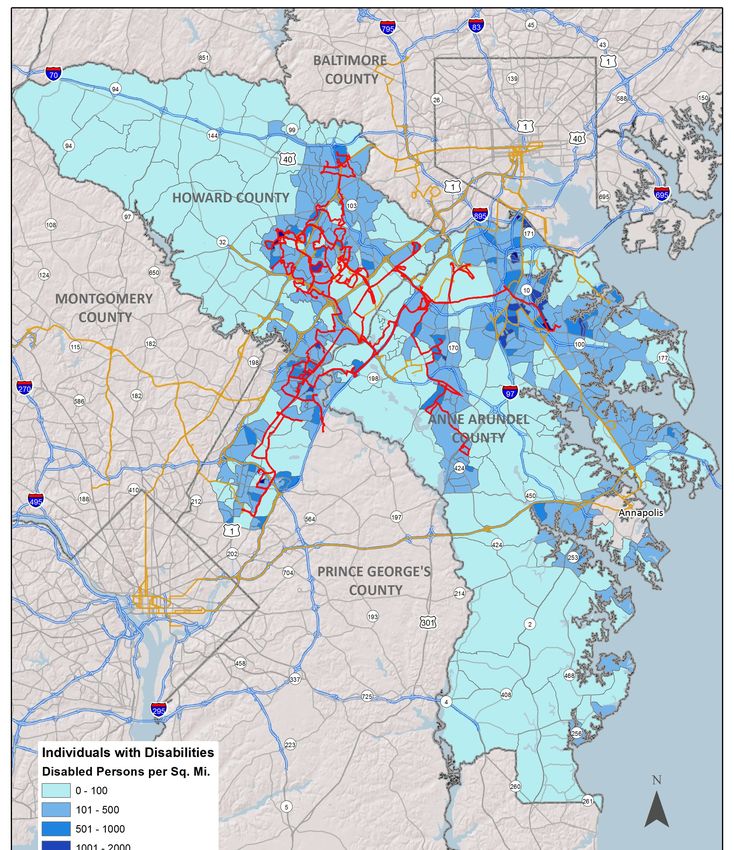
Chapter 2: Demographics and Land Use

Persons with Disabilities

Due to changes in Census and American Community Survey reporting, the 2010‐2014 ACS
provides the most recent data available to analyze the prevalence and geographic distribution
of individuals with disabilities. Unlike the factors above, data is only available at the tract
level, not the block group. Though it cannot show finer trends, this information is still
important to consider. Those with disabilities may be unable to operate a personal vehicle
and consequently be more likely to rely on public transportation. Figure 2‐11 displays that
disabled populations are dispersed throughout the region, generally in proportion to the
overall population density. Again, as in the case of the senior populations, the area of Anne
Arundel east of Route 2 has a relatively high density of persons with disabilities, but no fixed‐
route transit service. Maintaining the availability of demand‐response transportation for
persons with disabilities is likely to be the best way to meet the needs in these areas.

Central Maryland                             2-20
Transit Development Plan
Chapter 2: Demographics and Land Use

Figure 2‐11: Individuals with Disabilities

    American Community Survey (ACS) 5 Year Sample – 2011 to 2015

Central Maryland                                              2-21
Transit Development Plan
Chapter 2: Demographics and Land Use
Title VI, Environmental Justice, and Limited English Proficiency Analysis
Minority populations, low‐income populations, and populations with limited English
proficiency are federally protected. Federally funded public transportation providers are
mandated to consider the three population groups when considering transit improvement
projects. As part of the Civil Rights Act of 1964, Title VI prohibits discrimination on the basis of
race, color, or national origin in programs and activities receiving federal subsidies. Executive
Order 12898: Federal Actions to Address Environmental Justice in Minority Populations and
Low‐Income Populations augments Title VI to include federal protection to low‐income
populations. This section examines the minority and populations living below the poverty
level in Central Maryland and summarizes the prevalence of residents with Limited‐English
Proficiency (LEP).
Minority Populations
In accordance with FTA Circular 4702.1B: Title VI Requirements and Guidelines for Federal
Transit Administration Recipients, transit recipients are mandated to ensure there are no
disparate impacts towards minority persons for transit improvement projects. To determine
whether a transit investment would have a disparate impact it is necessary to first understand
where concentrations of minority individuals reside. Figure 2‐12 provides a map of the service
area showing the Census block groups shaded according to whether they have minority
populations of above or below the service area average (32%). As explained in Figure 2‐4, only
the lowest category of shading is below the service area average percentage of minority
population, and the other four categories of shading are all above that average figure—e.g.
“Low” to “Very High” are all above 32 percent minority.
Low-Income Populations
FTA Circular 4703.1: Environmental Justice Policy Guidance for Federal Transit Administration
Recipients provides guidance for identifying and analyzing low‐income populations. The
Circular identifies low‐income populations as “persons whose median household income is at
or below the U.S. Department of Health and Human Services (HHS) poverty guidelines”.1 A
low‐income population means any readily identifiable group of low‐income persons who live
in geographic proximity. These individuals face financial hardships that may make ownership
and maintenance of a personal vehicle difficult. In such cases, they may be more likely to
depend on public transportation.
Figure 2‐13 presents a map showing the percentage of the Central Maryland population living
below the poverty level by Census block group. Again, the average for the region, the lightest
shading in the map, is above average, while the other categories are above the average.
1
HHS
Central Maryland 2-22
Transit Development PlanChapter 2: Demographics and Land Use Because this map represents the percentage of the population, some areas with a high percentage of the population with very low incomes are in more rural areas. Figure 2‐12: Minority Populations American Community Survey (ACS) 5 Year Sample – 2011 to 2015 Central Maryland 2-23 Transit Development Plan
Chapter 2: Demographics and Land Use

Figure 2‐13: Population Living below Poverty Level

  American Community Survey (ACS) 5 Year Sample – 2011 to 2015

Central Maryland                                                 2-24
Transit Development Plan
Chapter 2: Demographics and Land Use

Limited-English Proficiency

In addition to providing public transportation for a diversity of socioeconomic groups, it is
also important to serve and disseminate information to those of different linguistic
backgrounds.

As shown in Table 2‐5, Central Maryland study area residents predominately speak English
only (approximately 83%). Spanish is the next most prevalent language, spoken by 6.1 percent
of the regional population, though only 2.4 percent are persons with Limited English
Proficiency (LEP). The next most prevalent language is Korean at 1.48 percent, though in this
case there are more Korean speakers who are LEP, 0.9 percent. Of the remaining residents
who do not speak English at home, 71 percent are able to speak English well or very well. The
remaining 29 percent of Non‐English speakers with Limited English Proficiency constitute 2.7
percent of the regional population. Overall, 55,843 individuals (6.0 %) of the regional
population are LEP. No population group exceeds the five percent threshold, though there are
fifteen language groups each with over 1,000 LEP speakers in the regional population. These
results suggest a need to make sure that transit materials are available in Spanish and possibly
Korean.

Table 2‐5: Limited English Proficiency

                                                                            Percent of Total
                                                             Population       Population
 Central MD Study Area Total Population (Ages 5+)             925,314              ‐
 Speaks English Only                                           766,740           82.9%
 Speaks Language Other than English                            158,574           17.1%
 Non LEP Population                                            102,731           11.1%
 LEP Population                                                55,843            6.0%

                                                                           LEP Population as
 Language Spoken by                              Non‐LEP        LEP        a Percent of Total
 Non‐English Speakers                           Population   Population       Population
 Spanish or Spanish Creole                          33,910     22,423            2.4%
 Korean                                             5,721       7,993            0.9%
 Chinese                                            7,216       5,679            0.6%
 African languages                                  8,389       2,291            0.2%
 Vietnamese                                         1,763       2,051            0.2%
 Other Asian languages                              6,482       1,831            0.2%
 Other Indic languages                              3,299       1,752            0.2%
 Tagalog                                            3,450       1,493            0.2%
 Urdu                                               3,210       1,409            0.2%
 Hindi                                              3,317       1,073            0.1%
 Gujarati                                           1,942       961              0.1%

Central Maryland                                2-25
Transit Development Plan
Chapter 2: Demographics and Land Use French (incl. Patois, Cajun) 5,047 895 0.1% French Creole 1,377 780 0.1% Russian 1,759 538 0.1% German 2,627 534 0.1% Arabic 1,445 532 0.1% Portuguese or Portuguese Creole 1,653 480 0.1% Persian 1,227 462 0.0% Other Indo‐European languages 1,466 320 0.0% Japanese 802 312 0.0% Thai 244 260 0.0% Italian 1,332 250 0.0% Other and unspecified languages 190 240 0.0% Polish 540 193 0.0% Other Pacific Island languages 278 170 0.0% Greek 1,011 162 0.0% Armenian 160 153 0.0% Other Slavic languages 705 151 0.0% Mon‐Khmer, Cambodian 173 140 0.0% Other West Germanic languages 300 76 0.0% Serbo‐Croatian 318 64 0.0% Laotian 166 63 0.0% Hungarian 119 47 0.0% Hebrew 538 34 0.0% Yiddish 9 12 0.0% Scandinavian languages 374 11 0.0% Other Native North American languages 93 8 0.0% Hmong 0 0 0.0% Navajo 79 0 0.0% LEP and Non‐LEP Totals 102,731 55,843 6.0% Source: 2011‐2015 ACS 5‐Year Estimates, Table B16001. Central Maryland 2-26 Transit Development Plan
Chapter 2: Demographics and Land Use
Regional Employment Travel Patterns
It is important to account for commuting patterns of residents working inside and outside of
the Central Maryland region. The region is unique in having both significant employment
within each county, commuting between counties, and significant commuting to both
Baltimore and Washington, D.C. As shown in Table 2‐6, Anne Arundel has a much larger
commuting population, with 277,880 commuters compared to 155,666 in Howard County.
With several of the major regional employment centers, Anne Arundel has a higher
percentage of its residents commute within the County, 58 percent, compared to Howard’s 41
percent.
In terms of numbers of commuters rather than percentage, however, the regional nature of
commuting is apparent. More Anne Arundel residents commute to Howard County than vice
versa (18,142 to 17,512). There are more Howard County commuters to Anne Arundel (17,512)
than to Baltimore City (15,692), Baltimore County (12,749), Montgomery (15,759) or the
District of Columbia (9,849). Anne Arundel sends more residents to work in Prince George’s
(26,946) and the District of Columbia (19,591). Combined, these two destinations receive
46,537 Anne Arundel residents, compared to the 33,394 Anne Arundel residents who
commute to Baltimore City and County.
Table 2‐6: Journey to Work Patterns for Central Maryland
Destination
Origin Prince
County Anne Arundel Howard Baltimore Baltimore George's District of Montgomery Other TOTAL
County County County City County Columbia County
Number % Number % Number % Number % Number % Number % Number % Number % Number
Howard 17,512 11% 63,149 41% 12,749 8% 15,692 10% 14,094 9% 9,849 6% 15,759 10% 6,861 4% 155,666
Anne Arundel 159,848 58% 18,142 7% 11,707 4% 21,687 8% 26,946 10% 19,591 7% 7,809 3% 12,149 4% 277,880
Source: ACS, Five‐Year Estimates (2011 ‐ 2015)
Central Maryland 2-27
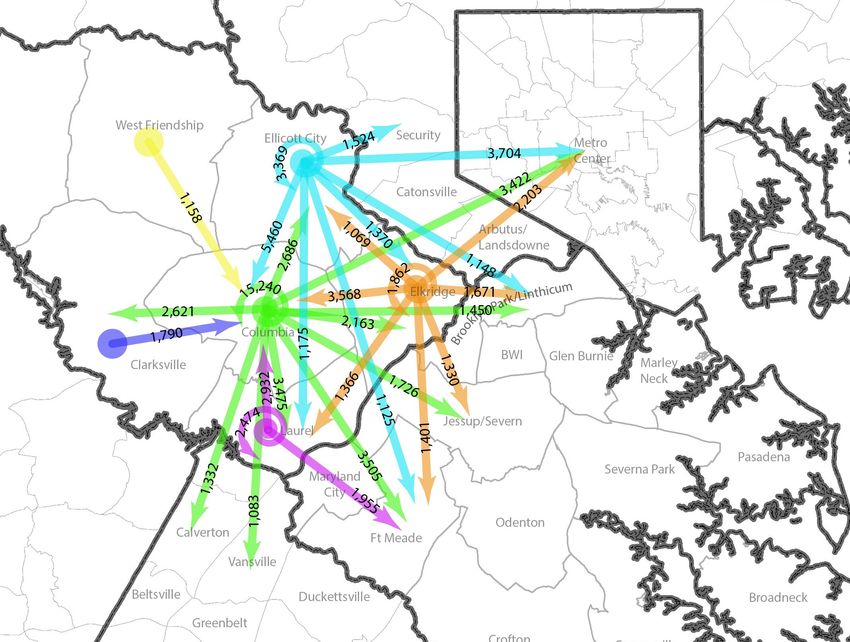
Transit Development PlanChapter 2: Demographics and Land Use Another source of data that provides an understanding of regional employee travel patterns is the Baltimore Metropolitan Council’s regional travel demand model. Using data on home‐ based work trips by all modes (productions) by Regional Planning District, Figure 2‐14 presents a map showing all regional connections over 1,000 trips (all income groups combined) for Howard County origins, and Figure 2‐15 presents a similar map for Anne Arundel origin areas. Table 2‐7 presents the data associated with the Howard County map, and Table 2‐8 presents the data supporting the Anne Arundel County map. From Howard County work trips originating in Columbia, Ellicott City, and Elkridge have Baltimore Metro Center, Fort Meade, Brooklyn Park/Linthicum, and Jessup/Severn as major destinations outside the county. From the Laurel Regional Planning District (RPD), the major destinations are Fort Meade and Columbia. Internally, Columbia is the major destination from the other RPDs, with higher levels of trips than those going to destinations outside the county. Trips to Laurel in Prince George’s did not reach the 1,000 level, but from Columbia trips to Calverton and Vansville did reach that threshold. As an alternative method of identifying regional travel patterns, the study team worked with Sidewalk Labs using Google’s aggregate, anonymized historical traffic data in an effort to improve understanding of multimodal travel demand. Of particular interest was whether aggregate, anonymized data could offer insights for transit planning, such as potential demand for new or adjusted bus routes to meet unmet needs. The available data included comprehensive geographic and temporal coverage, and thus potentially offered complementary dimensions (such as travel patterns at night) to data collected through conventional methods. However, analysis of the data also revealed some noisy, unexpected patterns, which called for deeper investigations against the backdrop of local context. Imbuing the data pattern with local significance and actionable insights would have required a non‐trivial amount of analysis, beyond the resources available for the TDP. Given more resources, further analysis would lead to a more definitive assessment of whether—and how—this data source could be used to develop specific recommendations for future transit services. Central Maryland 2-28 Transit Development Plan
Chapter 2: Demographics and Land Use

Figure 2‐14: Home‐Based Work Trips from Howard County Regional Planning
Districts‐Productions Over 1,000 Trips

Source: Baltimore Metropolitan Council Regional Travel Demand Model

Central Maryland                                          2-29
Transit Development Plan
Chapter 2: Demographics and Land Use

Table 2‐7: Howard County Home‐Based Work Trips: Attractions with over 1,000 trips

 Origin                                   Destination                 Total

 Laurel                                     Columbia                  2,933
 Laurel                                       Laurel                  2,474
 Laurel                                    Fort Meade                 1,955
 Elkridge                                   Columbia                  3,569
 Elkridge                       City of Baltimore ‐ Metro Center      2,203
 Elkridge                                    Elkridge                 1,863
 Elkridge                           Brooklyn Park/Linthicum           1,672
 Elkridge                                  Fort Meade                 1,402
 Elkridge                                     Laurel                  1,367
 Columbia                                   Columbia                  15,241
 Columbia                                  Fort Meade                 3,505
 Columbia                                     Laurel                  3,475
 Columbia                       City of Baltimore ‐ Metro Center      3,422
 Columbia                                  Ellicott City              2,686
 Columbia                                   Clarksville               2,621
 Columbia                                    Elkridge                 2,164
 Columbia                                 Jessup/Severn               1,727
 Columbia                           Brooklyn Park/Linthicum           1,451
 Columbia                                   Vansville                 1,333
 Clarksville                                Columbia                  1,790
 Ellicott City                              Columbia                  5,460
 Ellicott City                  City of Baltimore ‐ Metro Center      3,705
 Ellicott City                             Ellicott City              3,369
 Ellicott City                               Security                 1,524
 Ellicott City                               Elkridge                 1,370
 Ellicott City                                Laurel                  1,175
 Ellicott City                      Brooklyn Park/Linthicum           1,148
 Ellicott City                             Fort Meade                 1,126
 West Friendship                            Columbia                  1,158
Source: Baltimore Metropolitan Council Regional Travel Demand Model

Central Maryland                                           2-30
Transit Development Plan
Chapter 2: Demographics and Land Use

Figure 2‐15: Home‐Based Work Trips from Anne Arundel County Regional Planning
Districts‐Productions Over 1,000 Trips

Source: Baltimore Metropolitan Council Regional Travel Demand Model

Central Maryland                                    2-31
Transit Development Plan
Chapter 2: Demographics and Land Use

Table 2‐8: Anne Arundel County Home‐Based Work Trips: Attractions with over 1,000
trips

 Origin                                Destination                   Total
 Brooklyn Park/Linthicum       Baltimore City ‐ Metro Center         1,888
 Brooklyn Park/Linthicum         Brooklyn Park/Linthicum             1,340
 Glen Burnie                           Glen Burnie                   2,543
 Glen Burnie                   Baltimore City ‐ Metro Center         2,349
 Glen Burnie                     Brooklyn Park/Linthicum             2,325
 Glen Burnie                          Jessup/Severn                  2,260
 Jessup/Severn                         Fort Meade                    3,911
 Jessup/Severn                        Jessup/Severn                  2,809
 Jessup/Severn                   Brooklyn Park/Linthicum             2,167
 Jessup/Severn                          Columbia                     1,472
 Jessup/Severn                 Baltimore City ‐ Metro Center         1,341
 Jessup/Severn                            Laurel                     1,044
 Jessup/Severn                         Glen Burnie                   1,020
 Severna Park                          Severna Park                  3,701
 Severna Park                         Jessup/Severn                  2,532
 Severna Park                          Glen Burnie                   2,308
 Severna Park                  Baltimore City ‐ Metro Center         2,173
 Severna Park                    Brooklyn Park/Linthicum             2,169
 Severna Park                          Crownsville                   2,077
 Severna Park                          Fort Meade                    2,031
 Severna Park                           Annapolis                    1,361
 Severna Park                           Columbia                     1,325
 Pasadena                               Pasadena                     2,605
 Pasadena                      Baltimore City ‐ Metro Center         2,148
 Pasadena                              Severna Park                  2,089
 Pasadena                              Glen Burnie                   1,758
 Pasadena                        Brooklyn Park/Linthicum             1,619
 Pasadena                             Jessup/Severn                  1,619
 Pasadena                              Fort Meade                    1,286
 Pasadena                              Marley Neck                   1,143
 Pasadena                               Columbia                     1,044
 Maryland City                         Fort Meade                    1,417
 Fort Meade                            Fort Meade                    2,005
 Odenton                               Fort Meade                    3,180
 Crofton                                 Crofton                     3,185
 Crofton                               Fort Meade                    2,533

Central Maryland                         2-32
Transit Development Plan
Chapter 2: Demographics and Land Use

  Origin                                           Destination               Total

  Crofton                                          Crownsville               2,205
  Crofton                                           Annapolis                1,155
  Crofton                                           Odenton                  1,059
  Crownsville                                      Crownsville               2,817
  Crownsville                                       Annapolis                1,545
  Broadneck                                        Crownsville               2,815
  Broadneck                                        Broadneck                 2,661
  Broadneck                                         Annapolis                2,588
  Broadneck                                       Severna Park               1,318
  Annapolis                                         Annapolis                7,243
  Annapolis                                        Crownsville               4,408
  Annapolis                              Annapolis Neck/Edgewater/Mayo       1,248
  Annapolis Neck/Edgewater/Mayo                    Crownsville               3,391
  Annapolis Neck/Edgewater/Mayo                     Annapolis                3,152
  Annapolis Neck/Edgewater/Mayo            Annapolis Neck/Edgewater/Mayo     1,824
  Deale/Lothian                                      Deale/Lothian           1,245
 Source: Baltimore Metropolitan Council Regional Travel Demand Model

On the Anne Arundel side of the region, the higher volume home‐based work trip
interchanges are more internal, though there are high levels (over 1,000) trips to Baltimore
Metro Center (from Brooklyn Park/Linthicum, Jessup/Severn, Glen Burnie, Severna Park and
Pasadena). The other major external destination is Columbia, with trips over the 1,000
threshold from Pasadena, Severna Park and Jessup/Severn. Laurel (in Howard County) is a
destination for trips from Jessup/Severn.

Major internal work‐trip patterns involve Fort Meade as key destination, with work trips
originating in Maryland City, Jessup/Severn, Glen Burnie, Pasadena, Severna Park, Odenton
and Crofton. Brooklyn Park/Linthicum is also a major destination from Jessup/Severn, Glen
Burnie, Severna Park and Pasadena.

Of interest is that the BMC model did not identify any home‐based work trip interchanges
over 1,000 trips for the BWI RPD. The largest interchanges for BWI are with the Glen Burnie
(957 trips), Severna Park (770 trips), RPDs and Jessup Severn (708 trips).

Central Maryland                                  2-33
Transit Development Plan
Chapter 2: Demographics and Land Use
Summary of Needs
When combining the demographic, land‐use, and commuter trends contained within this
section the following needs and themes emerge:
This is a very large region, with a population that exceeds that of the City of Baltimore
(621,849 in 2015) and is close to the overall population of Prince George’s County
(909,535 in 2015—some of which is included in the Central Maryland estimate).
The region’s population has grown substantially, and is continuing to grow.
The region’s population of seniors is projected to increase substantially in real
numbers and as a percentage of the population.
The density of population varies considerably across the region, with concentrations of
residential density in all three counties served by the RTA. Much of the residential
development is lower‐density single family, though recent development patterns
include a balance of multi‐family and single‐family residential construction.
There is a significant population of persons with a high potential need for transit
services based on income, auto ownership, age, and disability status. Transit
connections are needed to link the residential areas housing this population to
employment and services.
There is a substantial amount of employment across the region, and substantial
commuting of residents to employment in Baltimore and Washington, D.C. In
addition, many commuters staying within the region cross county lines to reach their
jobs, particularly from Howard County to Western Anne Arundel and vice versa.
The existence of these regional travel demand patterns means that there is a need for
both local transit within the counties and regional connections to ensure that workers
can reach employment within the region and in the two metro areas (Baltimore and
Washington, D.C.).
Central Maryland 2-34
Transit Development PlanYou can also read