ADDENDUM DEMOGRAPHICS UTILIZING A RACIAL, ETHNIC, AND NEIGHBORHOOD LENS - JAMES JENNINGS, PHD - BUILDBPS
←
→
Page content transcription
If your browser does not render page correctly, please read the page content below
Addendum
Demographics Utilizing a Racial,
Ethnic, and Neighborhood Lens

Prepared by
James Jennings, PhD.
Professor Emeritus, Urban and
Environmental Policy & Planning.

Tufts university

December 2016.
Executive Summary
The Addendum complements and builds on the                    Age Structure
November 2, 2016, report, BuildBPS Demographics                • Growth is occurring for both older and younger
Report for the Facilities Master Plan (BuildBPS                  segments of the population, the former at a
Demographics), by utilizing a racial, ethnic, and                faster rate than the latter. For Blacks and Latinos,
geographic (i.e., neighborhood) lens in the                      however, it is the younger age groups (17 years and
presentation and analysis of population and school               younger) that are growing fastest.
data. This Addendum is an extension of the BuildBPS
Demographics report, not a reiteration of said report           • Black and Latino children under 18 years of age
and its enrollment projections or patterns. The                    will continue to represent the dominant proportion
BuildBPS Demographics report focuses on enrollment                 of persons in younger age groups in Boston.
projections and trends for the City of Boston; this
Addendum incorporates detailed racial, ethnic, and              • Growth of youth populations (0-17 years) is
neighborhood data.1 The latter is important because                 increasing in predominantly Black and Latino
it helps to identify information relevant to inclusive              neighborhoods.
planning and equitable decision-making related to
future enrollment trends and patterns.                         Neighborhood Characteristics
                                                                • Children and youth are not distributed evenly in
Based on census data and population projections, as               terms of race and ethnicity across neighborhoods.
well as spatial analyses, this Addendum highlights                Black and Latino children will continue to reflect
findings that can have implications for decision-                 patterns of residential concentration along
making regarding enrollment trends, capacity planning,            neighborhood boundaries.
programming, and needs assessment / resource
distribution across the City. Generally, broader findings       • The majority (59.2%) of all students enrolled
touch upon population, age structure, neighborhood                 in Boston Public Schools live in just four
characteristics, and population projections and capture            neighborhoods: Roxbury, Dorchester, East Boston,
rates. These include the following:                                and Mattapan. By neighborhood, 9,870 students
                                                                   (17.5% of the entire BPS enrollment) live in
Population                                                         Roxbury, 11,821 (20.9%) live in Dorchester, 6,507
 • Boston’s overall population continues to reflect                (11.5%) live in East Boston, and 5,282 (9.3%) live in
   increasingly growing racial and ethnic diversity                Mattapan.

 • Latinos and Blacks, and Asians are growing at a             Population Projections, Enrollment, and
    faster rate than Non-Latino Whites, both relative          Capture Rate.
    to the overall population, but especially among             • Population projections reflect racial and
    school-age youth.                                             neighborhood dynamics in Boston, and should be
                                                                  considered in planning and decision-making.
 • Growing racial and ethnic diversity (in terms
    of Blacks, Latinos, and Asians) is not taking             1. BuildBPS Demographics did include some limited data and
    place across the city uniformly, but rather is               information about neighborhoods, as well as race and ethnicity,
    concentrated in some neighborhoods areas.                    but these areas were not treated as significant dimensions of the
                                                                 report.

                                               BuildBPS - Addendum: Demographics Utilizing a Racial, Ethnic, and Neighborhood Lens   3
• Changes in overall grade enrollment over a period • Race and ethnicity, and location (i.e.,
of time may reflect racial and ethnic differences at neighborhood areas) are strongly associated in
various grade levels; exploring this further can help Boston. This Addendum expands the information
in understanding particular enrollment patterns in the BuildBPS Demographics report by showing
and trends. how Latinos, Blacks, and Asians are “distributed”
across neighborhood areas.
• BuildBPS Demographics states that the “district’s
capture rate has averaged 52.8%” (p. 29). Further, • Capture rates are important in understanding
“BPS kindergarten enrollment as a percentage of enrollment patterns, but actual rates can be
eligible students (capture rate) has been declining different across the City and by neighborhood
since 2012.” Capture rates may be very different areas.
by neighborhood, and, therefore, may not show
declines for certain areas. Using a racial, ethnic, • Demographic characteristics, such as birth rates
and geographic (i.e., neighborhood) lens points to and fertility, children living in households, and
capture rates that are different for various groups, average household size, reflect major differences
as well as for particular locations within the by race and ethnicity. For example, in 2010, 70%
City. For example, there are some neighborhood of all Black and Latino households reported the
areas that are primarily Black and Latino with presence of at least one person under 18 years of
significantly high capture rates (see Map 21 and age, compared to only 21% of all Non-Latino White
Map 22). households. The 2010–2014 American Community
Survey 5 Year Estimates (abbreviated henceforth
More specific findings presented throughout as “2010–2014 ACS”)2 reiterates this finding, and
this Addendum include the following: shows further that Latino and Black households
• Data about age structure and projected age with children are concentrated in certain
structure can be differentiated by race and neighborhood areas.
ethnicity; this means that growth patterns will be
different for communities of color, compared to
Non-Latino Whites.
• The BuildBPS Demographics report showed grade-
enrollment changes in the aggregate; however,
overall growth rate or changes in the number of
K-12 student-enrollment projections can vary by 2. The 2010–2014 ACS is based on information collected from
yearly surveys between January 1, 2010, and December 31,
race, ethnicity, and location. In other words, while 2014; the 5 Year Estimates represent an average of the yearly
the aggregate level may be stable in terms of all surveys, and not an actual cumulative count. The Census
students, it might increase considerably for Latino Bureau describes the ACS as “a national survey that uses
and Black students. BuildBPS Demographics continuous measurement methods. In this survey, a series of
showed significant enrollment decline in the monthly samples produce annual estimates for the same small
areas (census tracts and block groups) formerly surveyed via
middle-school grades, but did not report this the decennial census long-form sample…ACS samples about
decline by race and ethnicity. 3.54 million addresses each year.” Further, “the ACS 3-year
estimates have been discontinued. The 2005–2007, 2006–2008,
• Based on the data presented in the BuildBPS 2007–2009, 2008–2010, 2009–2011, 2010–2012 and 2011–2013
Demographics report, the “proportion of K-12 ACS 3-year estimates will remain available to data users, but no
new 3-year estimates will be produced. Every community in the
students enrolled in BPS has been declining over nation will continue to receive a detailed statistical portrait of
time.” This does not, however, negate that Latino its social, economic, housing and demographic characteristics
and Black children are growing in terms of both through 1-year and 5-year ACS products.” See: http://www.
overall numbers and as a proportion of all children census.gov/programs-surveys/acs/methodology.html
in the City’s overall population.
4 BuildBPS - Addendum: Demographics Utilizing a Racial, Ethnic, and Neighborhood LensThe Addendum is organized by the following sections:
• Introduction and Methodology
• Total Population
• Age Structure; Fertility and Birth Rates; Households with Children; and
• Average HH Size
• Population Projections by Race, Ethnicity, and Neighborhoods
• Grade Enrollment and Capture Rates
• Conclusion: Adding Race, Ethnicity, and Neighborhoods to BuildBPS Demographics
BuildBPS - Addendum: Demographics Utilizing a Racial, Ethnic, and Neighborhood Lens 5Introduction and
Methodology
This Addendum adds racial, ethnic, and geographic (i.e., The Boston Public Schools (See Appendix 1). In this
neighborhood) data and perspective to the BuildBPS report and consistent with the city’s 26 neighborhoods,
Demographics report, providing greater insight South Dorchester and North Dorchester are treated as
regarding overall enrollment changes and implications one neighborhood, Dorchester.4 This Addendum only
for decision-making. The presentation of solely includes information about Blacks, Latinos, Asians,
aggregate data can hide racial and ethnic differences and Non-Latino Whites; these groups comprise 96.8%
in the overall population, and thereby negatively of all BPS students.5 There are other racial and ethnic
impact planning and future decision-making related to groups in Boston, but they are reported at much lower
enrollment patterns for Boston and its neighborhoods. numbers in the overall population and the BPS student
body. It should be noted, furthermore, that the three
This Addendum begins with a presentation focusing communities of color discussed in the Addendum
on the total population, and population growth since do not represent monolithic entities. The Black
2010 by race and ethnicity. Next, Boston’s age structure community, for example, includes various ethnicities,
by race and ethnicity is presented based on the 2010 as noted in some reports.6 The Latino community
census and 2010–2014 ACS. The Addendum includes also includes a range of ancestries that may reflect
other census data that suggests differing population different experiences on a range of demographic,
growth rates by race and ethnicity, including fertility economic, and educational variables.7 This is also the
rates and the number and proportion of children under case with regard to the Asian community. In fact, there
18 years by household. The appendices include maps is rapidly increasing ethnic diversification in Boston’s
that illustrate some of the data in the Addendum. Latino, Black, and Asian communities. It is possible
to obtain additional data regarding the age structure
The Addendum utilizes census data (2010 decennial, of ancestries and ethnic origins in these communities
2010–2014 ACS, Public Use Microdata Sample – through Public Use Microdata Samples (PUMS), but
PUMS 2014) to provide racial and ethnic dimensions this is beyond the Addendum’s scope.
to the above report.3 The research also includes
analysis of U.S. census-based population projections GIS software was utilized to compose a series of maps
in terms of age, race, ethnicity and neighborhood to show how population projections for 2021 “look” in
characteristics that may be relevant to BPS enrollment terms of the City’s neighborhood geography. The maps
planning as presented in the above report. To facilitate listed below serve to show geographic patterns in the
a greater understanding of how population changes distribution of children and youth in Boston by race
and projections might impact enrollment planning, a and ethnicity. Maps #2 to #19 also include the location
series of thematic maps were composed to show spatial of all Boston Public Schools (as of December 2016). 8
dimensions of the population projections at census
tract levels and for the 16 planning districts utilized
by the Boston Planning and Development Agency and
BuildBPS - Addendum: Demographics Utilizing a Racial, Ethnic, and Neighborhood Lens 7MAPS
Map 1: Households with Persons Under 18 Years by Tracts and Neighborhoods, 2010–2014 ACS
Map 2: Average Household Size Projected to 2021
Map 3: Number of Projected Households with Children 0–17 Years
Map 4: 2021 Population Projection for All Children, 0–4 Years
Map 5: 2021 Black Proportion of All 0–4 Years by Tracts and Neighborhoods
Map 6: 2021 Black Proportion of All 5–9 Years by Tracts and Neighborhoods
Map 7: 2021 Black Proportion of All 10–14 Years by Tracts and Neighborhoods
Map 8: 2021 Black Proportion of All 15–19 Years by Tracts and Neighborhoods
Map 9: 2021 Latino Proportion of All 0–4 Years by Tracts and Neighborhoods
Map 10: 2021 Latino Proportion of All 5–9 Years by Tracts and Neighborhoods
Map 11: 2021 Latino Proportion of All 10–14 Years by Tracts and Neighborhoods
Map 12: 2021 Latino Proportion of All 15–19 Years by Tracts and Neighborhoods
Map 13: 2021 Asian Proportion of All 0–4 Years by Tracts and Neighborhoods
Map 14: 2021 Asian Proportion of All 5–9 Years by Tracts and Neighborhoods
Map 15: 2021 Asian Proportion of All 10–14 Years by Tracts and Neighborhoods
Map 16: 2021 Asian Proportion of All 15–19 Years by Tracts and Neighborhoods
Map 17: 2021 White (not Latino) Projection of All 0–4 Years by Tracts and Neighborhoods
Map 18: 2021 White (not Latino) Projection of All 5–9 Years by Tracts and Neighborhoods
Map 19: 2021 White (not Latino) Projection of All 10–14 Years by Tracts and Neighborhoods
Map 20: 2021 White (not Latino) Projection of All 15–19 Years by Tracts and Neighborhoods
Map 21: % Kindergarteners Enrolled in Private Schools by Tracts and Neighborhoods
Map 22: % Children in Grades 1–4 Enrolled in Private Schools by Tracts and Neighborhoods
3
The author utilized extrapolations for census tracts reported by Geolytics; the actual methodology used by this demographic projection
company can be found on their website (titled, “Methodology – Population, Housing, and Income Estimates”; accessed: November 12,
2016). These projections begin with 2010 Redistricting Block Level data. It should be noted that population projections for census tracts
has a long history; see, Robert Schmitt, “Methodology for Projecting the Population of Census Tracts” Journal of American Institute of
Planners (1954); also, Stanley K. Smith and Mohammed Shahidullah, “An Evaluation of Population Projection Errors for Census Tracts”
Journal of American Statistical Association (1995); for an actual example and illustration of a step by step application of census tract
population projection, see, “Population Growth Estimates by Census Tracts 2000–2007” Tallahassee-Leon County Planning Department
(2008); also see, David Swanson, “Forecasting the Population of Census Tracts by Age and Sex: the Hamilton-Perry Method in Action”
Population Research in Policy Review (2010); for population projections at the state, county, and city level, See, Methodology for Boston’s
Population Projections 2016, Boston Redevelopment Authority Research Division (September 2016) for discussion and analysis of
population projections for Boston; also see Vintage 2015 Population Projections for information about population projections for state and
counties, UMass Donahue Institute (March 2015).
4
When examining neighborhood population characteristics and changes in Boston, census tracts should be utilized, if possible; there are
significant differences in population characteristics within the City’s neighborhoods and zip codes that can be captured at the tract or
block group level; see: J. Jennings, “Measuring neighborhood distress: a tool for place-based urban revitalization strategies” Community
Development (2012).
5
Based on data provided by BPS regarding race, ethnicity and enrollment the Massachusetts Department of Elementary and Secondary
Education reported that in 2015–2016, Hispanic/Latino students comprised 41.5% of all students; African American students comprised
32.4%; White students, 14.2%; Asian students 8.7%; Multi-race, non-Hispanic students, 2.8%; Native American students, 0.3%; and Native
Hawaiian and Pacific Islander students, 0.2%; see, http://profiles.doe.mass.edu/
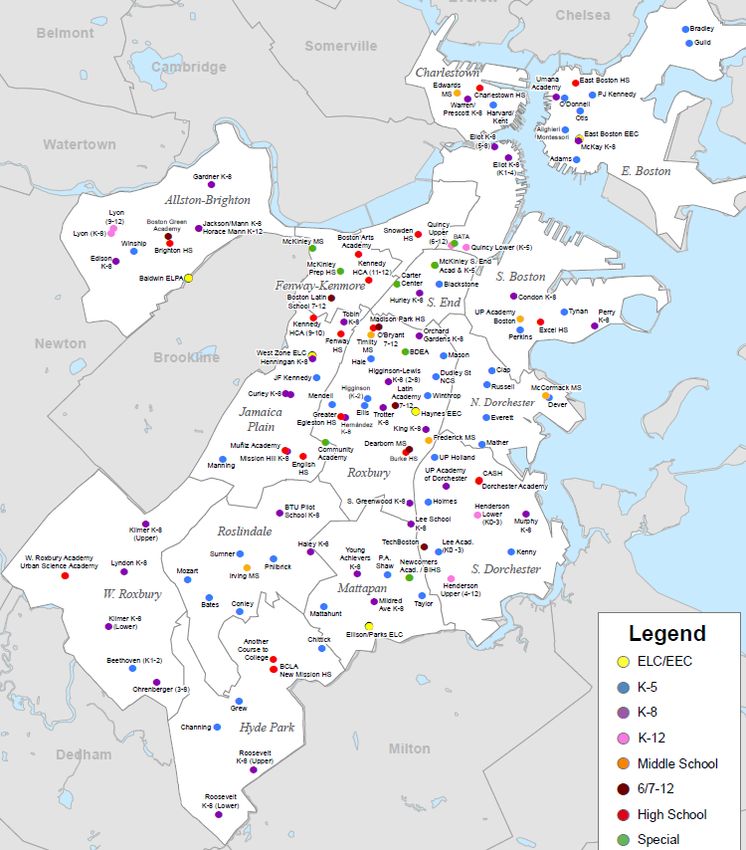
8 BuildBPS - Addendum: Demographics Utilizing a Racial, Ethnic, and Neighborhood LensAppendix 1 is a BPS-generated map showing all public discouraged to make definitive comparisons between
(i.e., non-charter) schools in Boston by location the 2010 decennial official count of the population
and name. As noted earlier, BPDA identifies 26 with subsequent ACS surveys of the population.
neighborhoods within Boston’s 16 planning districts Therefore, caution is in order regarding interpretation
(17, if Harbor Islands are included), as shown in of comparisons. This is also the case with population
Appendix 2. However, for purposes of discussion and projections, most useful in providing what future
analysis, South and North Dorchester is considered reasonable “ballpark” population figures might look
one neighborhood. There are two reasons for using the like.10
planning districts in this report: The first is that the
data and information in the BuildBPS Demographics Another caveat is that, in presenting information
report and related BPS reports are based on the and data about race, Whites can be counted as a
planning districts as neighborhoods; the second race, and, in turn, their count can include Latinos,
reason, more technical, is that census tracts are not an ethnic group. In this report, unless otherwise
completely contiguous across the boundaries of the 26 indicated, Whites are only counted in terms of those
neighborhoods. Overlapping census tracts can impact who are NOT Latino. This provides a more accurate
what can be concluded about any given neighborhood description of racial and ethnic changes in Boston, as
areas, especially as it pertains to population projections. well as population growth rates. In the next section,
A map of the 26 neighborhoods, along with location of for example, Table 1 shows the total population by
Boston Public Schools buildings, is provided in race at 333,033 for Whites. However, if Latinos are not
Appendix 2. included, then the actual count of Whites drops 12.8%
to 290,312 in 2010.
Some caveats are to be noted in the presentation of
the data in this Addendum. One is that data reported Total Population
in the ACS are annual surveys and, therefore, reflect
some variability, versus actual counts in the decennial The following tables are based on the 2010 decennial
census. The data reported in the ACS have margins of population counting of 617,594 persons, and the
error (MOEs) to indicate the variability in the numbers 2010–2014 ACS 5 Year Estimate of 639, 594 persons.
reported. For this reason, it is preferable to use multi-
year surveys (2010–2014 ACS 5 Year Estimates), rather
than single-year estimates (2014 ACS), since a larger
sample produces a smaller MOE.9 Generally, it is also
6
S ee a recent report by J. Jennings, et al., Blacks in Massachusetts: Comparative Demographic, Social and Economic Experiences with
Whites, Latinos, and Asians, Prepared for the Trotter Institute, University of Massachusetts, Boston and the John D. O’Bryant Institute,
Northeastern University (December 2015).
7
See, M. Uriarte, J. Jennings, and J. Douglas, The Silent Crisis-Including Latinos and Why It Matters: Representation in the City
Governments of Boston, Chelsea, and Somerville, Massachusetts, Prepared for the Greater Boston Latino Network, Boston, Massachusetts
(2014).
8
Appendix 1 shows the names and location of public schools as published by BPS (accessed at: www.bostonpublicschools.org)
9
For example, the MOE for the total population reported in the 2010–2014 ACS 5 Year Estimate is approximately +/- 2,875 persons; this
means that there is a 90% confidence level that the actual population is within this range.
10
For this reason, the forewarning in the “Boston Public Schools Demographics Report is an important one: “The District is strongly
encouraged to continue revisiting these projections on an annual basis and to update them to reflect current trends and data” (p.33).
BuildBPS - Addendum: Demographics Utilizing a Racial, Ethnic, and Neighborhood Lens 9Table 1
Total Population by Race 2010 – City of Boston
617,594 % Distribution
White alone 333,033* 54%
Black or African American alone 150,437 24%
American Indian and Alaska Native alone 2,399 0%
Asian alone 55,235 9%
Native Hawaiian and Other Pacific Islander alone 265 0%
Some Other Race alone 51,893 8%
Two or More Races 24,332 4%
Total Population by Latino or Non-Latino 617,594
Not Hispanic or Latino 509,677 83%
Hispanic or Latino 107,917 17%
*The 2010 census count was 290,312 persons for Non-Latino Whites.
Table 2 shows the population by race as reported in the 2010–2014 ACS. When Non-Latino Whites are counted,
there is a more accurate portrayal of population changes in Boston since 2010, as shown in Table 3 reporting
population growth.
Table 2
Total Population by Race, City of Boston
639,594 % Distribution
White alone 340,859 50.9%
Black or African American alone 160,342 23.9%
American Indian and Alaska Native alone 2,515 0.4%
Asian alone 58,545 8.7%
Native Hawaiian and Other Pacific Islander alone 68 0.0%
Some Other Race alone 47,341 7.1%
Two or More Races 29,924 4.5%
Total Population by Latino or Non-Latino 639,594
Not Hispanic or Latino 522,080 81.6%
Hispanic or Latino 117,514 18.4%
Source: 2010–2014 ACS
10 BuildBPS - Addendum: Demographics Utilizing a Racial, Ethnic, and Neighborhood LensTable 3
Population by Race and Ethnicity, 2010–2014 ACS
2010 2010-2015 ACS % Growth since 2010
Whites, Not Latino 329,312 294,432 1.4%
Blacks 150,437 160,342 6.2%
Asians 55,235 58,545 5.7%
Latinos 107,917 117,514 8.2%
% Growth Since 2010, blacks, Latinos, Asians and Non-Latino Whites
% Growth Since 2010, Black, Latinos, Asians and Non-Latinos Whites
10
8.2%
8
6.2% 5.7%
6
4
2
1.4%
0
Whites, Not Latino Blacks Asians Latinos
Table 3 and the chart above, based on the 2010–2014 ACS, suggest that, among the racial and ethnic groups
discussed in this report, communities of color are growing significantly faster than Non-Latino Whites (1.4%).
Since 2010, Latinos have grown by 8.2%; Blacks, 6.2%; and Asians, 5.7%.
BuildBPS - Addendum: Demographics Utilizing a Racial, Ethnic, and Neighborhood Lens 11Age Structure
Showing the age structure only for the total population and Latino children represented an overwhelming
can obscure significant racial and ethnic differences, proportion of younger persons (under 18 years). For
and growth rates for different racial and ethnic groups. example, only counting the four groups shown in this
For example, see “Appendix B Percent in Change of table, Black and Latino children represented 62.4%
Population” in the BuildBPS report; it states that the of all children under 5 years of age, and 72.2% of all
“Under 5” category represented 5.2% of all ages in children among these groups who were 5 to 17 years of
2010. The figure for Blacks under 5 is actually 6.7%; for age.
Latinos, it is even higher (8.7%). The following table
illustrates this point and shows that age distribution The latter scenario is also reflected in the following
varies by racial and ethnic groups. 2010–2014 ACS table, whereby Black and Latino
children represented 59% of all children under 5
In addition to varying age distribution by race and years of age. The proportion jumps for the 5–17-year
ethnicity, this table indicates that, in 2010, Blacks segment, wherein Blacks and Latinos comprised 72%.
Table 4:
Total Population 201011
White
Black % Black Latino % Latino Asian % Asian (Not Latino) % White
Total 150,437 107,917 55,235 290,312
Under 5 years 31,301 31,301 5.2% 10,107 6.7% 9,416 8.7% 2,055 3.7% 9,725 3.3%
5 to 9 years 26,823 26,823 4.3% 10,205 6.8% 8,365 7.8% 1,888 3.4% 5,770 2.0%
10 to 14 years 26,523 26,523 4.3% 10,837 7.2% 8,110 7.5% 1,932 3.5% 5,118 1.8%
15 to 17 years 17,944 17,944 2.9% 7,573 5.0% 5,318 4.9% 1,343 2.4% 3,310 1.1%
18 and 19 years 31,882 31,882 5.2% 6,012 4.0% 5,152 4.8% 3,646 6.6% 16,111 5.5%
20 years 19,242 19,242 3.1% 3,029 2.0% 2,794 2.6% 2,056 3.7% 10,882 3.7%
21 years 17,649 17,649 2.9% 2,775 1.8% 2,520 2.3% 1,913 3.5% 9,904 3.4%
22 to 24 years 51,238 51,238 8.3% 7,917 5.3% 7,027 6.5% 5,311 9.6% 29,677 10.2%
25 to 29 years 74,691 74,691 12.1% 11,104 7.4% 10,472 9.7% 7,766 14.1% 43,441 15.0%
30 to 34 years 53,393 53,393 8.6% 9,708 6.5% 9,372 8.7% 5,061 9.2% 28,047 9.7%
35 to 39 years 40,656 40,656 6.6% 9,417 6.3% 7,872 7.3% 3,922 7.1% 18,554 6.4%
40 to 44 years 36,685 36,685 5.9% 10,052 6.7% 7,170 6.6% 2,949 5.3% 15,736 5.4%
45 to 49 years 35,990 35,990 5.8% 10,786 7.2% 6,451 6.0% 2,812 5.1% 15,267 5.3%
50 to 54 years 34,170 34,170 5.5% 10,123 6.7% 5,337 4.9% 2,549 4.6% 15,538 5.4%
55 to 59 years 30,218 30,218 4.9% 8,482 5.6% 4,051 3.8% 2,474 4.5% 14,681 5.1%
60 and 61 years 11,251 11,251 1.8% 3,067 2.0% 1,399 1.3% 960 1.7% 5,662 2.0%
62 to 64 years 14,582 14,582 2.4% 4,047 2.7% 1,696 1.6% 1,035 1.9% 7,634 2.6%
65 and 66 years 8,186 8,186 1.3% 2,347 1.6% 863 0.8% 636 1.2% 4,236 1.5%
67 to 69 years 10,495 10,495 1.7% 2,939 2.0% 1,086 1.0% 901 1.6% 5,495 1.9%
70 to 74 years 14,229 14,229 2.3% 3,770 2.5% 1,426 1.3% 1,414 2.6% 7,406 2.6%
75 to 79 years 11,150 11,150 1.8% 2,628 1.7% 989 0.9% 1,186 2.1% 6,188 2.1%
80 to 84 years 9,117 9,117 1.5% 1,880 1.2% 593 0.5% 772 1.4% 5,725 2.0%
85 years and over 9,060 9,060 1.5% 1,632 1.1% 438 0.4% 654 1.2% 6,205 2.1%
11
617,594 is Boston’s total population in 2010; the total number of persons for all Blacks, Latinos, Asians and Non-Latino Whites is 603,901,
or 98% of all racial and ethnic groups in Boston’s total population.
12 BuildBPS - Addendum: Demographics Utilizing a Racial, Ethnic, and Neighborhood LensTable 5:
Age Structure by Blacks, Latinos, Asians and Whites, 2010–2014 ACS
Black % Black Latino % Latino Asian % Asian White (Not Latino) % White
Total 160,342 117,514 58,545 294,432
Under 5 years 33,398 10,377 6.5% 9,459 8.0% 2,196 3.8% 11,366 3.9%
5 to 9 years 27,869 10,990 6.9% 8,538 7.3% 1,910 3.3% 6,431 2.2%
10 to 14 years 26,845 11,012 6.9% 8,678 7.4% 1,900 3.2% 5,255 1.8%
15 to 17 years 17,635 7,373 4.6% 5,469 4.7% 1,550 2.6% 3,243 1.1%
18 and 19 years 30,831 5,429 3.4% 5,507 4.7% 3,568 6.1% 16,327 5.5%
20 to 24 years 78,909 15,430 9.6% 13,640 11.6% 8,945 15.3% 40,894 13.9%
25 to 29 years 80,987 13,317 8.3% 11,269 9.6% 8,140 13.9% 48,261 16.4%
30 to 34 years 57,531 10,610 6.6% 10,041 8.5% 5,665 9.7% 31,215 10.6%
35 to 44 years 78,827 20,176 12.6% 16,227 13.8% 7,654 13.1% 34,770 11.8%
45 to 54 years 71,461 21,347 13.3% 13,325 11.3% 5,981 10.2% 30,808 10.5%
55 to 64 years 60,699 17,481 10.9% 8,735 7.4% 5,082 8.7% 29,401 10.0%
65 to 74 years 35,409 10,055 6.3% 4,094 3.5% 3,028 5.2% 18,232 6.2%
75 to 84 years 20,500 4,801 3.0% 1,811 1.5% 2,029 3.5% 11,859 4.0%
85 years and over 9,932 1,944 1.2% 721 0.6% 897 1.5% 6,370 2.2%
The two tables demonstrate that children under 5 years Latinos (combined), in the 2010 decennial census and
of age, for the four groups shown, showed a change the 2010–2014 ACS. In both instances, the cohorts
from 31,303 persons in 2010 to 33,398 in the 2010– for Latino and Black children and youth are larger
2014 ACS, or approximately 6.7%. proportionately than for Non-Latino Whites. The 2010
pyramid, for example, shows that 7.6% of all Black and
In 2010, there were 101,072 persons under 18 years Latino persons were under 5 years of age, compared to
of age for these four groups; 69% of all these children a figure of 3.3% of all Non-Latino Whites. Additionally,
were Black and Latino. This total was reported at 27.1% of all Black and Latino persons in Boston were
105,747 in the 2010–2014 ACS, or an increase of 4.6%, under 18 years of age, compared to 8.2% of all Non-
of which 68% were represented by Black and Latino Latino Whites who were under 18 years of age.
children.
The 2010–2014 ACS population pyramid shows that
The next two population pyramids visually show the 25.8% of all Black and Latino persons were under 18
different age structures of the population between years of age, compared to 9.0% for Non-Latino Whites.
non-Hispanic Whites on one side, and Black and
BuildBPS - Addendum: Demographics Utilizing a Racial, Ethnic, and Neighborhood Lens 13Age Distribution by Race in boston (2010) Non Latino White Black and Latino
85 years and over -2.1% 0.8%
80 to 84 years -2.0% 1.0%
75 to 79 years 1.4%
-2.1%
70 to 74 years -2.6% 2.0%
67 to 69 years -1.9% 1.6%
65 and 66 years 1.2%
-1.5%
62 to 64 years -2.6% 2.2%
60 and 61 years
-2.0% 1.7%
55 to 59 years -5.1% 4.9%
50 to 54 years -5.4% 6.0%
45 to 49 years -5.3% 6.7%
40 to 44 years -5.4% 6.7%
35 to 39 years -6.4% 6.7%
30 to 34 years -9.7% 7.4%
25 to 29 years -15.0% 8.4%
22 to 24 years -10.2% 5.8%
21 years -3.4% 2.0%
20 years -3.7% 2.3%
18 and 19 years -5.5% 4.3%
15 to 17 years -1.1%
5.0%
10 to 14 years -1.8% 7.3%
5 to 9 years -2.0% 7.2%
Under 5 years -3.3% 7.6%
20% 15% 10% 5% 0% 5% 10% 15% 20%
Note: a minus (-) sign for Non-Latino Whites only indicates that the proportions are being shown on the left
side of the 0% on the horizontal axis.
% Age Distribution by Non-Latino Whites, and Black and Latinos Non Latino White Black and Latino
(Combined), 2010-2014 ACS
1.0%
85 years and over -2.2%
75 to 84 years -4.0% 2.4%
65 to 74 years -6.2% 5.1%
55 to 64 years -10.0% 9.4%
45 to 54 years -10.5% 12.5%
35 to 44 years -11.8% 13.1%
30 to 34 years -10.6% 7.4%
25 to 29 years -16.4% 8.8%
20 to 24 years -13.9% 10.5%
18 and 19 years -5.5% 3.9%
-1.1%
15 to 17 years 4.6%
10 to 14 years -1.8% 7.1%
5 to 9 years -2.2% 7.0%
Under 5 years -3.9% 7.1%
20% 15% 10% 5% 0% 5% 10% 15% 20%
Note: a minus (-) sign for Non-Latino Whites only indicates that the proportions are being shown on the left
side of the 0% on the horizontal axis.
14 BuildBPS - Addendum: Demographics Utilizing a Racial, Ethnic, and Neighborhood LensAnother way to illustrate population-group differences in terms of how young or old they are, and something
that can portend future growth patterns, is median age. Comparing median ages (i.e., the age at which half the
population is greater, and half is lower than the median age) also points toward a much younger population for
Latinos, especially, and Blacks. For instance, according to the 2010–2014 ACS, half of all Latino males were under
27 years of age; the figure for Latina women was 29.4 years. While Black women tended to be among the oldest in
terms of median age at 34.8 years, half of all Black males were under 30.4 years of age.
Median Age by Sex, Race and Ethnicity
Non-Latino White Females 31.9
Non-Latino White Males 32.3
Asian Females 30.9
Asian Males 30.5
Latina Females 29.4
Latino Males 27.0
Black females 34.8
Black Makes 30.4
This information points toward two developments already discussed: continuing faster population growth of
Latinos and Blacks into future years, and an increasing possibility that these two groups will continue to increase
their proportion of all persons who are living in Boston.
BuildBPS - Addendum: Demographics Utilizing a Racial, Ethnic, and Neighborhood Lens 15Fertility and Birth Rates, Households with
Children, and Average Household Size
Fertility rates have a major impact on the configuration birth rate differences among the four groups, which
of future population growth rates and trends by race will point to varying growth patterns and trends. The
and ethnicity.12 The BuildBPS Advisory Committee Boston Public Health Commission has forewarned
Report correctly notes that “…fewer children are being about overlooking differences in fertility by race and
born in Boston” when comparing 1990, 2000, and 2010 ethnicity.13
decennial counts. This should not, however, minimize
the weight that higher fertility rates for Latinas and The next table shows the fertility rates for women
Black women can have on the City’s overall population residing in Boston who gave birth as reported in
and future growth. There are significant fertility and 2010–2014 ACS.14
Table 7:
Women 15 to 50 Years who had a birth in the last 12 months, by Race and Ethnicity
# of births % of all births
Black Women 2,372 5.1%
Latina Women 2,179 6.0%
Asian Women 627 3.0%
White, not Latina Women 2,639 2.7%
12
See, Thayer Watkins, The Cohort Survival Projection Method, Department of Economics, San Jose State University; accessed at: http://
www.sjsu.edu/faculty/watkins/cohort.htm
13
In Health of Boston 2014 – 2015, published by the Boston Public Health Commission - Research and Evaluation Office, for example, this
point was illustrated for the period 2008 – 2012: “In 2012, there were 44.5 births per 1,000 female Boston residents, ages 15-44. There was
no significant change in the Boston birth rate between 2008 and 2012. There was an increase in the birth rate among Latino women and
a decrease in the birth rate among White women from 2008 to 2012. In 2012, the rate of births to Black (64.7), Latino (66.3) and Asian
(38.8) women was higher compared to White women (33.3).” p. 160
14
Fertility rates were not reported in the 2000 or 2010 decennial census.
16 BuildBPS - Addendum: Demographics Utilizing a Racial, Ethnic, and Neighborhood LensThe chart below shows this same information graphically.
Birth to Women in the last 12 Months, 2010-2014
7%
3000
6.0%
6%
2500
5.1%
5%
2000
4%
3.0%
1500
2.7% 3%
1000
2%
500 2639 1%
2372 2179 627
White, not
Black Women Latina Women Asian Women Latina Women
0 0
The next table shows the number of persons in households who are under 18 years of age by race and ethnicity,
and as counted in the 2010 decennial census. It indicates, again, that the Black and Latino populations in Boston
are younger and represent higher proportions of young people. When looking at all households among the four
groups in Boston, 70% of Black and Latino households reported the presence of children under 18 years of age,
compared to only 21% of all Non-Latino White households.
Table 9:
Population in Families by Under 18 Years, 2010
Black % Black Latino % Latino Asian % Asian White % White
114,065 79,095 31,864 125,364
Under 18 years 37,754 33% 29,103 37% 7,146 22% 25,711 21%
18 years and over 76,311 67% 49,992 63% 24,718 78% 99,653 79%
When census tracts with this same information for the 2010–2014 ACS are thematically geocoded, it becomes
apparent that households with children under 18 years of age are concentrated in areas of Boston that are
predominantly Black and Latino. The following map shows that those census tracts with the highest proportions
of households with at least one child who is under 18 years are mostly found in East Boston, Mattapan,
Dorchester, Roxbury, and Hyde Park. Some of the areas in Map 1, showing the highest percentages of households
with persons under 18 years, are also those that are projected to have the largest families (Map 2: Average
Household Size) and families with the most children aged 0 to 17 years (Map 3) by 2021.15
15
Note: the green areas in the maps represent select open spaces and parks; Logan Airport is also shown, in East Boston.
BuildBPS - Addendum: Demographics Utilizing a Racial, Ethnic, and Neighborhood Lens 17Map 1:
Households with Persons Under 18 Years by Tract and Neighborhood16
16
“natural breaks” methodology was used to determine which value categories to use in composing maps. This
A
approach, generated by GIS software (MapInfo Version 15.2 and Pcensus Version 11.0) assures that the values
in the categories as close to the average of the category as possible. This means that the selected ranges reflect
the average for data values that are relatively close together. According to MapInfo this methodology was first
described an article by Jenks and Caspall, “Error on Choropleth Maps: Definition, Measurement, Reduction”
Annals of American Geographers (June 1971).
18 BuildBPS - Addendum: Demographics Utilizing a Racial, Ethnic, and Neighborhood LensMap 2 shows that larger families (i.e., those with an average household size greater than 2.5 persons)17 are
projected to reside and be concentrated in neighborhoods like Hyde Park, Mattapan, Dorchester, Roxbury,
and East Boston. Other neighborhoods will also have census tracts with relatively large family sizes, but not as
extensive as those just cited.
Map 2:
Average Household Size Projected to 2021
17
According to the 2010 – 2014 ACS the Average Household Size for Boston is 2.36 persons per household.
BuildBPS - Addendum: Demographics Utilizing a Racial, Ethnic, and Neighborhood Lens 19Map 3 shows how the number of 2021 projected households with children aged 0–17 years are distributed
throughout Boston’s neighborhoods and census tracts. While some neighborhood areas will have a relatively low
number of households with children 17 years and under, other parts of the City will have larger numbers, ranging
from 500 to more than 1,000 projected households.
Map 3:
Number of 2021 Projected Households with Children 0–17 Years
20 BuildBPS - Addendum: Demographics Utilizing a Racial, Ethnic, and Neighborhood Lenschildren aged 17 years and under living in Boston, or
Population Projections 16.8% of the total population of 617,594 persons. The
2021 population projections show that there will be
by Race, Ethnicity and approximately 738,868 persons living in Boston, of
which 148,606 (or approximately 20%) will be children
Neighborhoods18 aged 17 years and under.20 As important, however,
there are key differences among children by race,
The geocoding and analysis of population projections ethnicity, and where they happen to live, and these
for 2021 by census tracts and neighborhoods includes factors can have varying impacts on potential and
all children aged 0–4 years.19 The age categories used to future enrollment trends and projections. The latter is
project by race and ethnicity (Black, Latino, Asian, and reflected in Maps 4 through 21 in Appendix 3.
Non-Latino White) and by tracts and neighborhoods
include: under 5 years of age; 5 to 9 years of age; 10 The maps show that:
to 14 years of age; and 15 to 19 years of age. The maps 1) C
ertain neighborhood areas hold a considerable
pertaining to this section (Appendix 3) also show the proportion of very young children the City. In terms
location of BPS schools (blue dots). of the number of projected children who are aged
0–4 years, Map 4 shows that the majority will reside
Population projections for 2021 and by census tracts in parts of Roxbury, Dorchester, Mattapan, Hyde
for Boston yield a total population of approximately Park, East Boston, and to a lesser extent, Allston-
738,000 persons, within the range reported by the Brighton.
Boston Redevelopment Authority for 2030 of 723,500
persons and the Donahue Institute of 752,000 for 2030. 2) Another finding emerging from the maps and data
The latter two projections are citywide; the population in Appendix 3 is that the distribution of children by
projections for 2021 used here report projections at race and ethnicity, based on population projections,
the census tract level in Boston. This produces some is also associated with geography in Boston. Maps
differences with information reported in the BuildBPS 5 through 8 show that parts of Boston, and certain
Demographics Advisory Committee Report (November neighborhoods in particular, will claim the largest
2, 2016). For instance, the latter states that “…growth proportion of Black children in these age categories.
is occurring among older segments of the population, These include Hyde Park, Mattapan, Dorchester,
not among younger segments.” However, there is still Roxbury. Black children will continue to be
some growth of younger groups when 2021 population concentrated in these neighborhood areas for at
projections are compared to the 2010 decennial census least the next several years.
and the 2010–2014 ACS.
3) W
hile slightly more “spread out” than Black
Generally, there will be a significant number of children, the majority and concentration of Latino
children living in Boston based on the population children will reside in Hyde Park, Mattapan,
projections for 2021 by census tracts. According Roslindale, Roxbury, South End, East Boston, and
to the 2010 decennial census, there were 103,710 parts of Dorchester (see Maps 9 through 12).
18
opulation estimates represent how demographers determine the size of the current population; population projections represent how
P
they believe the population will grow and look like, over a period of time. For the most part, projections are categorized within five year
periods, beginning with 0–5 years. Projections are noted separately for males and females due to differences in survival rates and fertility;
for purposes of presentation I combined male and female values in generating the maps, and in summarizing some of the raw data in
Appendices 2; 3; 4; 5; and 6.
19
According to Population Projections published by the Census (www.census.gov; January 23, 2014): “Population projections are typically
based on an estimated population consistent with the most recent decennial census and are produced using the cohort-component
method…Projections illustrate possible courses of population change based on assumptions about future births, deaths, net international
migration, and domestic migration…Estimates are for the past and present, while projections are based on assumptions about future
demographic trends.” See, “2014 National Population Projections: Summary Tables.” Population projections specifically for census tracts
projected for Boston to 2021 were exported from GeoLytics, Inc., Branchburg, NJ Estimates Professional 2016/2021, and produced in
2016.
20
The 2000 decennial census for Boston reported 115,874 children, or 19.7% of a total population of 589,141 persons.
BuildBPS - Addendum: Demographics Utilizing a Racial, Ethnic, and Neighborhood Lens 214) T
hese population projections indicate that Asian children will be
concentrated in parts of Allston-Brighton, Charlestown, Central
(which includes Chinatown), South End, Jamaica Plain, and parts of
Dorchester. Other parts of Boston are not projected to have relatively
high numbers of Asian children (see Maps 13 through 16).
5) N
on-Latino White children are projected to be concentrated in West
Roxbury, South Boston, Back Bay – Beacon Hill, Fenway – Kenmore,
and parts of Allston-Brighton, Charlestown, Jamaica Plain, and parts
of Dorchester. Very low numbers of Non-Latino White children are
projected to be living in parts of Hyde Park, Mattapan, Roxbury, and
parts of Dorchester (see Maps 17 through 20).
Grade Enrollment and Capture Rate
The BuildBPS Demographics report provides the following Exhibit 4, to state that, between 2006 and 2016, the
“proportion of K-12 students enrolled in BPS has been declining over time.” The decline is only 1.9% over this
period, though, and some years during this period reflected little change, when using 2006–2007 as the base year.
In fact, some grade levels indicated an increase during this period (see K2; Grades 1, 2, 3, 4, and 12).
Exhibit 4
In-District and Out-of-District Enrollment SY15-16 (as of mid-December 2015)
In-District Grand
Enrollment by K0 K1 K2 01 02 03 04 05 06 07 08 09 10 11 12 Total
Allston-Brighton 42 128 179 214 182 186 165 150 165 196 151 251 191 163 185 2,548
Back Bay/BH 2 10 19 17 14 18 13 11 9 14 14 10 8 13 8 180
Central Bos 10 35 94 101 85 79 61 65 58 64 51 56 56 65 57 937
Charlestown 7 51 144 152 149 141 118 101 114 108 106 110 99 95 97 1,592
Dorchester 86 504 803 887 922 894 894 742 740 772 782 947 917 911 1,020 11,821
East Boston 59 252 511 548 552 587 491 420 396 379 365 587 484 450 426 6,507
Fenway/Kenmore 5 13 30 45 42 43 27 23 23 19 28 28 31 27 16 400
Hyde Park 31 163 221 267 244 240 253 191 195 202 217 284 281 308 347 3,444
Jamaica Plain 20 140 223 254 221 228 218 186 179 179 188 198 201 212 235 2,882
Mattapan 51 197 347 419 405 396 350 335 328 345 336 469 413 415 476 5,282
Roslindale 32 178 252 295 294 292 258 207 204 247 214 275 260 289 308 3,605
Roxbury 77 431 745 784 867 799 774 591 595 639 620 772 719 688 769 9,870
South Boston 11 104 122 173 168 169 144 130 126 136 133 154 154 128 145 1,997
South End 22 77 189 172 214 223 193 169 161 197 160 208 192 182 207 2,566
West Roxbury 16 169 240 202 226 209 170 174 130 177 157 215 180 186 199 2,650
Other 3 3 3 9 17 21 18 14 14 16 14 20 30 24 33 239
In-District Total 474 2,455 4,122 4,539 4,602 4,525 4,147 3,509 3,437 3,690 3,536 4,584 4,216 4,156 4,528 56,520
The BuildBPS Advisory Committee Report also states that “population growth is largest in areas that don’t impact
K-12 growth.” However, Exhibit 2 below shows that, while not growing at the rate of 25-to-34-year-olds, the under
5 and 5-to-9-year-old segments continue to grow. Moreover, it might also show growth for youth 15 to 17 years of
age, but the latter is not shown.
22 BuildBPS - Addendum: Demographics Utilizing a Racial, Ethnic, and Neighborhood LensFindings: Population by Age
2. Population growth is largst in areas that don’t impact K=12 growth.
Exhibit 2: Population Age Structure
85 and over
75 to 84
65 to 74
60 to 64
55 to 59
45 to 54
35 to 44
25 to 34
20 to 24
15 to 19
10 to 14
5 to 9
Under 5
0 20,000 40,000 60,000 80,000 100,000 120,000 140,000 160,000
2014 est. 2010
Growing or declining enrollment is not uniform across Jennings Highlighted
all grade levels. For instance, note the following table
showing enrollment changes based on the numbers
reported by grade levels:
2006–2016 Enrollment Changes for All Grades
K2 6.6%
Grade 1: 8.9%
Grade 2: 14.8%
Grade 3: 12.7%
Grade 4: 8.4%
Grade 5: 8.3%
Grade 6: -7.1%
Grade 7: -11.7%*
Grade 8: -17.4%
Grade 9: -19.2%
Grade 10: -7.9%
Grade 11: -5.1%
Grade 12: +8.8%
K2-12: -1.9% Jennings Highlighted
BuildBPS - Addendum: Demographics Utilizing a Racial, Ethnic, and Neighborhood Lens 23Enrollment changes differ significantly across grade The next two maps (Map 21 and Map 22) help to
levels. It seems that grades 7 to 9 contributed greatly illustrate this observation. The first shows that there
to lower enrollment patterns between 2006 and 2016. were 22 census tracts where half or more of all children
What explains this statistical finding? Who are the enrolled in kindergarten were attending a private
families and children leaving during these grade years? school, and 127 tracts showing that a relatively small
Are they Non-Latino White families residing in certain proportion of kindergarten children were in private
parts of the City? Does decline reflect any racial or schools. Clearly, though, these census tracts are based
ethnic differences among those leaving? Why do a in certain planning districts and neighborhood areas.21
significant proportion of families leave during these The former are located in a few neighborhoods that
years? Do families who leave the BPS system during happen to be where most Non-Latino White children
the middle-school years return? Are charter schools reside. Map 22, showing the proportion of children in
having an impact on these enrollment patterns by grade grades 1 to 4 who are enrolled in private schools and
level? Possible explanations could be the expansion of where they reside, also suggests that capture rates vary
private school grades and capacity, or out-migration by neighborhood areas.
of students and families to other communities. These
questions have not been addressed fully and should be
explored further.
Another enrollment-based discussion focuses on
“capture rates.” The BuildBPS Demographics report
states that the “district’s capture rate has averaged
52.8%” (p. 29). A district-wide capture rate, however,
hides differing capture rates by neighborhoods, and
as a result, probably also by race and ethnicity. Some
neighborhoods reflect a much higher proportion of
children attending private or parochial schools at
earlier ages, resulting in a lower capture rate. But the
capture rate for neighborhoods like Mattapan, Roxbury,
East Boston, and others are much higher than other
neighborhoods in Boston.
21
ccording to the ACS 2014 Subject Definitions, “Private schools are defined as schools supported and controlled
A
primarily by religious organizations or other private groups”. Public schools are “any school or college controlled
and supported primarily by a local, county, state, or federal government” (p.118)
24 BuildBPS - Addendum: Demographics Utilizing a Racial, Ethnic, and Neighborhood LensMap 21:
% All Kindergarteners Enrolled in Private
Schools by Tracts and Neighborhoods
BuildBPS - Addendum: Demographics Utilizing a Racial, Ethnic, and Neighborhood Lens 25Map 22:
% All Grades 1–4 Enrolled in Private Schools by Tracts and Neighborhoods
26 BuildBPS - Addendum: Demographics Utilizing a Racial, Ethnic, and Neighborhood LensConclusion: Adding Race, Ethnicity, and
Neighborhood Info to BuildBPS Demographics
This Addendum helps to expand some of the be an acknowledgement that not all children or groups
enrollment analysis and conclusions in the BuildBPS are the same in terms of demographic characteristics,
Demographics report by examining racial, ethnic, and and there should be more emphasis on investigating
spatial dimensions pertaining to Boston. It presents enrollment patterns and trends by grades, as well as by
data and raises questions that are critical for ensuring different groups of children and students.
comprehensive and equitable decision-making related
to current and future enrollment patterns. The findings This kind of framework can be utilized to more
can represent a framework, or even a guidepost, as adequately assess the potential impacts of planning
planning and decision-making is undertaken. In terms related to enrollment trends on children and families.
of current and future planning, this report points to It can also help to build trust and improve the quality of
the importance of not overlooking or minimizing race, public deliberation in ways that will benefit all Boston
ethnicity, and geography when examining and assessing Public Schools students, regardless of race or ethnicity,
issues and challenges. More specifically, there should or where they happen to live.
Appendix 1: BPS Map of All Schools (accessed at: www.bostonpublicschools.org)
BuildBPS - Addendum: Demographics Utilizing a Racial, Ethnic, and Neighborhood Lens 27Appendix 2:
Areas Designated as 26
Neighborhoods in Boston and
Location of Public Schools
Appendix 3: Maps 4–20 Population Projections by Age, Race, Ethnicity and Neighborhoods
Map 4: 2021 Population Projection for All Children, 0–4 Years
Map 5: 2021 Black Proportion of All 0–4 Years by Tracts and Neighborhoods
Map 6: 2021 Black Proportion of All 5–9 Years by Tracts and Neighborhoods
Map 7: 2021 Black Proportion of All 10–14 Years by Tracts and Neighborhoods
Map 8: 2021 Black Proportion of All 15–19 Years by Tracts and Neighborhoods
Map 9: 2021 Latino Proportion of All 0–4 Years by Tracts and Neighborhoods
Map 10: 2021 Latino Proportion of All 5–9 Years by Tracts and Neighborhoods
Map 11: 2021 Latino Proportion of All 10–14 Years by Tracts and Neighborhoods
Map 12: 2021 Latino Proportion of All 15–19 Years by Tracts and Neighborhoods
Map 13: 2021 Asian Proportion of All 0–4 Years by Tracts and Neighborhoods
Map 14: 2021 Asian Proportion of All 5–9 Years by Tracts and Neighborhoods
Map 15: 2021 Asian Proportion of All 10–14 Years by Tracts and Neighborhoods
Map 16: 2021 Asian Proportion of All 15–19 Years by Tracts and Neighborhoods
Map 17: 2021 White (not Latino) Projection of All 0–4 Years by Tracts and Neighborhoods
Map 18: 2021 White (not Latino) Projection of All 5–9 Years by Tracts and Neighborhoods
Map 19: 2021 White (not Latino) Projection of All 10–14 Years by Tracts and Neighborhoods
Map 20: 2021 White (not Latino) Projection of All 15–19 Years by Tracts and Neighborhoods
28 BuildBPS - Addendum: Demographics Utilizing a Racial, Ethnic, and Neighborhood LensMap 4:
2021 Projection All 0–4 Years by Tracts and Neighborhoods
BuildBPS - Addendum: Demographics Utilizing a Racial, Ethnic, and Neighborhood Lens 29Map 5:
2021 Projection of All Black 0–4 Years
30 BuildBPS - Addendum: Demographics Utilizing a Racial, Ethnic, and Neighborhood LensMap 6:
2021 Projection of All Black 5–9 Years
BuildBPS - Addendum: Demographics Utilizing a Racial, Ethnic, and Neighborhood Lens 31Map 7:
2021 Projection of All Black 10–14 Years
32 BuildBPS - Addendum: Demographics Utilizing a Racial, Ethnic, and Neighborhood LensMap 8:
2021 Projection of All Blacks 15–19 Years
BuildBPS - Addendum: Demographics Utilizing a Racial, Ethnic, and Neighborhood Lens 33Map 9:
2021 Proportion of All Latinos 0–4 Years
34 BuildBPS - Addendum: Demographics Utilizing a Racial, Ethnic, and Neighborhood LensMap 10:
2021 Proportion of All Latinos 5–9 Years
BuildBPS - Addendum: Demographics Utilizing a Racial, Ethnic, and Neighborhood Lens 35Map 11:
2021 Proportion of All Latinos, 10–14 Years
36 BuildBPS - Addendum: Demographics Utilizing a Racial, Ethnic, and Neighborhood LensMap 12:
2021 Proportion of All Latinos, 15–19 Years
BuildBPS - Addendum: Demographics Utilizing a Racial, Ethnic, and Neighborhood Lens 37Map 13:
2021 Proportion of All Asians, 0–4 Years
38 BuildBPS - Addendum: Demographics Utilizing a Racial, Ethnic, and Neighborhood LensMap 14:
2021 Proportion of All Asians, 5–9 Years
BuildBPS - Addendum: Demographics Utilizing a Racial, Ethnic, and Neighborhood Lens 39Map 15:
2021 Proportion of All Asians, 10–14 Years
40 BuildBPS - Addendum: Demographics Utilizing a Racial, Ethnic, and Neighborhood LensMap 16:
2021 Proportion of All Asians, 15–19 Years
BuildBPS - Addendum: Demographics Utilizing a Racial, Ethnic, and Neighborhood Lens 41Map 17:
2021 Proportion of All Non-Latino Whites, 0–4 Years
42 BuildBPS - Addendum: Demographics Utilizing a Racial, Ethnic, and Neighborhood LensMap 18:
2021 Proportion of All Non-Latino Whites, 5–9 Years
BuildBPS - Addendum: Demographics Utilizing a Racial, Ethnic, and Neighborhood Lens 43Map 19:
2021 Proportion of All Non-Latino Whites, 10–14 Years
44 BuildBPS - Addendum: Demographics Utilizing a Racial, Ethnic, and Neighborhood LensMap 20:
2021 Proportion of All Non-Latino Whites, 15–19 Years
BuildBPS - Addendum: Demographics Utilizing a Racial, Ethnic, and Neighborhood Lens 45You can also read