HIDDENLEVERS 2020 MODEL PERFORMANCE REVIEW
←
→
Page content transcription
If your browser does not render page correctly, please read the page content below
HiddenLevers 2020
Model Performance Review
CONTENTS

KEY FINDINGS……………………...….……………………. 2

MODEL OVERVIEW………………………………………… 3

MODEL COMPARISON…………………………………….. 4

2020 COVID19 PANDEMIC ………..……………………… 5

2014 OIL PRICE DECLINE………………………………… 12

HISTORICAL SCENARIO RESULTS…………………….. 17

CONCLUSION………………………………………………. 22

ADDENDUM…………………………………………………. 23

HiddenLevers.com | info@hiddenlevers.com | 800-277-4830   1

HiddenLevers Stress Testing Model
Performance Review

 HiddenLevers’ model                In the 2020 COVID19                   This review builds on a
 projected direction and            crash, the model projected            securities list first
 magnitude of impact in             performance within 5% of              published in a 2015
 95% of cases studied               actual results for 15 of 16           review, preventing
 across scenarios                   securities across travel,             selection bias for 2020
 ranging from Oct 1987              hospitality, energy, tech,            scenario or other past
 through March 2020.                and other sectors.                    scenarios.

HiddenLevers’ Model Performance: HiddenLevers tested its model using a range of stocks,
ETFs, and mutual funds across five different scenarios. The model correctly projected the
direction and magnitude of returns in 95% of the 83 directly comparable cases studied, while
also falling within 5% of actual historical returns in 75% of cases studied.

HL vs. traditional models – What’s the difference? Monte Carlo and Value at Risk are two
widely used models, yet neither accounts for tail risk or scenarios in which traditional
relationships in the economy break down. HiddenLevers provides scenario-based portfolio
stress testing, which can account for a wider range of risk factors than traditional models.

HL model shines in complex, divergent scenarios: The COVID19 crash was among the
fastest in market history, with a particularly severe impact on the hospitality, travel, and energy
industries. Monte Carlo and VaR models don’t measure the impact of oil prices, airline travel, or
other indicators, rendering them incapable of making meaningful projections in this environment.
HiddenLevers’ model captured these nuances, projecting direction and magnitude correctly for a
wide range of securities across stocks, ETFs, and mutual funds.

HiddenLevers.com | info@hiddenlevers.com | 800-277-4830                                               2
1. MODEL COMPARISON
HiddenLevers uses a scenario-based approach which relies on correlations between dozens of
levers (economic indicators) and assets, while competing models like Monte Carlo and VaR
often rely only on expected return and standard deviation for different asset classes. A brief
overview of the HiddenLevers model and a comparison to traditional models is provided below.

1.1 HiddenLevers Model Overview

                                                 1. Find the Connections
                                                 HiddenLevers uses big data to measure
                                                 millions of relationships between the economy
                                                 and investments. Interest rates affect home
                                                 sales and oil prices, which impact the price of
                                                 Home Depot stock. We uncover these links
                                                 for 35,000+ investments.

                                                 2. Ask the Big What-ifs
                                                 HiddenLevers creates scenarios to model
                                                 recessions, crises, and other economic
                                                 events, using historical research and analysis
                                                 on how economic indicators are correlated. A
                                                 scenario is defined from this research as a
                                                 series of up-or-down movements in the
                                                 levers.

                                                 3. Model the Impacts
                                                 In a stress test, investment performance is
                                                 projected using the relationships measured in
                                                 step 1, applied to the scenario assumptions in
                                                 step 2. If a scenario forecasts oil to rise, and
                                                 Exxon is correlated with oil, then Exxon will
                                                 rise in that scenario.

HiddenLevers.com | info@hiddenlevers.com | 800-277-4830                                          3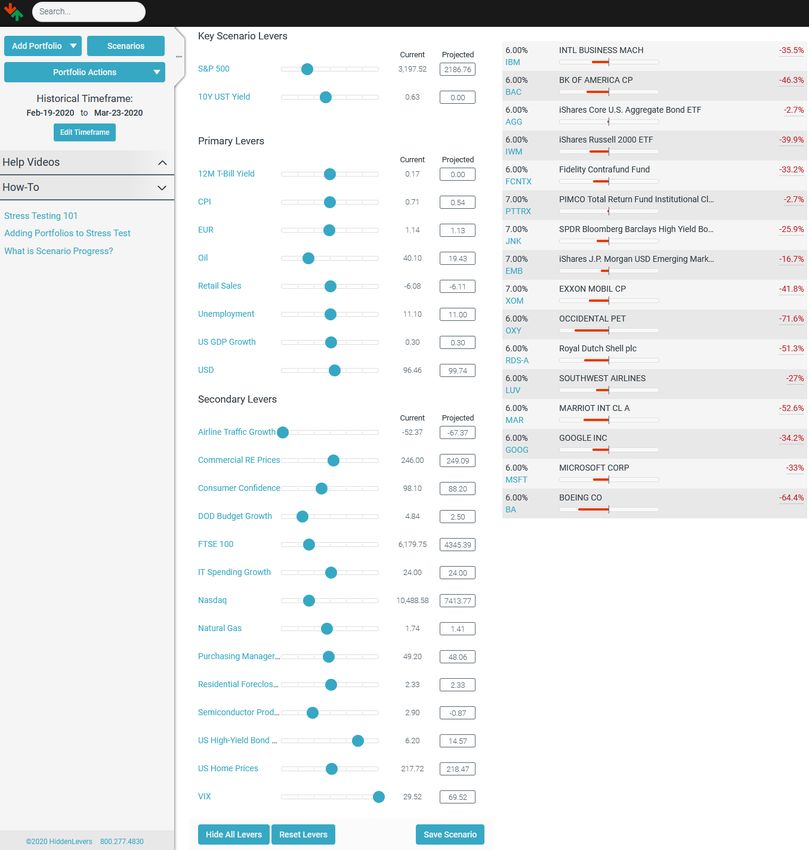
1.2 Comparison to Monte Carlo and VaR

Since the HiddenLevers model measures the relationship between a wide range of levers and
each individual asset, it is capable of projecting the potential impact of these forces on a
portfolio.

       Monte Carlo: Monte Carlo-style models generally use the expected return and standard
       deviation of an asset class to engage in a large number of probabilistic projections of an
       asset’s returns. The advantage of this simple approach is that it relies on very few inputs
       and can be used to quickly create a range of projected “paths” that an asset’s returns
       might take over time. The disadvantage of this approach is that Monte Carlo has no
       concept of oil prices or any other economic factor, and cannot take economic shocks
       into account in any meaningful way. Monte Carlo models will typically produce results
       showing a 95% confidence interval around projected returns, but will fail to take into
       account macro-economic tail risks entirely.

       Value at Risk: Value at risk models attempt to estimate the potential downside risk to a
       portfolio by calculating each individual asset’s potential loss range over a specified
       timeframe. Most value at risk models calculate the potential losses for a particular asset
       in a probabilistic manner similar to Monte Carlo, with no macro-economic input, and with
       a fixed view of potential downside from a standard deviation perspective. The advantage
       of VaR models is that they can be used to generate a single potential loss number for a
       portfolio (hence the name). The disadvantages were seen in 2008, when a tail-risk event
       like the financial crisis shocked individual securities beyond a traditional 2 or 3 standard
       deviation cut-off.

Conditional VaR models help to quantify tail-risk in a portfolio, but generally do not attempt to
account for differences in various economic outcomes. For instance, falling interest rates and oil
prices may be beneficial to certain portfolio holdings, and harmful to others – but which ones?
An economic scenario like the COVID19 pandemic impacts different industries in very different
ways - HiddenLevers attempts to answer these questions, while most traditional models do not.

HiddenLevers.com | info@hiddenlevers.com | 800-277-4830                                           4
2. 2020 COVID19 PANDEMIC SCENARIO
HIDDENLEVERS SUCCESSFULLY MODELED THE 2020 COVID19
CRASH AND SUBSEQUENT RECOVERY, PRODUCING MEANINGFUL
RESULTS FOR ALL SIXTEEN SECURITIES STUDIED DURING ONE OF
THE MOST RAPID CORRECTIONS IN MARKET HISTORY.

2.1 2020 COVID19 Pandemic Scenario Background

                                                     The sharp decline in US markets beginning
                                                     Feb 19th, 2020 posed numerous challenges for
                                                     stress testing models. The market crashed due
                                                     to the economic shock of a shutdown of the
                                                     US economy to combat the COVID19
                                                     pandemic. This led to a 95% reduction in air
                                                     travel peak-to-trough, a nearly 50% decline in
                                                     gasoline consumption, and substantial impacts
                                                     to in-person retail, hospitality, entertainment,
                                                     and health care. Meanwhile many technology
                                                     stocks were less impacted, as the new work-
 Figure 1: Trends in 2020 Airline Traffic
                                                     from-home paradigm increased their sales.

                                                     Traditional factor models, Monte Carlo and
                                                     VaR models generally do not include any
                                                     analysis of economic indicators like air travel,
                                                     and many do not include oil prices or other
                                                     macro factors at all. As a result, these models
                                                     would likely understate the impact of the crisis
                                                     on hard-hit sectors, lumping all equities
                                                     together in terms of performance.
 Figure 2: March-May 2020 Elective Surgery decline

HiddenLevers.com | info@hiddenlevers.com | 800-277-4830                                                 5
2.2 How the Model Copes with A Novel Crisis
Since HiddenLevers separates the impact of each variable in its model, it is more robust to
unexpected environments in which usually minor variables might take a star turn, or in which
factors might move in opposing directions. The HiddenLevers model has taken a novel
approach to solve problems frequently found in multivariate regression models, resulting in a
model that can better handle these issues.

Coefficient results (e.g. oil beta, air traffic beta, retail sales beta) from initial regressions are
combined in an estimation model that uses the correlation between the independent variables to
scale their relative impacts. This model approach is particular to HiddenLevers, and the
approach has met with considerable success in real life conditions. By breaking apart the
estimation of the variables, and recombining and scaling the results in the estimation process,
HiddenLevers has created a model that is more robust to unexpected economic environments
that are dissimilar to the historical data used for the regressions.

The model also utilizes an approach similar to principle-components analysis, wherein the most
important factor impacting a particular security is modeled as the “principle” factor, with other
factors treated as secondary. This enables the model to better handle scenarios like COVID19,
where a 95% drop in air travel can become the principle factor for certain securities, enabling
better forecasting of the resulting shock.

2.3 Stress Test Inputs and Results Summary
HiddenLevers stress testing functionality is capable of running historical timeframes, in which
the model replays the economic conditions occurring over a specific set of dates:

Figure 3: This HiddenLevers screenshot shows the 2020 COVID19 historical timeframe of February 19th, 2020 to March 23rd, 2020

HiddenLevers.com | info@hiddenlevers.com | 800-277-4830                                                                         6
As seen in the screenshot above, the 2020 COVID19 Pandemic scenario models the impact of
economic changes that occurred from February 19th, 2020 to March 23rd, 2020.

The economic factor changes in the economy start from current levels, and replay the
percentage change impacting economic lever. The model uses these factor changes to project
how securities would react if the same conditions occurred again today. By comparing the
model projections with actual historical performance, the model’s accuracy can also be
measured. Since the model is forward looking, the projections end at a different point, but
the percentage changes in factors are identical to that which occurred over the historical
time period, enabling a comparison of model performance and actual performance.

In total 16 different securities were modeled, including equity funds and ETFs, fixed income
funds and ETFs, energy companies, hospitality and travel companies, and large-cap
technology, financial, and industrial firms:

 Security Type                             Symbol                                 Name
                                           MAR                                    Marriott International Inc
                                           LUV                                    Southwest Airlines
                                           BA                                     Boeing Co
 Hospitality, Travel, and                  XOM                                    Exxon Mobil Corporation
 Energy Stocks                             OXY                                    Occidental Petroleum
                                                                                  Corporation
                                           RDS-A                                  Royal Dutch Shell PLC ADR
                                                                                  Class A
                                           IBM                                    IBM
 US Large Cap Stocks                       BAC                                    Bank of America
                                           GOOG                                   Alphabet Inc
                                           MSFT                                   Microsoft
 Equity ETFs and Funds                     FCNTX                                  Fidelity Contrafund Fund
                                           IWM                                    iShares Russell 2000
                                           AGG                                    PIMCO Total Return Fund I
                                           PTTRX                                  SPDR Barclays Capital High
                                                                                  Yield Bond ETF
 Fixed Income ETFs and Funds JNK                                                  SPDR Barclays Capital High
                                                                                  Yield Bond ETF
                                           EMB                                    iShares TR JPMorgan USD
                                                                                  Emerging Markets Bond ETF
Table 1: A table showing the 16 securities modeled in the 2020 COVID19 scenario

HiddenLevers.com | info@hiddenlevers.com | 800-277-4830                                                        7
In 100% of these stress tests, the HiddenLevers model correctly projected the direction and
magnitude of security performance, and in all but one case, the model projected return fell
within 5% of the actual historical performance. The stress results for each subgroup of
securities is discussed in detail below.

2.4 Results: US Hospitality, Travel, and Energy Stocks
The table below shows model projections in comparison with actual performance for six
companies particularly impacted in the Q1 2020 crash – these companies all derive a majority of
their revenue from lodging, air travel, liquid fuel sales, or supporting industries.

                                                               Actual                 HL Projected               Difference
                                                               Performance (%)        Performance (%)
 XOM                       Exxon Mobil                         -47                    -42                        -5
 OXY                       Occidental Petroleum                -76.5                  -71.6                      -4.9
 RDS-A                     Royal Dutch Shell                   -46.6                  -51.3                      4.7
 LUV                       Southwest Airlines                  -40.7                  -27                        -13.7
 MAR                       Marriot International               -52.3                  -52.6                      0.3
 GOOG                      Alphabet Inc                        -33.7                  -34.2                      0.5
 MSFT                      Microsoft                           -33.79                 -33                        -0.79
 BA                        Boeing                              -68.8                  -64.4                      -4.4
Table 2: A table displaying the 8 Hospitality, Travel, and Energy securities used in the 2020 COVID19 scenario

In 7 of the 8 comparisons above, the HiddenLevers model provided results within 5% of the
actual historical performance, and the direction and magnitude of the model projections was
accurate in 100% of these cases.

With respect to energy companies, the model handled the combined impact of falling equity
markets and falling oil prices well, providing results within 5% of actual performance even for
Occidental Petroleum, whose stock fell over 75% during the period.

Among travel related companies, the projection for Boeing also fell within 5% of actual
performance – here the model combined the negative impacts of a falling S&P 500, a crash in
air travel, and a drop in defense spending to accurately project Boeing’s performance. With
Southwest Airlines, the model projected substantial losses in both cases, but underestimated
the crisis impact relative to actual performance. For Southwest, the model over-estimated the
positive influence of falling oil prices on LUV, causing it to produce an overly bullish projection.

For Marriott the model was quite precise, with a model projection error of only 0.3% relative to
an actual historical drop of 52.3% during the period. How did the HiddenLevers model manage
to nail its projection of Marriott’s performance using only the economic lever changes as
inputs?

HiddenLevers.com | info@hiddenlevers.com | 800-277-4830                                                                       8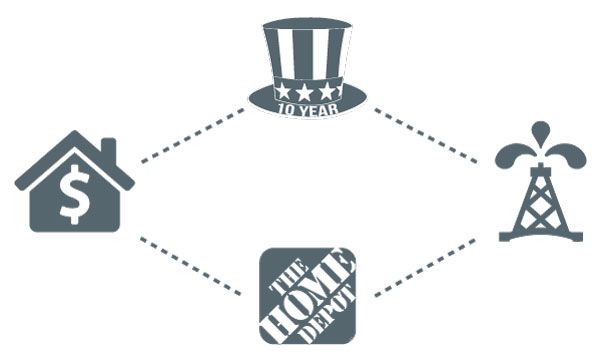
HiddenLevers identified a key factor strongly
                                                                           correlated with Marriott’s performance:
                                                                           consumer confidence.

                                                                           The model combined the negative impacts of
                                                                           a falling S&P 500, falling air travel, and falling
                                                                           US consumer confidence to produce a highly
                                                                           accurate projection for Marriott in this
                                                                           scenario. While models can never be
                                                                           completely accurate, this example shows
  Figure 4: Marriot vs Consumer Confidence from 2010 to 2020               how HiddenLevers’ use of a broader range of
                                                                           economic factors can improve projection
                                                                           accuracy beyond traditional models.

2.5 Results: Other US Large-Cap Stocks

                                                                      Actual               HL Projected      Difference
                                                                      Performance (%)      Performance (%)
 IBM                         IBM                                      -37.4                -35.5             -1.9
 BAC                         Bank of America                          -46.91               -46.3             -0.61
 GOOG                        Alphabet Inc                             -33.7                -34.2             0.5
 MSFT                        Microsoft                                -33.79               -33               -0.79
Table 3: The 4 US Large-Cap securities used in the 2020 COVID19 scenario

HiddenLevers’ stress testing model produced extremely accurate results for major US
technology and financial stocks in a replay of the Feb-Mar 2020 downturn. 3 of 4 securities
showed model projection errors of less than 100 basis points – very small errors given that the
actual performance downside was between 33% and 47% for all of these companies.

HiddenLevers.com | info@hiddenlevers.com | 800-277-4830                                                                    9
2.6 Results: Equity ETFs and Mutual Funds
Actual HL Projected Difference
Performance (%) Performance (%)
IWM iShares Russell 2000 -40.37 -39.9 -0.47
Index
FCNTX Fidelity Contrafund Fund -29.4 -33.2 3.8
Table 4: The two Equity ETFs used in the 2020 COVID19 scenario
Both IWM and FCNTX showed good model projection results in the stress test, with both
showing a difference versus actual performance of less than 4%. As an equity index ETF, IWM
would be expected to show accurate results, since its broad portfolio ensures that idiosyncratic
single-stock behavior is less likely to influence overall results. FCNTX outperformed relative to
the model’s projection, likely due to large holdings like AMZN (its top holding) which benefitted
as a result of the move to online shopping during the pandemic.
2.7 Results: Fixed Income ETFs and Mutual Funds
Actual HL Projected Difference
Performance (%) Performance (%)
AGG iShares Core US -1.37 -2.7 1.33
Aggregate Bond ETF
PTTRX PIMCO Total Return -2.6 -2.7 0.1
Fund Inst. Class
JNK SPDR Barclays Capital -22.7 -25.9 3.2
High Yield BND ET
EMB iShares TR / JPMorgan -21.27 -16.7 -4.57
USD Emerging Markets
Table 5: The four Fixed Income ETFs used in the 2020 COVID19 scenario
All four fixed income ETFs and funds showed good model projection accuracy, with all
projections within 5% of actual performance, and in the case of PTTRX only drifting by 0.1%.
The high-yield bond spread and VIX levers are essential in helping to model high yield bond
funds, since they are exposed to credit risk to an extent not sufficiently captured via S&P 500
beta alone. Investment grade bond funds like AGG and PTTRX tend to fluctuate mainly with
respect to interest rate risk – here the HiddenLevers model uses a duration + convexity-based
model, which performed well in this instance.
HiddenLevers.com | info@hiddenlevers.com | 800-277-4830 102.8 Modeling the Recovery: March 23 – July 31 2020
Stress testing models must be capable of handling both downside and upside scenarios to
prove useful to investors across investment environments. HiddenLevers modeled the
performance of the same sixteen securities during the recovery from the COVID crash – by July
31st the S&P 500 had moved decisively into positive territory for the year.
The full results produced by the model for the COVID Pandemic recovery scenario can be seen
in the table below. The model correctly projected direction in 100% of cases, and in 75% of
these stress tests the HiddenLevers model projected return fell within 5% of the actual historical
performance. HiddenLevers’ model performance was particularly strong with fixed income funds
and ETFs, with accurate projections for both investment grade and riskier bond funds, even as
funds like EMB and JNK rose over 25% during the period studied.
March 23 – July 31 2020
Actual HL Projected Difference
Performance (%) Performance (%)
IBM 34 39 -5
BAC 38.6 38.7 -0.1
AGG 6.98 7.2 -0.22
IWM 50.6 55.6 -5
FCNTX 52.3 56.5 -4.2
PTTRX 8.2 6.6 1.6
JNK 28 27.9 0.1
EMB 25.6 24.6 1
XOM 31 56.2 -25.2
OXY 76 98.7 -22.7
RDS-A 51.5 70.2 -18.7
LUV -8.42 -8.7 0.28
MAR 19.5 23 -3.5
GOOG 40.4 58.6 -18.2
MSFT 51.2 51.7 -0.5
BA 49.6 52.9 -3.3
Table 6: HiddenLevers model vs historical performance for COVID recovery scenario
The main source of error for the model in this recovery was in the projection of energy stocks’
recovery. Oil prices rose roughly 70% over the period, but Exxon, Occidental, and Shell did not
match those returns, in part because oil’s dramatic return only brought it back to $40/barrel –
still a challenging price for sustained profitability.
HiddenLevers.com | info@hiddenlevers.com | 800-277-4830 113. 2014 OIL DECLINE SCENARIO
Section 3 details HiddenLevers’ performance in the 2014 oil price decline, using the same 16
securities reviewed in section 2. This analysis was originally published in early 2015, and has
been updated with additional securities, while keeping the original results for the 11 securities
analyzed at that time.
HIDDENLEVERS SUCCESSFULLY MODELED THE 2014 OIL PRICE
DECLINE, PRODUCING MEANINGFUL RESULTS FOR 95% OF
SECURITIES STUDIED DESPITE A BREAKDOWN IN MARKET
CORRELATIONS.
3.1 Oil Price Decline Scenario Background
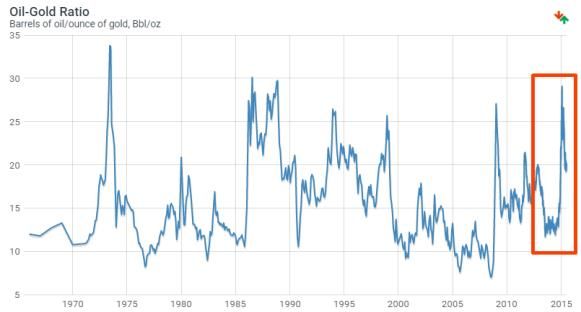
The decline in oil prices beginning mid-June 2014 poses
a number of challenges for stress testing models. The
general correlation between the S&P and oil over the
previous five years broke down rapidly, and
relationships between other commodities broke down as
well. Copper did not fall as fast as oil, while steel and
uranium prices rose, and gold was volatile but almost
flat over the period.
Figure 4: S&P 500 – Oil Relationship from June to December 2014 Traditional multiple regression models attempt to
measure the impact of all variables simultaneously. This
approach could provide inaccurate projections when the
historical correlation between variables breaks down. It
might even project a RISE in oil stocks in this scenario
(due to the impact of the S&P and other variables),
when in fact virtually all fell.
Meanwhile, Monte Carlo and VaR models usually don’t
include oil prices in their models at all. Because of this,
they might project a happy ending for all equities, given
Figure 5: The Oil-Gold Ratio, with 2014 spike highlighted the 8% rise in the S&P over the timeframe.
HiddenLevers.com | info@hiddenlevers.com | 800-277-4830 123.2 Model Results: June 1 2014 – Dec 1 2014 Oil Decline As described in Section 2.2, HiddenLevers separates the impact of each variable in its model, enabling more effective modeling in unexpected environments in which variables move in opposing directions. The chief divergence in 2014 was a breakdown in the correlation between oil prices and equity prices – the S&P and oil had moved together over the previous five years, but starting in mid- 2014 oil prices dropped by 50% while stock markets continued to rise. Since HiddenLevers breaks apart the process of estimating each variable’s impact from projecting investment performance, it was able to handle this divergence. In this scenario, the HiddenLevers model provided results with the correct direction and magnitude in 95% of cases studied, and provided projections within 5% of the actual historical performance in 75% of cases studied. Results for different subgroups of securities follow. HiddenLevers.com | info@hiddenlevers.com | 800-277-4830 13
3.3 Results for Major Oil Producers
Here are examples of the performance of three different oil companies (XOM, RDS-A, OXY)
during the recent environment, compared with actual performance June - Dec. 1st 2014.

Figure 6: HiddenLevers screenshot showing the historical 2014 Oil Decline Key Lever impacts projected outcome compared to actual outcome

In the HiddenLevers screenshot above, the economic levers at left have been set to represent
the same percentage moves for each indicator as occurred in the actual economy over the six
months ending 12/1/14. Since the model is forward looking, the projections end at a different
point, but the percentage changes are identical to that which occurred over the historical time
period, enabling a comparison of model performance and actual performance.

As shown above, the HiddenLevers model provides a very close estimate for the performance
of Royal Dutch Shell, and produces an error of less than 4% for Exxon Mobil, and around 6.5%
for Occidental Petroleum. The model is correct in order of magnitude and direction for all three
oil companies.

HiddenLevers.com | info@hiddenlevers.com | 800-277-4830                                                                               14
3.4 Results for Large Caps, ETFs, and Mutual Funds
The screenshot below shows model projections for the 13 remaining securities used in all
historical scenarios studied, with actual results provided for comparison:

                                                                                                         Model:   Actual:

                                                                                                                  +52.1%

                                                                                                                  +26%

                                                                                                                  -3.6%

                                                                                                                  +20%

                                                                                                                  -1.4%

                                                                                                                  -13%

                                                                                                                  +10.9%

                                                                                                                  +1.3%

                                                                                                                  +4%

                                                                                                                  +6.8%

                                                                                                                  +1.3%

                                                                                                                  -5.4%

                                                                                                                  -2.6%

    Figure 7: Screenshot showing Actual vs HL Projected Performance of 2014 Oil Price Decline Scenario

HiddenLevers.com | info@hiddenlevers.com | 800-277-4830                                                                     15
In 10 of 13 comparisons above, HiddenLevers provided results within 5% of the actual
performance, and the direction and magnitude of the model projections was accurate in all but
one of these cases. Google stands out as the only stock which dropped while the model
projected a 13.6% increase. This appears to be an instance of idiosyncratic risk – GOOG
performance may have been influenced by company specific factors unrelated to any
macroeconomic factor.
The model did a particularly good job
with Southwest Airlines (LUV) and IBM.
With LUV, the model was able to
combine the positive impact of falling oil
prices and a rising S&P 500 to project
an upward move of roughly 50%, in line
with the actual historical results.
How did HiddenLevers nail the
projection on IBM? One economic
headwind that IBM faced in 2014 was a
strong rise in the value of the dollar
Figure 8: The inverse correlation between IBM and USD, 2010 - 2015 (IBM does a significant percentage of
business overseas).
While this was not the only factor in IBM’s decline, the HiddenLevers model was able to use this
inverse correlation to project weakness in IBM despite the rising S&P 500, and as a result
provided an accurate model of IBM’s actual results.
3.5 Results for High Yield and other Bond Funds
HiddenLevers uses US high yield bond spreads (to treasuries) as an economic lever to gauge
risk in bond markets, improving the model’s ability to account for rising credit risk. The oil price
decline in 2014 resulted in a substantial spike in credit spreads, and since HiddenLevers
measures the correlation between bond funds and spreads, it was able to project the negative
impact to high yield bond funds like JNK and emerging market bond funds like EMB, while still
correctly projecting positive returns for investment grade bond funds like AGG and PTTRX.
HiddenLevers.com | info@hiddenlevers.com | 800-277-4830 164. HISTORICAL SCENARIO RESULTS
HIDDENLEVERS MEASURED MODEL PROJECTIONS AGAINST REAL
HISTORICAL RESULTS – THE MODEL ACCURATELY PROJECTED
RESULTS IN 75% OF THE 67 CASES STUDIED.
4.1 Historical Comparison Approach
HiddenLevers has backtested its model against historical scenarios in order to assess and
improve model accuracy. HiddenLevers uses the real-life percentage change in the economic
levers over a past time period in order to create a historical scenario. The historical scenario can
then be executed against a portfolio of investments, with the actual performance of each
investment over the historical time period compared against the model projection.
HiddenLevers historical scenarios essentially simulate what would happen if a historical event
were to replay again today, with today’s relationships between each security and lever. When
comparing actual and model results, it is important to note that the business of certain
companies may have changed significantly over time, and the compositions of funds may have
changed as well. Nonetheless, this form of back-testing is valuable as it enables us to gauge the
model’s performance against real-life events.
4.1 Definitions of Historical Scenarios
Five historical scenarios were studied, using the timeframes specified below:
1987 Market Crash:
Covers September 28 – October 19, 1987,
including the 20%+ one-day crash on October
19th, 1987.
HiddenLevers.com | info@hiddenlevers.com | 800-277-4830 171998 Russia Default:
Covers July 13 1998 – August 31 1998, a timeframe
encompassing the Russian sovereign default and the
losses which caused the LTCM hedge fund failure.
2008-2009 Financial Crisis:
Covers the core period of the financial crisis from just
prior to Lehman Brothers’ collapse to the market lows
(September 1st 2008 – March 9th 2009).
2014 Oil Price Decline:
Covers the six months from June 1st to December 1st 2014,
a period in which oil prices dropped nearly 50% while the
S&P 500 rose 8%.
2020 COVID19 Pandemic:
The crash covers the roughly one-month period from
February 19th – March 23rd, 2020, when the global
pandemic caused the S&P 500 to drop 33% over just 23
trading days, with the VIX index also hitting record levels
prior to Federal Reserve promises of unlimited
intervention.
The recovery covers the subsequent period from March
23rd, 2020 – July 31st, 2020, a period in which the market
rallied from the lows to be positive for 2020.
HiddenLevers.com | info@hiddenlevers.com | 800-277-4830 184.2 Model vs. Historical Results Comparison
The following tables and screenshots show the performance of 16 representative securities,
comparing HiddenLevers model projections versus actual returns for the six different historical
scenarios. Section 2 describes the comparative results for the 2020 COVID19 Pandemic
Scenario in greater detail, and Section 3 includes an update to previously published analysis on
the 2014 Oil Price decline scenario.
(Green highlighting indicates that model projection was within 5% of actual result)
Feb 19 – Mar 23 2020 Mar 23 – July 31 2020
Actual HL Projected Difference Actual HL Projected Difference
Performance (%) Performance (%) Performance (%) Performance (%)
IBM -37.4 -35.5 -1.9 34 39 -5
BAC -46.91 -46.3 -0.61 38.6 38.7 -0.1
AGG -1.37 -2.7 1.33 6.98 7.2 -0.22
IWM -40.37 -39.9 -0.47 50.6 55.6 -5
FCNTX -29.4 -33.2 3.8 52.3 56.5 -4.2
PTTRX -2.6 -2.7 0.1 8.2 6.6 1.6
JNK -22.7 -25.9 3.2 28 27.9 0.1
EMB -21.27 -16.7 -4.57 25.6 24.6 1
XOM -47 -42 -5 31 56.2 -25.2
OXY -76.5 -71.6 -4.9 76 98.7 -22.7
RDS-A -46.6 -51.3 4.7 51.5 70.2 -18.7
LUV -40.7 -27 -13.7 -8.42 -8.7 0.28
MAR -52.3 -52.6 0.3 19.5 23 -3.5
GOOG -33.7 -34.2 0.5 40.4 58.6 -18.2
MSFT -33.79 -33 -0.79 51.2 51.7 -0.5
BA -68.8 -64.4 -4.4 49.6 52.9 -3.3
Table 7: HiddenLevers model vs historical performance for Feb-Mar 2020 and Mar-July 2020 scenarios
HiddenLevers.com | info@hiddenlevers.com | 800-277-4830 19Jul 13 – Aug 31 1998 Sept 1 2008 – Mar 9 2009
Actual HL Projected Difference Actual HL Projected Difference
Performance (%) Performance (%) Performance (%) Performance (%)
IBM -9.5 -6.3 -3.2 -31 -51.7 20.7
BAC -33.2 -25.3 -7.9 -88 -83 -5
AGG N/A 0.2 1.6 -1.4 3
IWM N/A -22.6 -53 -58 5
FCNTX -18 -21 3 -38.8 -42.6 3.8
PTTRX 0.9 0.9 0 2.4 0 2.4
JNK N/A -33.7 -28.7 -5
EMB N/A -18.6 -20.7 2.1
XOM -7.2 -18.3 11.1 -19 -61 42
OXY -27.4 -31 3.6 -33.5 -87.3 53.8
RDS-A N/A -25.7 -35 -75.8 40.8
LUV -12.7 -14.9 2.2 -66.7 -20.9 -45.8
MAR -14 -24.6 10.6 -57.4 -71.3 13.9
GOOG N/A -22.1 -33.7 -45 11.3
MSFT -18.4 -21.3 2.9 -42.8 -43.4 0.6
BA -34.7 -37.8 3.1 -53.5 -49.1 -4.4
Table 8: HiddenLevers model vs historical performance for July-Aug 1998 and September 2008 – March 2009 scenarios
Jun 1 – Dec 1 2014 Oct 2 – Oct 19 1987
Actual HL Projected Difference Actual HL Projected Difference
Performance (%) Performance (%) Performance (%) Performance (%)
IBM -13 -13.2 0.2 -22.2 -25 2.8
BAC 10.9 3.9 7 -26.7 -35.7 9.03
AGG 1.3 1.4 -0.1 N/A -1.2
IWM 4 8.9 -4.9 N/A -30.7
FCNTX 6.8 5.9 0.9 -28.6 -27.4 -1.2
PTTRX 1.3 1.8 -0.5 -3.3 -0.9 -2.4
JNK -5.4 -6.2 0.8 N/A -18.4
EMB -2.6 4.1 1.5 N/A -11.1
XOM -6.25 -2.54 -3.71 -33 -28 -5
OXY -12 -10.8 -1.2 -32.5 -47.5 15
RDS-A -20.41 -27 6.59 N/A -36.8
LUV 52.1 49.1 3 -31.1 -27.9 -3.2
MAR 26 21.4 4.6 N/A -35.6
GOOG -3.6 13.1 -16.7 N/A -22.2
MSFT 20 13.6 6.4 -38 -21.3 -16.7
BA -1.4 -3.9 2.5 -25.4 -28.5 3.1
Table 9: HiddenLevers model vs historical performance for June – Dec 2014 and Oct 1987 scenarios
HiddenLevers.com | info@hiddenlevers.com | 800-277-4830 20The results in tables 6-8 include a range of large cap US equities (IBM, BAC, XOM, OXY, LUV, MAR, GOOG, MSFT, BA), one foreign large cap (RDS-A), investment grade bond funds and ETFs (AGG,PTTRX), two high yield ETFs (JNK, EMB), equities funds and ETFs (FCNTX, IWM). The diversity of securities and scenarios selected helps validate whether HiddenLevers’ model can cope with a wide range of securities and macro-economic environments. Out of 96 possible comparisons (16 securities x 6 scenarios), 13 are excluded as the ETFs or stocks in question did not yet exist. 83 available comparisons are used in the analysis of the HiddenLevers model and its overall accuracy. In 62 of 83 (75%) of comparable cases, the HiddenLevers model produced projections within five percentage points of the actual result. Most of the large-scale misses in projections occur with the financial crisis scenario, and in particular with modeling energy stocks during that crisis. Despite a 58% drop in oil prices from September 1 2008 to March 9 2009, Exxon Mobil (XOM) stock fell only 19%. RDS-A and OXY similarly outperformed oil prices substantially during the time-period. This did not occur in 2020, when oil company stocks crashed along with oil prices – and the HiddenLevers model was much more accurate with respect to these companies in the 2020 scenario as a result. Despite these challenges, even in these cases the HiddenLevers model did provide warning of significant downside risk exposure. In 82 of 83 (99%) of comparable cases, HiddenLevers’ model produced results where the directional projection of security performance matched the security’s actual directional performance (the sole outlier case was GOOG in 2014, when it idiosyncratically lost 3.6% during a timeframe in which the S&P rose 8%). In 78 of 83 (94%) of comparable cases, HiddenLevers projected the magnitude of gain or loss within 20% of the actual result. All of the larger error cases here were with respect to large double-digit percentage moves in the securities, so that a 15-20% difference reflects less than half the security’s actual percentage change. HiddenLevers.com | info@hiddenlevers.com | 800-277-4830 21
5. CONCLUSION

HiddenLevers periodically assesses the accuracy of its model against historical scenarios, and
has published herein results affirming the accuracy of the model across a wide range of
scenarios, including the 2008 financial crisis and recent 2020 pandemic-related market crash
and recovery. HiddenLevers’ model projections fell within 5% of realized returns in 75% of
directly comparable cases studied.

When assessing different stress testing methodologies, it’s important to ask, “But what happens
to this model when its assumptions break down?” Precisely this sort of test arose in late 2014,
as oil prices diverged from equities prices, and again in 2020, when air travel crashed far more
rapidly than at any other point in history. The HiddenLevers model proved capable of making
accurate projections for these kind of scenarios, and accurately projected returns for a wide
range of potential investments, including equity and fixed income funds, and a variety of large
cap equities spread across sectors.

Users of HiddenLevers’ model benefit from periodic model reviews published by HiddenLevers,
as this places documentation of the model’s accuracy in the public record. In preparing the 2020
model review, HiddenLevers utilized the same securities previously used in the 2015 model
review, while adding new securities and stress testing the full set against all scenarios. Taking
this approach ensures that HiddenLevers cannot select securities or scenarios that will produce
overly optimistic results – the majority of securities reviewed for 2020 were selected in 2015.
HiddenLevers continues to improve its model, adding new levers and refining projection
capabilities as a result of user feedback and our internal model review process. Please reach
out with questions, comments, and feedback to help us push the model forward!

THANK YOU.
FOR MORE INFORMATION CONTACT:

HiddenLevers

INFO@HIDDENLEVERS.COM

800-277-4830

HiddenLevers.com | info@hiddenlevers.com | 800-277-4830                                       22
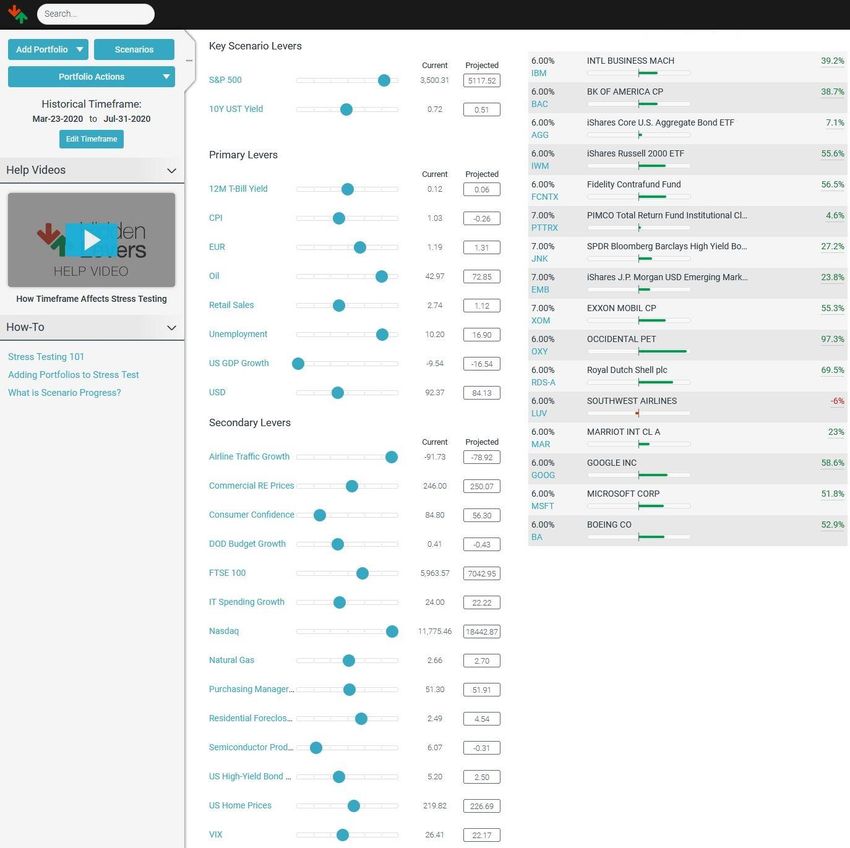
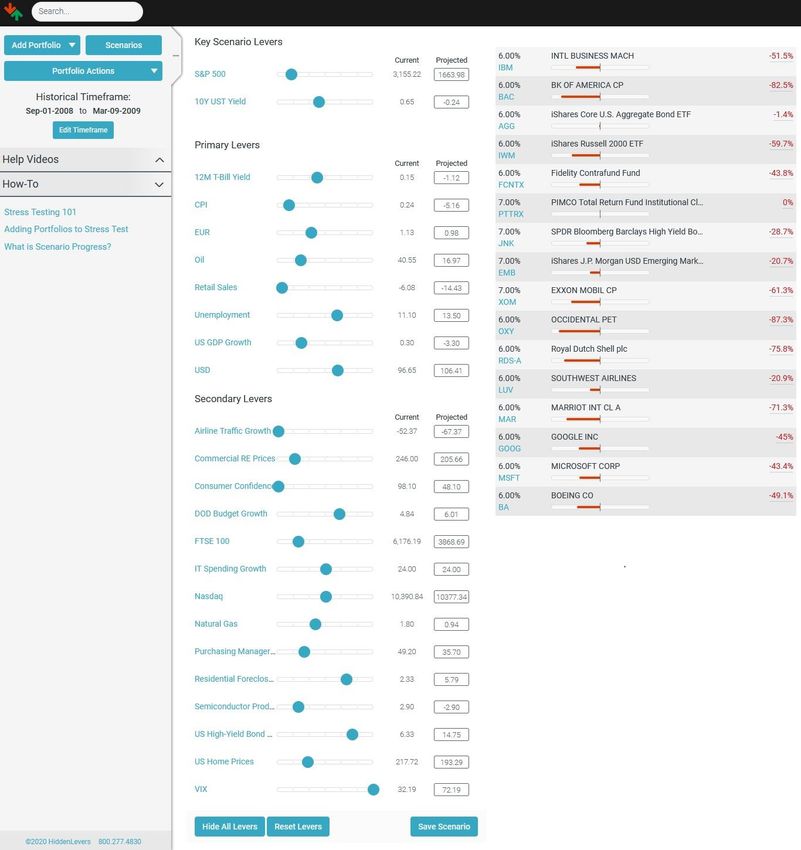
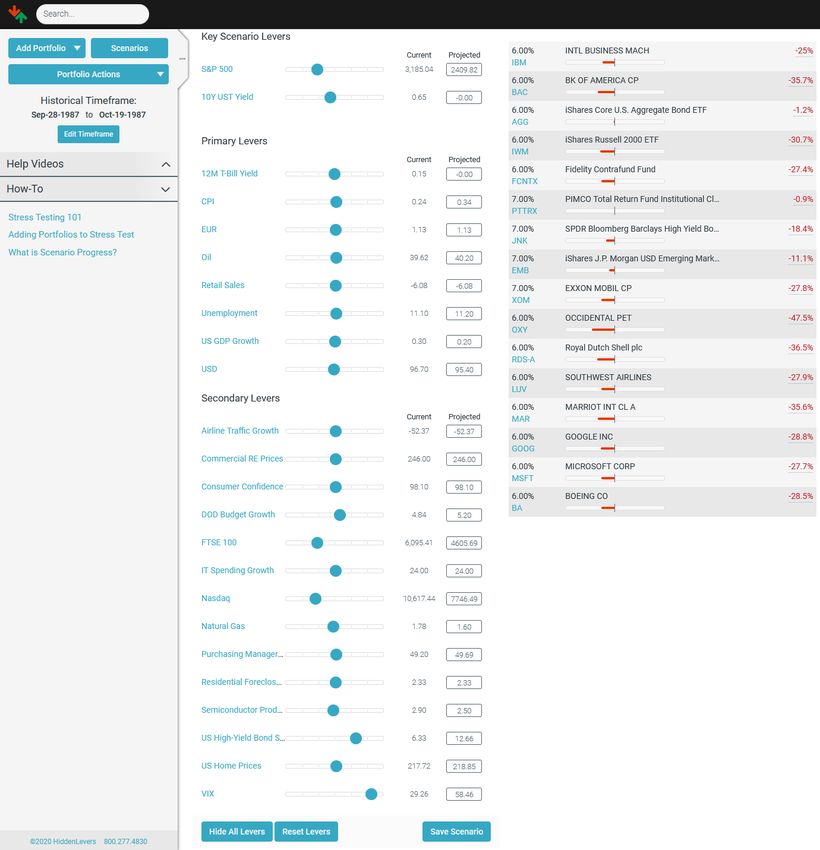
A. Addendum: Historical Stress Test Details

Figures 9-13 are screenshots of the HiddenLevers Live Stress Testing page, where portfolios
can be stress tested against both historical and forward-looking scenarios. In order to perform
the model review tests discussed in this white paper, historical stress tests were executed using
the dates listed for each case.

When a user selects historical dates in Live Stress Testing, the model automatically calculates
the percentage change of each economic lever over the historical timeframe, and applies this
change to the lever in order to replay the impact of the historical event. When the timeframe is
shorter than the frequency of the data (for instance, some of the scenario timeframes were less
than one month, while levers like GDP move on a quarterly frequency), the levers’ movements
were manually calculated and prorated for the time period elapsed. Those levers were then
individually adjusted to accurately account for how the economy changed over the historical
period in question.

All lever projections can be seen on each screenshot, so that readers can easily see the full set
of inputs used as part of this model review exercise.

HiddenLevers.com | info@hiddenlevers.com | 800-277-4830                                        23
Figure 9: Model Results for Timeframe February 19, 2020 – March 23, 2020

HiddenLevers.com | info@hiddenlevers.com | 800-277-4830                    24
Figure 10: Model Results for Timeframe March 23, 2020 – July 31, 2020

HiddenLevers.com | info@hiddenlevers.com | 800-277-4830                 25
Figure 11: Model Results for Timeframe September 28, 1987 – October 19, 1987

HiddenLevers.com | info@hiddenlevers.com | 800-277-4830                        26
Figure 12: Model Results for Timeframe July 13, 1998 – August 31, 1998

HiddenLevers.com | info@hiddenlevers.com | 800-277-4830                  27
Figure 13: Model Results for Timeframe September 1 2008 – March 9, 2009

HiddenLevers.com | info@hiddenlevers.com | 800-277-4830                   28
You can also read