Speech Enhancement of Mobile Devices Based on the Integration of a Dual Microphone Array and a Background Noise Elimination Algorithm - MDPI
←
→
Page content transcription
If your browser does not render page correctly, please read the page content below
sensors
Article
Speech Enhancement of Mobile Devices Based on the
Integration of a Dual Microphone Array and a
Background Noise Elimination Algorithm
Yung-Yue Chen
 Department of Systems and Naval Mechatronic Engineering, National Cheng Kung University,
 Tainan City 701, Taiwan; yungyuchen@mail.ncku.edu.tw; Tel.: +886-275-7575 (ext. 63541)

 Received: 19 March 2018; Accepted: 3 May 2018; Published: 8 May 2018

 Abstract: Mobile devices are often used in our daily lives for the purposes of speech and
 communication. The speech quality of mobile devices is always degraded due to the environmental
 noises surrounding mobile device users. Regretfully, an effective background noise reduction solution
 cannot easily be developed for this speech enhancement problem. Due to these depicted reasons,
 a methodology is systematically proposed to eliminate the effects of background noises for the speech
 communication of mobile devices. This methodology integrates a dual microphone array with a
 background noise elimination algorithm. The proposed background noise elimination algorithm
 includes a whitening process, a speech modelling method and an H2 estimator. Due to the adoption
 of the dual microphone array, a low-cost design can be obtained for the speech enhancement of
 mobile devices. Practical tests have proven that this proposed method is immune to random
 background noises, and noiseless speech can be obtained after executing this denoise process.

 Keywords: speech enhancement; estimator design; background noise reduction; mobile device

1. Introduction
     Currently, the speech communication function of mobile devices has been well-designed and
widely used as a convenient tool for contacting others due to its portable characteristics. However,
the speech communications of mobile devices are inevitably affected by varying environment noises.
Several published speech enhancement algorithms based on a microphone have been studied in
the past two decades for tackling the elimination of background noises due to their realization
convenience [1–4]. From the revealed facts, single microphone designs obviously could not provide
effective speech enhancement in highly non-stationary noise environments to decouple the desired
speech and random noises via using one measurement of raw data.
     Background noise reduction designs utilizing array-based microphone configurations have
become the main trend due to the aforementioned reason. By increasing the number of microphones,
array-based designs outperform satisfactory speech enhancement performances with respect to
designs with only one microphone. While array-based designs provide promising effects in reducing
background noises, they encounter serious challenges in practical mobile device applications,
which always take total cost, size, weight, and so on into account. Dual microphone array designs
perhaps are the remedy which can meet these requirements.
     From mathematical expressions, existing background noise reduction algorithms using
dual-microphone array designs can be separated into two categories: (1) spectrum domain expression
and (2) time domain expression. The most popular method for speech enhancement designs of
microphone arrays in spectrum domain is beamformer designs [5–7]. The speech enhancement
achievements of these adaptive filters are acceptable, but these kinds of speech enhancement

Sensors 2018, 18, 1467; doi:10.3390/s18051467                              www.mdpi.com/journal/sensors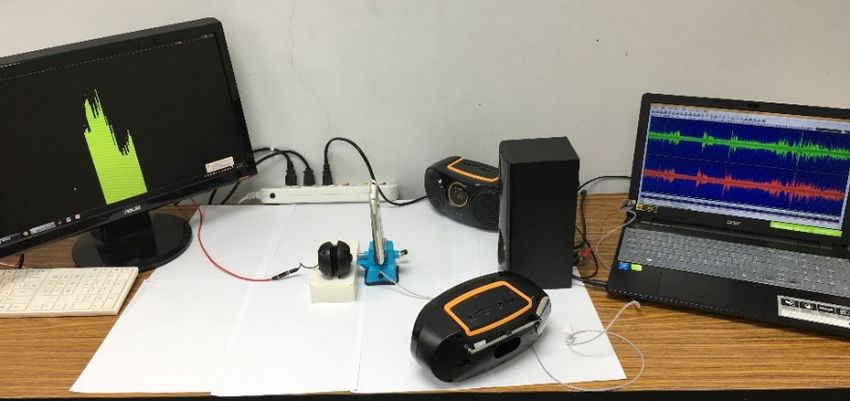
Sensors 2018, 18, 1467                                                                               2 of 14

designs have two major disadvantages: (1) locations of the main speech and background noises,
including reflections and reverberations must be fixed for achieving better background noise reduction
performance in real environments, and (2) the spectrum of the passed noises must be predicted
in advance. Another spectrum domain method often utilized to treat the speech enhancement problem
is the power level difference method (PLD). Depending on the precise estimation of the power spectral
densities of speeches, better speech enhancement performances can be obtained using this method.
For solving drawbacks of conventional power level difference methods, a modified version which
can precisely estimate the stochastic property of speech with optimal thresholds is investigated [8].
However, time-varying optimal thresholds of this method are not easily calculated in practice because
the real-time characteristic of the microphone array which cannot be measured online has a strong
influence on the PLD.
      The Kalman filter represented in state-space formulation has been utilized for speech enhancement
problems in the past year [9]. In Kalman filter design, the background noise is strictly assumed as
a signal with a zero mean and a known covariance. Due to this assumption, the Kalman filter
inherently possesses no noise reduction capability with regard to the colored background noise
reduction problem. For improving the drawback of the Kalman filter algorithm with respect to the
colored background noises, a modified version was proposed [10]. The main characteristic of this
modified version is the searching of non-speech frames, and the purpose is to calculate the noise
covariance. Theoretically, detecting no-speech frames offline is possible. However, it is very difficult to
promptly identify the statistical occurrence of noises in the real environment. The above depictions
point out the guideline to effectively enhance speech quality when mobile devices are used in the
presence of colored noises: “An estimator without knowing the statistics of the background noises
is necessary”. Several robust estimators are investigated for background noise elimination designs
in the past decade [11–14]. By following the guideline, the steady state form of the Kalman filter
known as the H2 estimator combined with a colored noise whitening process is studied for the
speech enhancement problem in this investigation. By integrating this modified H2 estimator with
a dual microphone array, an effective background noise reduction design that has low calculation
power consumption and can effectively mitigate the non-stationary background noises is developed.
The overall speech enhancement process of this investigation can be summarized as the following:
Step 1, two measured data pairs of microphone channels are whitened as a white noise driven speech
sequence. This speech sequence is mathematically expressed as a corresponding difference equation
which contains a set of identifiable parameters in Step 2 and further formulated as a vector-matrix
form in time domain for conveniently deriving the related H2 estimator in Step 3. From real tests,
this proposed method can effectively remove the unknown background noises and deliver promising
speech enhancement performances in severe scenarios.

2. Speech Enhancement Process for Mobile Devices

2.1. Introduction of Overall Speech Enhancement Process
      The overall speech enhancement process of mobile devices is depicted as Figure 1. There are
four parts in this process: (1) a dual-microphone array, (2) an auto gain control process (AGC) [15],
(3) a system identification algorithm for the real-time speech modeling, and (4) an optimal H2 estimator.
The dual microphone array constructed with an omnidirectional microphone (Omni-Mic) and
unidirectional microphone (Uni-Mic) is used for collecting all possible sound sources. AGC process
after the dual microphone array is utilized to compress or amplify the intensities of the measured
sound signals equally. The whitened speech model is mathematically identified by the Recursive
Least-Squares algorithm (RLS) [16] and represented as a vector-matrix form. Based on the
vector-matrix form, an H2 estimator is proposed to mitigate the effects of the residual of background
noises and deliver enhanced speech. In the following, details of each part will be addressed.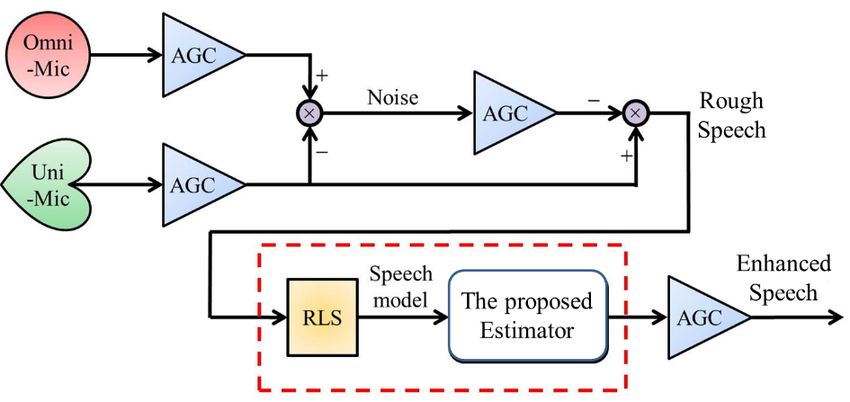
Sensors 2018, 18, 1467 3 of 14
Sensors 2018, 18, x FOR PEER REVIEW 3 of 14
Sensors 2018, 18, x FOR PEER REVIEW 3 of 14
Figure1.
Figure 1. The
The schematic
schematic of
of the
the proposed
proposedspeech
speechenhancement
enhancementprocess.
process.
Remark 1. As an Figure inherent 1. characteristic,
The schematic omnidirectional microphones
of the proposed speech can pickprocess.
enhancement up sounds equally from all
Remark 1. As an inherent characteristic, omnidirectional microphones can pick uponly
directions of the surrounding environment. However, unidirectional microphones pick equally
sounds up soundsfromwith
all
Remark 1.
high gain of As
from an inherent characteristic, omnidirectional microphones can pick up sounds equally from all
directions the asurrounding
specific sideenvironment.
in order to getHowever,
good gain on the recording.
unidirectional microphones only pick up sounds with high
directions of the surrounding environment. However, unidirectional microphones only pick up sounds with
gain from a2.specific
Remark side the
Generally, in order
AGCtocontains
get gooda gain
peakon the recording.
detector, voice activity detector (VAD), gain controller, and
high gain from a specific side in order to get good gain on the recording.
amplifier/attenuator as in Figure 2. Function of the peak detector is to detect the peak signal envelope. As to the
Remark
Remark
VAD, it 2. Generally,
is2.used
Generally, thethe
to detect AGC
the AGC contains
contains
character a peak
of aa sub-frame
peak detector,
detector,
of the voice
voice
input activity
activity
signal detector
detector
(speech (VAD),(VAD),Thegain
gain
or noise). gaincontroller,
controller, and
controller
and amplifier/attenuator
amplifier/attenuator as in as in
FigureFigure
2. 2. Function
Function of of
the the
peak peak detector
detector is to is to detect
detect the the
peak peak signal
signal
plays the role to provide the required gain to enhance the speech signal amplitude. By changing the analog gain envelope.
envelope. As As
to to
the
the
VAD, VAD,
it isit is
used used
to to detect
detect the the character
character of of
a a sub-frame
sub-frame of of the
the input
input signal
signal (speech
(speech
of the analog to digital converter, the Amplifier/Attenuator can adjust the speech signal amplitude. or
or noise).
noise). The
The gain
gain controller
controller
plays the
plays the role
role to to provide
provide the
the required
required gain
gain toto enhance
enhance thethe speech
speech signal
signal amplitude.
amplitude. By By changing
changing thethe analog
analog gain
gain
of the
of the analog
analog to to digital
digital converter,
converter, the Amplifier/Attenuator can adjust the speech signal amplitude.
Figure 2. Detailed process of the AGC.
Figure
2.2. Background Noise Whitening and 2.
2. Detailed
Extraction
Figure of aprocess
Detailed Rough of
process the
the AGC.
Speech
of AGC.
As FigureNoise
2.2. Background 1 shows, a rough
Whitening speech
and before
Extraction of RLS can be
a Rough obtained via using the measured raw data
Speech
of the dual microphone array. This is a semi-hardware whitening process, and this pretreated speech
As Figure
reserves minor1 shows, a rough
background speech
noises butbefore RLS can
is cleaner thanbeoutputs
obtainedofvia
theusing
dualthe measured raw
microphone data
array. As
2.2. Background Noise Whitening and Extraction of a Rough Speech
ofmentioned
the dual microphone array. This is a semi-hardware whitening process, and this pretreated
above, the whitening process of colored background noises in Figure 1 can be described speech
reserves minor
As Figure
as below 1background noisesspeech
shows, a rough
in detail. but is before
cleanerRLS than outputs
can of the via
be obtained dual microphone
using array. raw
the measured As
mentioned
data of the
The above,
measured the whitening
dual microphone
raw process
array.
data of the of
is acolored
Thismicrophone
dual background
semi-hardware noisesand
whitening
array (Omni-Mic in Figure
process, 1 can
and
Uni-Mic) be
this
can described
bepretreated
expressed
as below
speech in
as follows: detail.
reserves minor background noises but is cleaner than outputs of the dual microphone array.
The measured raw data of the dual microphone array (Omni-Mic and Uni-Mic)
As mentioned above, the whitening process of colored background noises in Figure 1 can be describedcan be expressed
as
as follows:
below in detail. { }
Ξ = [ xomni (t ), xuni (t ) ] ∈ ℜ 2 |1 ≤ t ≤ K (1)
Ξ = {[ xraw (data
where Ξ is the data set of measured t ), x of(Omni-Mic
omni uni } Uni-Mic (x
t ) ] ∈ ℜ |1(x≤ t ≤(t))K and
2
omni uni (t)) at time(1)
t. K
is the length of total sampling raw data.
whereThe Ξ isdifference
the data set
of ofthe
measured raw
measured data
raw of Omni-Mic
data of Omni-Mic (t))
(xomni(x omniand Uni-Mic
(t)) and (xuni(t))
Uni-Mic at(t))
(xuni time
cant. K
be
isobtained
the length
byof totalthe
using sampling rawsubtraction:
following data.
The difference of the measured raw data of Omni-Mic (xomni(t)) and Uni-Mic (xuni(t)) can be
obtained by using the following subtraction:Sensors 2018, 18, 1467 4 of 14
The measured raw data of the dual microphone array (Omni-Mic and Uni-Mic) can be expressed
as follows: n o
Ξ = [ xomni (t), xuni (t)] ∈Sensors 2018, 18, 1467 5 of 14
selected difference equation with optimal parameters can be obtained. RLS algorithm is expressed as
the following:
e(t) = y(t) − λ(t) T Θ̂(t − 1) (7)
!
1 P ( t − 1) λ ( t ) λ ( t ) T P ( t − 1)
P(t) = P ( t − 1) − (8)
f f + λ ( t ) T P ( t − 1) λ ( t )
Θ̂(t) = Θ̂(t − 1) + P(t)λ(t)e(t) (9)
where P(t) is a time varying coefficient covariance at the time instant of t, Θ̂(t) is parameter vector, λ(t) is
input speech data vector, e(t) is the real-time output error vector, y(t) is the measurement output. f is
defined as the forgetting factor and can be selected from the range [0.95,1] for the real implementation.
By using RLS algorithm in Equations (7)–(9), ai of Θ̂(t) are identified optimally. The slight noised
speech model in Equations (4)–(5) can be formulated as the following vector-matrix form:
R(t + 1) = As R(t) + Bs ws (t) (10)
y(t) = Cs R(t) + Ds vs (t) (11)
T
a1 a 2 · · · a n −1 a n
1 1
1 0 ··· ··· 0
0 0
..
.. .. ..
n×n
0
n ×1
0
1× n
As =
0 . . . . ∈<
, Bs =
∈ < , Cs =
∈< , Ds = 1
. .
.. .. .. .. .. .
.
.
.
. . .
. .
0 ··· 0 1 0 0 0
h iT
where R(t) = r s ( t ) r s ( t − 1) · · · r s ( t − n + 2) r s ( t − n + 1) is the state vector, and ws (t)
and vs (t) are instances of white noise.
Based on the white noise driven speech model in Equations (10) and (11), an optimal estimator
will be derived in the following.
2.4. H2 Estimator Design
In this section, the steady state form of the Kalman filter named: H2 Estimator will be derived,
and this is an optimal estimator. Assume (t) is the desired speech to be reconstructed from
Equations (10) and (11):
(t) = ∆R(t) (12)
where ∆ is a constant matrix, which is arranged to extract the desired signal (t) from the state
ˆ
vector R(t). The object of developing the H2 estimator is to optimally estimate (t) via using the
measured noisy output signal y(t). For reconstructing the original clean speech, the H2 estimator can
be formulated in state space form as:
R̂(t + 1) = As R̂(t) + L2 y(t) − Cs R̂(t)
ˆ (13)
(t) = ∆ R̂(t)
where L2 ∈Sensors 2018, 18, 1467 6 of 14
2.5. Estimation Gain L2 of H2 Estimator
The H2 performance index for the speech enhancement problem of mobile devices with a dual
microphone array can be expressed by the mean-square error of estimation error e (t) [17] as:
n o
T
J =E e ( t + 1) e ( t + 1)
n o (15)
= E ∆R e ( t + 1) T ∆ T
e ( t + 1) R
where the estimation error e (t + 1) = ∆ R
e ( t + 1).
The H2 performance index in Equation (15) can be reformulated as:
n o
J = E tr (∆ R e ( t + 1) T ∆ T )
e ( t + 1) R
n o (16)
= tr (∆E R e ( t + 1) T ∆ T )
e ( t + 1) R
e (t + 1) at the steady state is obtained by:
From Equation (16), the covariance matrix of R
e ( t + 1)
R = R(t + 1) − R̂(t + 1)
= As R(t) + Bs ws (t) − As R̂(t) + L2 y(t) − Cs R̂(t)
= e (t) + Bs ws (t) − L2 Cs R(t) + Ds vs (t) − Cs R̂(t)
As R (17)
h i
= e (t) + Bs ws (t) − L2 Cs R
As R e ( t ) + Ds v s ( t )
= ( As − L2 Cs ) R
e (t) + Bs ws (t) − L2 Ds vs (t)
From Equations (15) and (17), the mean-square error or H2 performance index can be described
as follows:
n o nh i
E R e ( t + 1) T
e ( t + 1) R = E ( As − L2 Cs ) R e (t) + Bs ws (t) − L2 Ds vs (t) ·
h io
e (t) T ( As − L2 Cs ) T + ws (t) T Bs T − vs (t) T Ds T L2 T
R
n
= E ( As − L2 Cs ) R e (t) T ( As − L2 Cs ) T + Bs ws (t)ws (t) T Bs T +
e (t) R (18)
o
L 2 Ds v s ( t ) v s ( t ) T Ds T L 2 T
n o
= ( As − L2 Cs )E R e (t) T ( As − L2 Cs ) T + Bs Bs T + L2 Ds Ds T L2 T
e (t) R
where R(t), vs (t), and ws (t) are mutuallynorthogonal,oand the covariance
n matricesoof vs (t), and ws (t) are
assumed to be the identity matrix as E vs (t)vs (t) T = In×n and E ws (t)ws (t) T = In×n .
n o
In practical design, the covariance matrix E R e (t) T at steady state t → ∞ is constant and
e (t) R
n o
can be denoted as E R e (t) T = Ψ. By combining Equations (16) and (18), we have
e (t) R
n o
J = tr (∆E R e ( t + 1) T ∆ T )
e ( t + 1) R
h i
= tr (∆ ( As − L2 Cs )Ψ( As − L2 Cs )T + ΓΓ T + L2 ΘΘ T L2 T ∆ T )
h i (19)
= tr (∆ ( As − L2 Cs )Ψ( As − L2 Cs )T − Ψ + Bs Bs T + L2 Ds Ds T L2 T ∆ T )
+tr (∆Ψ∆ T )
It is obvious that mean-square error J has an upper bound as below:
J ≤ tr (∆Ψ∆ T ) (20)Sensors 2018, 18, 1467 7 of 14
If the inequality as below holds:
( As − L2 Cs )Ψ( As − L2 Cs )T − Ψ + Bs Bs T + L2 Ds Ds T L2 T < 0 (21)
Let P2 = Ψ−1 and Y2 = P2 L2 , and multiply the left and right sides of Equation (21) by a positive
definite matrix P2 , then Equation (21) can be expressed as:
( P2 As − Y2 Cs ) P2−1 ( P2 As − Y2 Cs )T − P2 + P2 Bs Bs T P2 + Y2 Ds Ds T Y2T < 0 (22)
For obtaining the solution P2 of Equation (22), the famous Schur complement is applied to
Equation (22) to transfer the inequality of Equation (22) into an equivalent linear matrix inequality
(LMI) [18] form as below:
P2 P2 Bs Y2 Ds ( P2 As − Y2 Cs )
Bs T P2 I 0 0
>0 (23)
Ds T Y2T 0 I 0
( P2 As − Y2 Cs )T 0 0 P2
Then, P2 and Y2 of Equation (23) can be numerically calculated by using the LMI toolbox of
Matlab software [19] simultaneously, and the optimal estimation gain L2 = P2 −1 Y2 .
From the above mathematical derivations for the speech enhancement problem of mobile devices
with a dual microphone array, the overall design procedure of the proposed H2 estimator can be
summarized as follows:
Step 1. Assume the covariance matrices of vs (t) and ws (t) are identity matrices, and ∆ is a
constant matrix.
Step 2. Solve the LMI in Equation (23) for getting the matrices P2 and Y2 .
Step 3. Calculate the estimation gain L2 = P2 −1 Y2 .
Step 4. Construct the optimal H2 estimator by Equation (13) as below
R̂(t + 1) = As R̂(t) + L2 y(t) − Cs R̂(t)
ˆ
(t) = ∆ R̂(t)
3. Practical Implementation and Performance Verification
As is mentioned above, a speech enhancement design for mobile devices with a dual microphone
array is investigated. In this section, the practical performance of this proposed method will be
assessed for two testing scenarios and three performance indices: (1) final cross-correlation between
the estimated and real clean speech, (2) enhanced signal-to-noise ratio (E-SNR), and (3) perceptual
evaluation of speech quality (PESQ). Before the verification of this proposed speech enhancement
design, brief descriptions of E-SNR, PESQ, the installation of the practical experiment environment
and related instruments will be introduced.
3.1. Enhanced SNR and Perceptual Evaluation of Speech Quality
(i) The E-SNR with an estimation design can be expressed as:
E-SNR = Denoised SNR − Original SNR (24)
where Denoised SNR is the SNR of the treated speech signal and Original SNR is the SNR of speech
signal without any treatment.
(ii) PESQ which combines the advantages of perceptual analysis/measurement system (PAMS)
and perceptual speech quality measure (PSQM) is a test methodology for automated objectiveSensors 2018, 18, x FOR PEER REVIEW 8 of 14
Sensors 2018, 18, 1467 8 of 14
(ii) PESQ which combines the advantages of perceptual analysis/measurement system (PAMS)
and perceptual speech quality measure (PSQM) is a test methodology for automated objective
assessment of
assessment speech quality
of speech quality to
to replace
replace traditional
traditional jury
jury test. The range
test. The range of
of PESQ
PESQ is
is 11 to
to 4.5,
4.5, where
where 1
1 is
is
the worst quality and 4.5 is the best quality.
the worst quality and 4.5 is the best quality.
3.2. Practical
3.2. Practical Implementation
Implementation andand Performance
Performance Verification
Verification
From the
From the inner
inner and
and outer
outer illustration
illustration of
of the
the mobile
mobile device
device inin Figure
Figure 3,
3, the
the omnidirectional
omnidirectional
microphone (Omni-Mic) is installed in the back of the mobile device, and the unidirectional
microphone (Omni-Mic) is installed in the back of the mobile device, and the unidirectional microphone
(Uni-Mic)
microphone is placed in the
(Uni-Mic) front side
is placed andfront
in the is close
sidetoand
theismobile device
close to user’sdevice
the mobile mouth.user’s mouth.
Figure
Figure 3.
3. Illustration
Illustration of
of the
the dual
dual microphone
microphone array in the
array in the mobile
mobile device.
device.
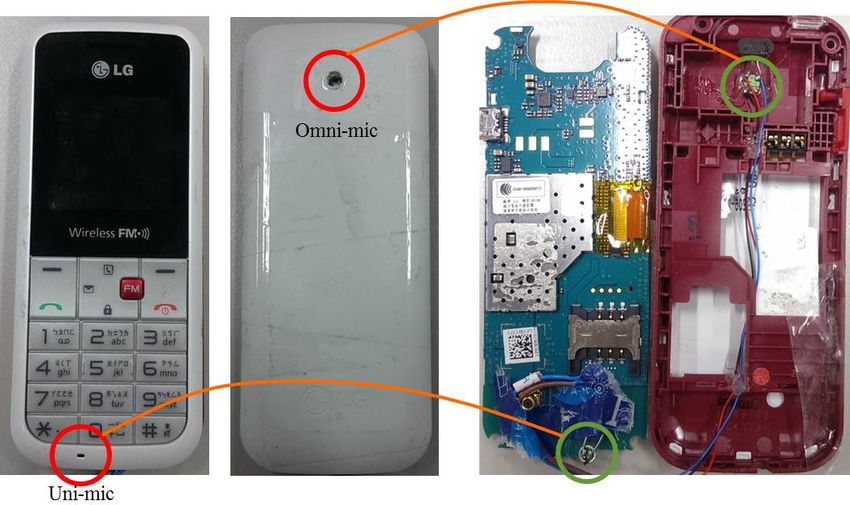
The overall assessment environment of the speech enhancement performance is set up as Figure
The overall assessment environment of the speech enhancement performance is set up as Figure 4.
4. In this installation, a 20 s long phrase (clean speech) is broadcasted from a laptop in front of the
In this installation, a 20 s long phrase (clean speech) is broadcasted from a laptop in front of the
mobile device. Without loss of generality, a testing environment with multiple directional
mobile device. Without loss of generality, a testing environment with multiple directional background
background noises is used to verify the speech enhancement performance of this proposed method.
noises is used to verify the speech enhancement performance of this proposed method. In this testing
In this testing arrangement, three trumpets loudly broadcast background noises simultaneously from
arrangement, three trumpets loudly broadcast background noises simultaneously from different
different directions (0°, 45°, −45°). The relative distance is 4 cm far from the mobile device to the clean
directions (0◦ , 45◦ , −45◦ ). The relative distance is 4 cm far from the mobile device to the clean speech,
speech, and the relative distance from each of background noises to the mobile device is 20 cm. This
and the relative distance from each of background noises to the mobile device is 20 cm. This testing
testing arrangement is a standard and customized specification in the function test of all delivered
arrangement is a standard and customized specification in the function test of all delivered speech
speech enhancement designs of mobile devices.
enhancement designs of mobile devices.
Figure 4. Installation of the test environment of the proposed speech enhancement design.background noises is used to verify the speech enhancement performance of this proposed method.
In this testing arrangement, three trumpets loudly broadcast background noises simultaneously from
different directions (0°, 45°, −45°). The relative distance is 4 cm far from the mobile device to the clean
speech, and the relative distance from each of background noises to the mobile device is 20 cm. This
testing2018,
Sensors arrangement
18, 1467 is a standard and customized specification in the function test of all delivered
9 of 14
speech enhancement designs of mobile devices.
Figure 4. Installation of the test environment of the proposed speech enhancement design.
Figure 4. Installation of the test environment of the proposed speech enhancement design.
3.3. Initialization of the Practical Realization
The system order n of the whitened speech model in Equation (4) is chosen as 10 for saving
calculation power in the following speech enhancement assessments. Key parameters of the proposed
estimator are given as Tables 1 and 2.
Table 1. Parameters of the proposed H2 estimator.
Parameter Description Value
R̂(t) Initial values of estimator states 0n ×1
P The coefficient covariance In×n
∆ Constant matrix In×n
Table 2. Estimation gain L2 and P2 of H2 estimator in steady state condition.
0.9751
0.9778
··· ···
−6.4285e−5
0.0202 0 0
.. .. ..
−3.5771e−6
0 0.0202 . . .
−2.5308e−6
L2 =
, P2 = .. .. .. .. ..
3.5226e−6 . . . . .
−3.5417e−6 ..
.. ..
. . . 0.0202 0
1.9277e−6
0 ··· ··· 0 0.0202
2.5554e−6 10×10
−2.8470e−6
Two various scenarios will be utilized to verify the speech enhancement ability of this proposed
design. The user’s testing speech is an English phrase, and for the purpose of assessing the robustness
of this proposed design, two English songs: One sang by a female singer and one sang by a male singer,
are used as background noises.
3.4. Practical Test of This Proposed Method for a Phrase
Scenario 1: A mobile device user who says “Smart phones become more and more popular in
recent years, and the performance of smart phones has gotten better and better. Unfortunately, in a
noisy environment, the communication quality is still awful and no suitable solution exists for it” is
used as the clean speech in communication, and the English song: “Let it go” sang by a female singer
Idina Menzel is used as the background noise.
Without any speech enhancement treatments, the original SNR for this testing scenario is −5.2 dB.
Clean speech, two sound signals measured by Uni and Omni Mics and the estimated result are revealed
in Figure 5. Two original signals measured by Uni and Omni Mics are plotted in subfigures (b) and (c)
of Figure 5. The estimation result of the proposed H2 estimator design is shown in the subfigure (d)Sensors 2018, 18, 1467 10 of 14
of Figure 5. From subfigures (b) and (c), the output signal of Uni-Mic shows us a bigger amplitude
than that of Omni-Mic, and the output signal shapes of Uni-Mic and Omni-Mic are similar. The clean
speech is too weak to be recognized by only using Uni-Mic in practice, even the user’s mouth is close
to Uni-Mic due to the background noise being too loud. Comparisons are made between the signal
Sensors 2018,by
measured 18, Uni-Mic
x FOR PEER REVIEW
and 10 of5d
the proposed method, and the contrast of the estimated speech in Figure 14
with respect to the original clean speech in Figure 5a. Obviously, the proposed method provides
to very noisy
promising circumstances.
speech enhancement Theperformance
final assessments are:mobile
when the cross-correlation
device user0.91, E-SNRto18.3
is subject verydBnoisy
and
PESQ = 3.78. The final assessments are: cross-correlation 0.91, E-SNR 18.3 dB and PESQ = 3.78.
circumstances.
Waveform plots
Figure 5. Waveform plots of
ofspeech
speechsignals,
signals,(a)
(a)clean
cleanspeech,
speech,PESQ
PESQ= = 4.5,
4.5, spoken
spoken byby a speaker
a speaker in
in Scenario
Scenario 1, (b)
1, (b) recorded
recorded speech
speech using
using Omni-microphone,
Omni-microphone, PESQPESQ = 1.34,
= 1.34, (c) recorded
(c) recorded speech
speech usingusing
Uni-
Uni-microphone,
microphone, PESQ PESQ = 1.42,
= 1.42, (d) enhanced
(d) enhanced speech
speech usingusing the proposed
the proposed method,
method, PESQPESQ = 3.78.
= 3.78.
Scenario 2:
Scenario 2: In
In this
this scenario, the clean
scenario, the clean speech
speech is is the
the same
same asas Scenario
Scenario 1, 1, however
however the the background
background
noise is an English song: “Free loop” sang by the male singer Daniel Powter. The original SNRSNR
noise is an English song: “Free loop” sang by the male singer Daniel Powter. The original for
for this
this testing
testing scenario
scenario is −5.3isdB.−5.3ThedB.clean
Thespeech
clean speech is completely
is completely covered by covered by thissong.
this English English song. For
For published
speech enhancement designs, recovering the original speech from such an un-ideal situation isun-ideal
published speech enhancement designs, recovering the original speech from such an actually
asituation is actually
challenging task. Thea challenging
subfigures (b)task.
andThe
(c)subfigures
of Figure 6(b) areand
the (c) of Figure
measured 6 are the
signals measured
of Uni Mic andsignals
Omni
of Uni Mic and Omni Mic, respectively. The practical estimation result of the clean
Mic, respectively. The practical estimation result of the clean speech is shown as the first subfigure of speech is shown
as the first
Figure subfigure
6. From of Figure 6.ofFrom
the comparisons the comparisons
the estimated speech and of the
theestimated
measuredspeech
signal of and
Uni the measured
Mic plotted
in Figure 6c,d, most background noises are obviously removed before speech transmission before
signal of Uni Mic plotted in Figure 6c,d, most background noises are obviously removed of the
speech transmission of the mobile device. From the estimation result revealed in
mobile device. From the estimation result revealed in Figure 6d, it is quite similar to the original clean Figure 6d, it is quite
similar to the original clean speech in Figure 6a. In this scenario, the cross-correlation
speech in Figure 6a. In this scenario, the cross-correlation is 0.92, E-SNR is 18.6 dB, and PESQ is 3.84. is 0.92, E-SNR is
18.6 dB,
Table andthe
3 lists PESQ is 3.84.the
E-SNRs, Table
final3 cross
lists the E-SNRs, the
correlations finalestimated
of the cross correlations
results ofof theproposed
this estimatedmethodresults
of this proposed method to with respect to clean speeches and PESQs. From
to with respect to clean speeches and PESQs. From Table 3, the average E-SNRs reaches 18.45 dB, Table 3, the average E-
SNRs reaches 18.45 dB, the similarity calculated by the cross-correlation index
the similarity calculated by the cross-correlation index is 0.915 and average PESQ is 3.81. These three is 0.915 and average
PESQ is are
indexes 3.81.superior
These three
to the indexes
existingarespeech
superior to the existing
enhancement speech
designs enhancement
which are with the designs which
average 10 are
dB
with the average 10 dB E-SNR. Speech enhancement performances of these two scenarios show us
that our proposed method possesses robustness property corresponding to various background
noises (different sex).Sensors 2018, 18, 1467 11 of 14
E-SNR. Speech enhancement performances of these two scenarios show us that our proposed method
possesses
Sensors robustness
2018, 18, x FORproperty corresponding to various background noises (different sex).11 of 14
PEER REVIEW
Figure
Figure 6. Waveform
6. Waveform plotsofofspeech
plots speech signals,
signals,(a)
(a)clean speech,
clean PESQ
speech, = 4.5,=spoken
PESQ by a speaker
4.5, spoken in
by a speaker
Scenario 2, (b) recorded speech using Omni-microphone, PESQ = 1.52, (c) recorded speech
in Scenario 2, (b) recorded speech using Omni-microphone, PESQ = 1.52, (c) recorded speech using using Uni-
microphone, PESQ
Uni-microphone, PESQ= =
1.61, (d)(d)
1.61, enhanced speech
enhanced usingusing
speech the proposed method,
the proposed PESQ = PESQ
method, 3.84. = 3.84.
Table 3. E-SNRs and the final cross-correlations for Scenario 1 and Scenario 2.
Table 3. E-SNRs and the final cross-correlations for Scenario 1 and Scenario 2.
Type Final Cross-Correlation E-SNR PESQ
Pure Speech: A Phrase
Type Final 0.91
Cross-Correlation 18.3 dB
E-SNR 3.78
PESQ
Scenario 1 EnglishPure Song:
Speech:Let it go, female
A Phrase 0.91 18.3 dB 3.78
Scenario 1 singerSong:
English IdinaLet
Menzel
it go,
Puresinger
female Speech: A Menzel
Idina Phrase 0.92 18.6 dB 3.84
Scenario 2 English Song: Free
Pure Speech: loop, male
A Phrase 0.92 18.6 dB 3.84
Scenario 2 singer Daniel Powter
English Song: Free loop,
male singer Daniel Powter
Spectrograms: In order to yield more information about the residual noise and speech distortion,
we analyze the time-frequency distribution of the enhanced speech and evaluate the structure of
noise byInobserving
Spectrograms:
residual order to yield
speechmore information
spectrograms. about 7the
Figures residual
and noise
8 present and speechofdistortion,
comparisons the
we analyze the time-frequency
spectrograms for enhanced speechdistribution
in Scenarios of1the
andenhanced speech
2, respectively. Cleanand evaluate
speech signalsthe
are structure
heavily of
residual noisebybynon-stationary
corrupted observing speech
backgroundspectrograms.
noises with veryFigures
low-SNR7 and 8 presentwhere
environments, comparisons
SNR = −5.2of the
dB in Figurefor
spectrograms 7 and −5.3 dB inspeech
enhanced Figure 8,inrespectively.
Scenarios Speech
1 and signals heavily corrupted
2, respectively. Cleanbyspeech
varioussignals
kinds are
heavily corrupted by non-stationary background noises with very low-SNR environments,ofwhere
of non-stationary background noises is shown in Figures 7b and 8b. Observing the spectrograms
SNR enhanced
= −5.2 dB speech shown
in Figure in Figures
7 and −5.3 dB 7c and 8c, the8,harmonic
in Figure spectra
respectively. of vowel
Speech signals
signals can becorrupted
heavily well
preserved in the enhanced speech signals. As a result, the proposed method does not suffer from the
by various kinds of non-stationary background noises is shown in Figures 7b and 8b. Observing the
over-attenuation on noisy speech when removing a quantity of background noise. In addition, the
spectrograms of enhanced speech shown in Figures 7c and 8c, the harmonic spectra of vowel signals
spectrograms also reveal the fine structure of spectra in speech-activity regions. A muffled signal is
can be well preserved in the enhanced speech signals. As a result, the proposed method does not suffer
absent in the enhanced speech. The proposed method is superior in the removal of background noise
fromduring
the over-attenuation on noisy
speech-pause regions. speech
Only when
a little removing
quantity a quantity
of residual noise of background
exits, noise. speech
so the enhanced In addition,
the spectrograms
sounds are notalso revealtothe
annoying thefine structure
human of proves
ear. This spectrathat
in speech-activity
the performance regions. A muffled
of the proposed methodsignal is
absent in the enhanced speech. The proposed method is superior in the removal of background noise
is satisfied.
during speech-pause regions. Only a little quantity of residual noise exits, so the enhanced speechSensors 2018, 18, 1467
x FOR PEER REVIEW 12 of 14
sounds are not annoying to the human ear. This proves that the performance of the proposed method
Sensors 2018, 18, x FOR PEER REVIEW 12 of 14
is satisfied.
(a)
(a)
(b)
(b)
(c)
(c)
Figure 7. Spectrograms
7.
FigureSpectrograms
7. Spectrograms of speech
of of speechsignals
speech signalsfor
signals for Scenario
for Scenario 1, (a)
Scenario 1, (a)clean
cleanspeech
speech spoken
spoken by abyspeaker
a speaker
in in
Scenario 1, (b)1,recorded
Scenario recorded speech
(b) recorded using
speech usingOmni-Mic,
Omni-Mic, (c)
(c) enhanced
enhanced speech
speech using
using thethe proposed
proposed
speech using Omni-Mic, (c) enhanced speech using the proposed method. method.
method.
(a)
(a)
(b)
(b)
Figure 8. Cont.Sensors 2018, 18, 1467 13 of 14
Sensors 2018, 18, x FOR PEER REVIEW 13 of 14
(c)
Figure 8. Spectrograms
Spectrograms ofof speech
speech signals
signals for
for Scenario
Scenario 2,
2, (a) clean speech spoken by a speaker in
speech using
Scenario 2, (b) recorded speech using Omni-Mic,
Omni-Mic, (c)
(c) enhanced
enhanced speech
speech using
using the
the proposed
proposedmethod.
method.
4. Conclusions
4. Conclusions
In this
In this investigation,
investigation, an an integrated
integrated speech
speech enhancement
enhancement designdesign which
which can
can effectively
effectively cancel
cancel
background noises surrounding the used mobile devices is proposed. Firstly,
background noises surrounding the used mobile devices is proposed. Firstly, a dual microphone array a dual microphone
array
is is installed
installed in mobilein mobile
devices devices for collecting
for collecting a pair ofaspeech
pair ofpatterns
speech for
patterns for theofobjective
the objective whiteningof
whitening the speech, which is corrupted by colored background noises. The
the speech, which is corrupted by colored background noises. The slightly noised speech is then slightly noised speech
is then mathematically
mathematically modelledmodelled as a difference
as a difference equation
equation which which
is driven by is drivennoise
a white by aandwhite noise and
expressed as a
expressed as a vector-matrix formulation. For mitigating residual unknown
vector-matrix formulation. For mitigating residual unknown and random background noises, an H2and random background
noises, anisHderived
estimator 2 estimator
basedis on
derived based on the
the vector-matrix vector-matrix
formulation. formulation.
By applying this By applying thisdesign
well-developed well-
developed
to design
a real mobile to a platform,
device real mobile thedevice
average platform,
enhanced theSNR
average
is moreenhanced
than 18 SNR is more
dB, and than 18
an average dB,
value
and an average value 0.915 in the similarity can be obtained for the original clean
0.915 in the similarity can be obtained for the original clean speeches and estimated results. From the speeches and
estimated
results withresults.
respectFrom the results
to various testingwith respectthis
scenarios, to various
proposed testing
method scenarios,
actuallythis proposed
delivers method
a satisfactory
actuallyenhancement
speech delivers a satisfactory
performance speech
for theenhancement performance
speech communication for the speech
applications communication
of mobile devices.
applications of mobile devices.
Acknowledgments: National Science Council, Taiwan, supported this work via the Project which is with Grant
No. NSC101-2221-E-006-45-MY3)
Acknowledgments: financially.
National Science Council, Taiwan, supported this work via the Project which is with Grant
No. NSC101-2221-E-006-45-MY3) financially.
Conflicts of Interest: The authors declare no conflict of interest.
Conflicts of Interest: The authors declare no conflict of interest.
References
References
1. Mosayyebpour, S.; Esmaeili, M.; Gulliver, T.A. Single-microphone early and late reverberation suppression
1. Mosayyebpour, IEEE
in noisy speech. S.; Trans. Audio
Esmaeili, Speech Lang.
M.; Gulliver, Process. 2012, 21, 322–335.
T.A. Single-microphone early and[CrossRef]
late reverberation suppression
2. Gabrea, M.; Grivel, E.; Najun, M. A single microphone Kalman
in noisy speech. IEEE Trans. Audio Speech Lang. Process. 2012, 21, 322–335. filter-based noise canceller. IEEE Signal
2. Process.
Gabrea, Lett. 1999, 6, E.;
M.; Grivel, 55–57. [CrossRef]
Najun, M. A single microphone Kalman filter-based noise canceller. IEEE Signal
3. Mingyang, W.; Wang, D.
Process. Lett. 1999, 6, 55–57. A two-stage algorithm for one-microphone reverberant speech enhancement.
3. IEEE Trans. Audio Speech Lang. Process.
Mingyang, W.; Wang, D. A two-stage algorithm 2006, 14, 774–784. [CrossRef]
for one-microphone reverberant speech enhancement.
4. Ishaq, R.; Zapirain, B.G.; Shahid, M.; Lovstrom, B.
IEEE Trans. Audio Speech Lang. Process. 2006, 14, 774–784. Subband modulator Kalman filtering for single channel
4. speechR.;
Ishaq, enhancement.
Zapirain, B.G.;In Proceedings of the 2013B.IEEE
Shahid, M.; Lovstrom, International
Subband modulator Conference on Acoustics,
Kalman filtering Speech
for single and
channel
Signal Processing
speech enhancement.(ICASSP), Vancouver,
In Proceedings of BC, Canada,
the 2013 IEEE26–31 May 2013.Conference on Acoustics, Speech and
International
5. Signal Processing (ICASSP), Vancouver, BC, Canada, 26–31 May 2013.adaptive beamforming. IEEE Trans.
Griffiths, L.; Jim, C. An alternative approach to linearly constrained
5. Antennas
Griffiths, Propag. C. An30,alternative
L.; Jim, 1982, 27–34. [CrossRef]
approach to linearly constrained adaptive beamforming. IEEE Trans.
6. Hoshuyama, O.; Sugiyama,
Antennas Propag. 1982, 30, 27–34. A.; Hirano, A. A robust adaptive beamformer for microphone arrays with a
6. blocking matrix
Hoshuyama, O.;using constrained
Sugiyama, adaptive
A.; Hirano, A.filters.
A robustIEEE Trans. Signal
adaptive Process. 1999,
beamformer 47, 2677–2684.
for microphone [CrossRef]
arrays with a
7. Herbordt, W.; Kellermann, W. Analysis of blocking matrices for generalized sidelobe
blocking matrix using constrained adaptive filters. IEEE Trans. Signal Process. 1999, 47, 2677–2684. cancellers for
7. non-stationary broadband signals. In Proceedings of the 2002 IEEE International Conference
Herbordt, W.; Kellermann, W. Analysis of blocking matrices for generalized sidelobe cancellers for non- on Acoustics,
Speech, and Signal Processing (ICASSP), Orlando, FL, USA, 13–17 May 2002.
stationary broadband signals. In Proceedings of the 2002 IEEE International Conference on Acoustics,
8. Jeub, M.; Herglotz, C.; Nelke, C.; Beaugeant, C.; Vay, P. Noise reduction for dual-microphone mobile phones
Speech, and Signal Processing (ICASSP), Orlando, FL, USA, 13–17 May 2002.
exploition power lever differences. In Proceedings of the 2012 IEEE International Conference on Acoustics,
8. Jeub, M.; Herglotz, C.; Nelke, C.; Beaugeant, C.; Vay, P. Noise reduction for dual-microphone mobile
Speech and Signal Processing (ICASSP), Kyoto, Japan, 25–30 March 2012.
phones exploition power lever differences. In Proceedings of the 2012 IEEE International Conference on
Acoustics, Speech and Signal Processing (ICASSP), Kyoto, Japan, 25–30 March 2012.
9. Gannot, S. Speech processing utilizing the Kalman filter. IEEE Trans. Instrum. Meas. Mag. 2012, 15, 10–14.Sensors 2018, 18, 1467 14 of 14
9. Gannot, S. Speech processing utilizing the Kalman filter. IEEE Trans. Instrum. Meas. Mag. 2012, 15, 10–14.
[CrossRef]
10. Goh, Z.; Tan, K.C.; Tan, B.T.G. Kalman-filtering speech enhancement method based on a voiced-unvoiced
speech model. Speech Audio Process. 1999, 7, 510–524.
11. Labarre, D.; Grivel, E.; Najim, M.; Christov, N. Dual H∞ algorithms for signal processing—Application to
speech enhancement. IEEE Trans. Signal Process. 2007, 55, 5195–5208. [CrossRef]
12. Chen, B.S.; Chen, W.H.; Wu, H.L. Robust H2 /H∞ Global Linearization Filter Design for Nonlinear Stochastic
Systems. IEEE Trans. Circuits Syst. I Regul. Pap. 2008, 56, 144–1454.
13. Tseng, C.S.; Chen, B.S. H∞ fuzzy estimation for a class of nonlinear discrete-time dynamic systems. IEEE Trans.
Signal Process. 2001, 49, 2605–2619. [CrossRef]
14. Hu, J.S.; Lee, M.T.; Yang, C.H. Robust adaptive beamformer for speech enhancement using the second-order
extended H∞ filter. IEEE Trans. Audio Speech Lang. Process. 2012, 21, 39–50.
15. Nagata, Y.; Abe, M.; Fujioka, T. Speech enhancement based on auto gain control. IEEE Trans. Audio Speech
Lang. Process. 2006, 14, 177–190. [CrossRef]
16. Bessaoudi, T.; Khemiri, K.; Hmida, F.B.; Gossa, M. Recursive least-squares estimation for the joint input-state
estimation of linear discrete time systems with unknown input. In Proceedings of the 2011 8th International
Multi-Conference on Systems, Signals and Devices (SSD), Sousse, Tunisia, 22–25 March 2011.
17. Chen, B.S.; Tsai, C.L.; Chen, Y.F. Mixed H2 /H∞ filtering design in multirate transmultiplexer systems: LMI
approach. IEEE Trans. Signal Process. 2001, 49, 2693–2701. [CrossRef]
18. Boyd, S.; el Ghaoui, L.; Feron, E.; Balakrishnan, V. Linear Matrix Inequalities in System and Control Theory;
Society for Industrial and Applied Mathematics: Philadelphia, PA, USA, 1994; pp. 1–5.
19. MathWorks: Linear Matrix Inequality, LMI Solvers. Available online: http://www.mathworks.com/help/
robust/lmis.html?requestedDomain=www.mathworks.com (accessed on 17 November 2017).
© 2018 by the author. Licensee MDPI, Basel, Switzerland. This article is an open access
article distributed under the terms and conditions of the Creative Commons Attribution
(CC BY) license (http://creativecommons.org/licenses/by/4.0/).You can also read