An Automated Bacterial Colony Counting System
←
→
Page content transcription
If your browser does not render page correctly, please read the page content below
2008 IEEE International Conference on Sensor Networks, Ubiquitous, and Trustworthy Computing

                                     An Automated Bacterial Colony Counting System

                     Chengcui Zhang1, Wei-Bang Chen1, Wen-Lin Liu2, and Chi-Bang Chen3
           1
             Department of Computer and Information Sciences, University of Alabama at Birmingham,
                                          Birmingham, AL 35294, USA
           2
             Department of Accounting and Information Systems, University of Alabama at Birmingham,
                                          Birmingham, AL 35294 USA
                3
                  Department of Transportation Management, Tamkang University, Taiwan, R.O.C.
                                         {wbc0522, zhang}@cis.uab.edu

                                      Abstract                                              of microbes to form colonies (a.k.a. colony forming
                                                                                            unit - CFU) on the plates. The evaluation is done by
          Bacterial colony enumeration is an essential tool                                 examining the survival rate of microbes in a sample.
       for many widely used biomedical assays. However,                                     These assays are also widely used in biomedical
       bacterial colony enumerating is a low throughput, time                               examinations, food and drug safety test, environmental
       consuming and labor intensive process since there                                    monitoring, and public health [1].
       might exist hundreds or thousands of colonies on a                                      However, bacterial colony enumerating is a low
       Petri dish, and the counting process is often manually                               throughput, time consuming and labor intensive
       performed by well-trained technicians. In this paper,                                process since there might exist hundreds or thousands
       we introduce a fully automatic yet cost-effective                                    of colonies on a Petri dish, and the counting process is
       bacterial colony counter. Our proposed method can                                    often manually performed by well-trained technicians.
       recognize chromatic and achromatic images and thus                                   The manual counting is an error-prone process since
       can deal with both color and clear medium. In                                        the results tend to have more subjective interpretation
       addition, our proposed method can also accept                                        and mostly rely on persistent practice, especially when
       general digital camera images as its input. The whole                                a vast number of colonies appear on the plate [2].
       process includes detecting dish/plate regions,                                       Thus, having consistent criteria is very important.
       identifying colonies, separating aggregated colonies,                                   To reduce the operator’s workload and to provide
       and finally reporting consistent and accurate counting                               consistent and accurate results, colony counting
       results. Our proposed counter has a promising                                        devices were developed and commercialized in the
       performance in terms of both precision and recall, and                               market [3]. We reviewed these counters available on
       is flexible and efficient in terms of labor- and time-                               the market and classified them into two categories.
       savings.                                                                                The first kind of counter is called automatic digital
                                                                                            counters, widely used in most laboratories. However,
       Keywords:                                                                            they are not truly automatic since they still require
       Biomedical image mining, colony counting.                                            technicians to use probe to identify each colony so that
                                                                                            the sensor system can sense and register each count.
                                                                                               The second type of counter is semi-automatic or
       1. Introduction                                                                      automatic counters which are often very expensive.
                                                                                            These high-priced devices often come with their own
           In biomedical research and clinical diagnosis, there                             image capture hardware for acquiring high quality
       is a great need to quantify the amount of bacteria in the                            images to optimize the counter’s efficiency and
       samples. To analyze the result from bacterial culture,                               performance. However, the affordability of this kind of
       bacterial colony enumeration is used to count the                                    equipment is still a non-trivial issue for most
       number of viable bacteria as colonies. This type of                                  laboratories due to the high price of such equipment in
       assays is achieved by pouring a liquefied sample                                     the market. Some laboratories that need to perform a
       containing microbes onto agar plates, incubating the                                 huge amount of enumeration tasks may require more
       survived microbes as the seeds for growing the number                                than one high-throughput counter to fit their needs.

978-0-7695-3158-8/08 $25.00 © 2008 IEEE                                               233
DOI 10.1109/SUTC.2008.50

Authorized licensed use limited to: UNIV OF ALABAMA-BIRMINGHAM. Downloaded on September 1, 2009 at 14:52 from IEEE Xplore. Restrictions apply.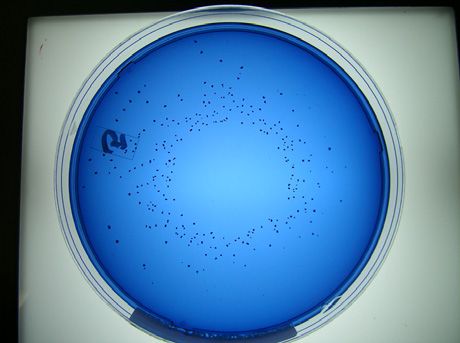
Thus, colony enumeration devices pose a significant                                  clear/transparent LB agar. Based on our experience in
       budgetary challenge to many laboratories [5].                                        using existing software for colony counting, there is no
           In addition, some automatic counters accurately                                  single best algorithm that can satisfy the needs of
       detect colonies by growing bacteria on special growth                                different types of medium. Hence, we believe it is
       medium which contains fluorogenic substrates [8].                                    more appropriate to process images that do or do not
       Bacteria metabolize the substrates, and then produce                                 carry color information separately.
       fluorescent product for detection. These systems are                                     Although human operators can easily recognize
       extremely sensitive, and are good for detecting                                      bacteria colonies on medium after some training,
       microcolonies. However, the fluorogenic substrates                                   computers can hardly “see” these colonies without any
       used in the medium are costly, and the fluorescence                                  prior knowledge. This motives us to design a three-
       can only be detected by using a sensitive instrument.                                step approach for simulating human’s recognition
       Besides, some automatic counters [4] still require users                             behavior. When a human operator examines a bacteria
       to manually specify the plate/dish area and provide                                  colony image, he gradually identifies objects from the
       parameters prior to the actual enumeration process.                                  image. First, the dish/plate region, the largest object in
       Some may need operators to adjust the threshold                                      the image, is identified. Second, within the dish/plate
       values in order to handle dishes/plates/medium that                                  region, human starts to find colonies based on some
       differ from their default settings. In such cases, human                             criteria such as color and shape. An illustration of this
       operators are heavily involved in the operation, and it                              hierarchy is shown in Figure 1. If colonies are
       is thus not efficient for high throughput processing of                              clustered together, the operator will try to separate the
       plates/dishes.                                                                       clustered colonies based on his best visual judgment.
           Further, laboratories have needs to use various                                  Once all colonies have been identified, the operator
       types of dishes and plates in examinations. However,                                 counts the total number of colonies.
       most of the commercial counters are designed for                                         In this paper, the proposed framework differentiates
       measuring 60-150mm Petri dish, thus, lack the                                        the processing of colony images with rich color
       flexibility for accommodating plates with different                                  information from that of those with little color
       sizes and shapes.                                                                    information. It first determines whether or not an
           In addition to the above problems, some counters                                 image carries color information. Then, it locates the
       use only binary images for detecting colonies. Plenty                                dish/plate area. In the third step, possible colony
       of important characteristics of the colony, such as                                  candidates are identified which are subject to further
       color, are lost although they can be used to identify the                            statistics test in order to identify the ‘true’ colonies.
       genus of the bacteria.                                                               Clustered colonies are further separated by Watershed
           To address the above problems, our goal in this                                  algorithm [7]. Finally, the number of remaining
       study is to design and implement an inexpensive,                                     segments is reported back as the total colony count.
       software-centered system for detecting bacterial                                         In the remaining of this paper, we introduce the
       colonies in a fully automatic manner. Thus, more time                                system details in Section 2. Section 3 demonstrates
       and money can be allocated to other priorities for those                             experiment results. Section 4 concludes the paper.
       laboratories.
           Nowadays, image acquiring devices such as digital
       cameras and flatbed scanners, become more popular
       and affordable. Hence, it motivates us to use these
       devices to obtain cost-effective yet high-quality images
       for colony counting.
           In automating the bacteria colony counting process,
       one of the challenges is that the colors of bacteria
       colony and culture medium vary. This is because                                        Figure 1. The hierarchical structure of objects in
       different strains of bacteria may require different                                                bacteria colony images
       nutrients, and these ingredients make the culture
       medium with various colors. In addition, bacteria grow                               2. The proposed bacterial colony counter
       on different kinds of culture medium may appear in
       different color. Hence, while some bacteria colony                                      The overview of the proposed system is illustrated
       images contain abundant color information, some do                                   in Figure 2. First, for an input image, we examine its
       not. For example, Mutans Streptococci appears as                                     chromatic/color components, and a proper processing
       black colonies on the blue color Mitis-Salivarius agar,                              method is selected, depending on what type of image
       and Escherichia Coli appears as white colonies on the

                                                                                      234

Authorized licensed use limited to: UNIV OF ALABAMA-BIRMINGHAM. Downloaded on September 1, 2009 at 14:52 from IEEE Xplore. Restrictions apply.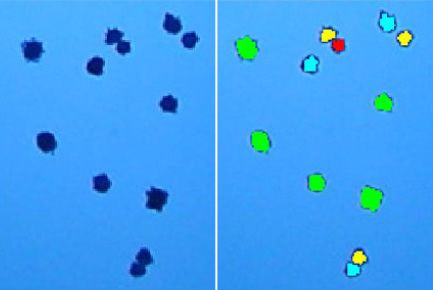
(chromatic/achromatic) it is. In the next step, we                                   deviation of mean values from each color channel R,
       gradually extract objects from the image step-by-step                                G, and B. This is based on the fact that if the RGB
       based on their hierarchical structure as illustrated in                              values of a pixel are close to each other, it is most
       Figure 1.                                                                            likely a gray pixel, and vice versa. Thus, a small
                                                                                            standard deviation indicates low hue or lack of
                                                                                            chromatic components. The smaller the standard
                                                                                            deviation is, the higher the possibility that the image is
                                                                                            achromatic (e.g. those colony images with clear
                                          Color Feature                                     medium and white colonies.) It is at this point that
                                            Detector
                                                                                            chromatic images (e.g. Mutans Streptococci appears as
                                                                                            black colonies on the blue color Mitis-Salivarius agar)
                                          Color Feature
                                            Detected
                                                                                            are distinguished from achromatic images (e.g.
                              Yes                               No
                                                                                            Escherichia Coli appears as white colonies on the clear
                                                                                            LB agar), which will be dealt with separately.
                        Segmentation                   Segmentation
                       with color feature           without color feature                      In view of the different characteristics of
                          Dish/Plate                        Dish/Plate
                                                                                            achromatic and chromatic images, we develop
                        Region Detector                   Region Detector                   different methods for these two types of images in the
                                                                                            subsequent image segmentation step.
                        Colony Detector                   Colony Detector

                                                                                            2.2. Image segmentation

                                    Colony Enumeration                                          The core of the proposed bacterial colony counter is
                                                                                            image segmentation. The goal of segmentation is to
                                                                                            distinguish foreground objects from the background.
                                                                                            For this purpose, there are two popular choices of
                                                                                            techniques, namely the thresholding techniques and the
           Figure 2. The overview of the proposed system                                    clustering techniques. The thresholding techniques use
                                                                                            a global threshold value to separate foreground and
          Once all the colonies on the image are identified,                                background, and the clustering techniques partition
       we check the morphology of each segment. This is                                     objects based on their inter- and intra-class similarities.
       necessary because some colonies may aggregate                                        The thresholding techniques are quite straightforward
       together to form a large cluster. Hence, to obtain an                                and efficient, but are not stable when dealing with
       accurate colony count, those clustered colonies need to                              images containing more than two classes. According to
       be separated. For this purpose, we adopt the Watershed                               our preliminary experiments, the performance of multi-
       algorithm [7] to detect and segment those plausible                                  class clustering methods, which are more complicated
       colony clusters. Once all the colonies on the dish/plate                             and time-consuming, are generally worse than that of
       have been identified and isolated, we simply count the                               the thresholding techniques in terms of robustness,
       number of detected segments and use it as the total                                  explainability, and projectibility. In this paper, we
       count of bacteria colonies.                                                          propose a new thresholding based technique for
                                                                                            bacterial colony image segmentation.
       2.1. Color feature detection                                                             To do segmentation with thresholding techniques,
                                                                                            we have to solve the problem that the target region
          As mentioned in Section 1, some bacteria colony                                   contains more than two classes. The natural
       images may contain abundant color information. For                                   hierarchical structure of the objects in colony images
       those colored images, we propose a color feature based                               (as shown in Figure 1) indicates that we may be able to
       method to detect foreground objects in the target                                    gradually separate them in a progressive way.
       region (region-of-interest). On the other hand, those                                    Our target, at the first level, is the entire image. The
       images with very little color information (almost no                                 foreground object is the dish/plate region, and the
       hue) shall be dealt with in a different way.                                         background is the area surrounding the dish/plate
          To choose a proper method for different types of                                  region. After the dish/plate area is separated, we move
       images, we first need to determine whether the                                       to the second level in which the foreground objects are
       imported image is chromatic or achromatic. The                                       colonies and the background includes medium and
       checking is achieved by examining the standard                                       other artifacts within the dish/plate region.

                                                                                      235

Authorized licensed use limited to: UNIV OF ALABAMA-BIRMINGHAM. Downloaded on September 1, 2009 at 14:52 from IEEE Xplore. Restrictions apply.
As aforementioned, we propose different correctly identify all colonies due to the existence of
approaches to deal with images with chromatic and artifacts such as scratches, dusts, markers, bubbles,
achromatic medium separately in the subsequent reflections, and dents in the image. The calculation of
processes. It is much easier to perform segmentation color similarity in HSV color space is shown in
on chromatic images than achromatic images since Equation 1.
they contain more color information. In the following
discussions, we first introduce how to perform
segmentation on chromatic images, then the approach CSij = 1 −
1
(x j − xi )2 + (y j − yi )2 + (z j − zi )2
5
for achromatic images. (1)
xi = Si × cos(H i × 2π )
2.3. Segmentation on chromatic images yi = Si × sin (H i × 2π )
zi = Vi
In this step, our goal is to identify the dish/plate
region in an image, and then, recognize colonies in the where CSij is the color similarity of two pixels i and j.
detected dish/plate region. The motivation is to reduce H, S, V are the hue, saturation, and value of a pixel in
the operator’s workload by eliminating the process of the HSV color space.
manually specifying the target dish/plate region. To This is based on the assumption that pixels inside a
distinguish the dish/plate region from the background, segment, no matter it is a colony segment or a medium
we first perform the contrast limited adaptive segment, have higher similarity values with its
histogram equalization (CLAHE) on the converted neighboring pixels, and pixels along the segment
grayscale images which operates on small regions boundary have lower similarity values with their
called tiles in the image rather than the entire image neighbors. We calculate the color similarity values
[6]. Each tile’s contrast is enhanced and the between a pixel and its eight neighbors, and use the
neighboring tiles are then combined using bilinear minimum similarity value to represent the maximum
interpolation to eliminate artificially induced color difference with its neighbors. Thus, pixels in the
boundaries. same segment have higher minimum similarity values.
Then we apply the Otsu’s method [9] on the On the contrary, pixels on the boundary of a segment
contrast enhanced image to identify the dish/plate have lower values. After the calculation, the
region as a target region. For some target regions boundaries are more evident, and the minimum color
detected this way, there may be small holes inside, and similarity values formed a matrix as a grayscale image.
we fill in the holes by adopting a morphology-based Thus, we can adopt the Otsu’s method used in the
method and consolidate the target regions. dish/plate region detection stage to further distinguish
Sometimes, this method can also detect some background (medium areas) from foreground objects
smaller objects that are not part of the target dish/plate (candidate colonies).
region. We assume the target region should occupy the
majority (and central) part of the image, thus there is
an extra step in our algorithm which is designed to
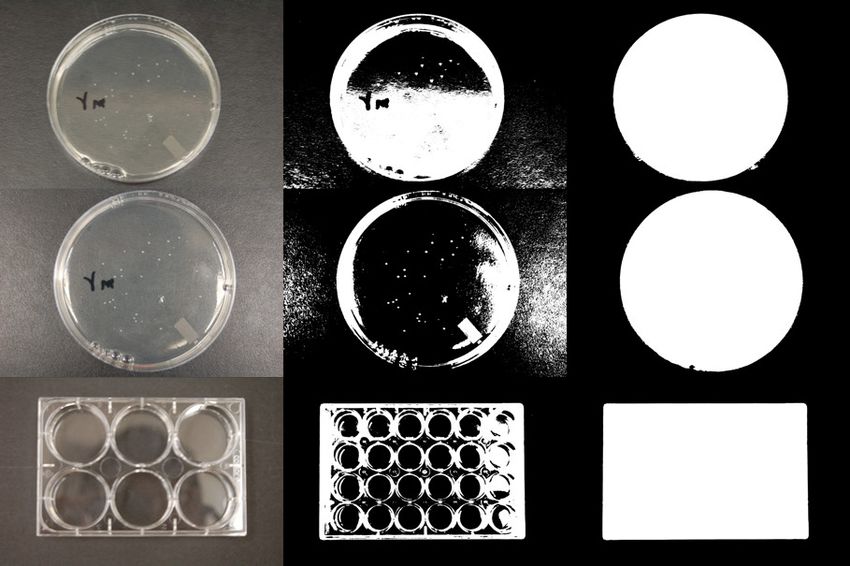
remove those isolated small objects. A few of detected
target regions of dish/plate, after applying the above
steps, are shown together with their original images in
Figure 3.
The results show that the automatic dish/plate
region detection algorithm is effective regardless of the
size and shape of the dish/plate. After the dish/plate
region has been extracted, we can apply the
segmentation again on the detected dish/plate region.
The second step is to isolate colonies on the
dish/plate, identify clustered colonies, and separate
aggregated bacteria colonies for subsequent colony Figure 3. Segmentation results for detecting
enumeration. In addition to using Otsu’s method [9] to dish/plate regions. Raw images (left column);
separate colonies and medium, we also adopt color Otsu’s method (middle column); proposed method
similarity in HSV (Hue-Saturation-Value) color space (Right column)
to assist the colony boundaries detection [10]. This is
necessary because a simple global threshold cannot
236
Authorized licensed use limited to: UNIV OF ALABAMA-BIRMINGHAM. Downloaded on September 1, 2009 at 14:52 from IEEE Xplore. Restrictions apply.Ideally, an isolated foreground object from the much less accurate on achromatic images due to the
previous step corresponds to one colony. However, presence of artifacts. An additional noise removal step
such an object may correspond to more than one is performed for those achromatic images.
colony because several colonies may cluster together. The color similarity as described in Section 2.3
There is a need to split them in order to get the correct cannot be applied since achromatic images lack color
colony counts. To separate the connected colonies, we information. In this paper, we propose a new statistic
consider the intensity gradient image as a topological approach to detect and remove those artifacts and
surfaces [7], thus the watershed algorithm can be successfully preserve only colonies.
applied to divide clustered colonies in the image just as Our proposed statistic approach includes two steps.
water flood in a topographical surface. To illustrate the The first step is to remove those large-size artifacts.
concept, we demonstrate the application of watershed We collect the sizes of all objects detected by Otsu’s
algorithm in Figure 4. method from the dish/plate region, and generate
frequency distribution with log base of those size
values. Colonies of similar size should occupy the high
frequency segment in this distribution, and the
frequencies for those very large artifacts should be
very low. By this assumption, we can remove those
large size objects. The second step is to remove those
small artifacts which are very similar to the colonies in
the dish/plate. In this step, area size is not a good
determinant since the area size range of those small
artifacts is about the same as that of colonies. Instead,
we consider the intensity distribution of the dish/plate
region as a two-peak distribution which consists of the
distribution of medium pixels (background) and the
distribution of colonies pixels. Those small artifacts
belong to background distribution; however, they have
overlapped with the colony distribution. Therefore, we
Figure 4. The concept of watershed algorithm assume that colonies should have significantly
different intensity values than their surrounding
After applying the watershed algorithm, almost all background, and it is highly possible that those small
clustered colony segments can be separated and artifacts have similar intensity values to their
identified and are ready for the colony enumeration. surrounding pixels. Based on this assumption, we
examine each small object including colonies by
2.4. Segmentation on achromatic images hypothesis testing. In the hypothesis testing, we use the
mean of surrounding pixel values as null and test if the
The most challenge part in this research is to deal mean of object pixel values has significant difference
with achromatic images. Most of the existing colony with the null, by the α = 0.01.
counters have disappointing performance in handling After excluding most of the artifacts, we apply the
achromatic images due to the low contrast between watershed algorithm to separate clustered colonies as
colonies and medium. Besides, the background described in Section 2.3.
artifacts look very similar to colonies in the clear agar,
making it more difficult to discriminate the 2.5. Colony enumeration
background artifacts from real colonies in the
dish/plate. After all colonies have been properly separated and
To handle achromatic images, our method is also identified, the final step is to acquire the total number
based on the hierarchical structure of objects of viable colonies by adding up the number of the
aforementioned. In the first step, the dish/plate region objects that have been identified as colonies.
can be detected by using the same approach as
described in Section 2.3. In the colony detection stage, 3. Experimental results
we develop a different method to alleviate the low
contrast and artifacts problems. We also apply Otsu’s In our experiments, we use four different digital
method to isolate colonies. However, Otsu’s method is cameras as the image acquiring devices to obtain
237
Authorized licensed use limited to: UNIV OF ALABAMA-BIRMINGHAM. Downloaded on September 1, 2009 at 14:52 from IEEE Xplore. Restrictions apply.dish/plate images for bacterial colony detection. The 0.52±0.19, respectively; their recall values are
four digital cameras include a Nikon D50 Digital SLR 0.96±0.04 and 0.99±0.01, respectively; their F-
Camera (6.0-megapixel) with a resolution of 3008 × measure values are 0.96±0.01 and 0.67±0.18,
2000, a Canon PowerShot A95 Camera (5.0- respectively. The precision, recall, and F-measure
megapixel) with a resolution of 2592 × 1944, a Sanyo values of the proposed counter (P.C.) are about the
DSC-J1 Camera (3.2-megapixel) with a resolution same as that of the A.C. method on chromatic images.
1600 ×1200, and an Asus P525 PDA cell phone built- To evaluate the robustness of the proposed counter
in camera (2.0-megapixel) with a resolution of 1600 (P.C.) on achromatic images, we conduct the following
×1200. two experiments, and compare the performance of P.C.
Additionally, Petri dishes with two different types with that of A.C and C.C.
of medium and bacteria strains are used in our In the first experiment, we test the proposed counter
experiments. The first type of images is obtained from (P.C.) on 24 achromatic images (9 images with good
the Department of Pediatric Dentistry at the University quality and 15 images with poor quality). The
of Alabama at Birmingham. This type of plate contains performance of the P.C., A.C., and C.C. methods on
blue color Mitis-Salivarius agar which is used for good/poor quality images are summarized in Table 1.
isolating Mutans Streptococci. These acid-producing From Table 1, we can observe that the P.C.
bacteria attack tooth enamel minerals and cause dental significantly outperforms the A.C. and C.C methods.
caries. The second type of plate is obtained from the The average overall precision, recall, and F-measure
Division of Nephrology, Department of Medicine, values of the P.C. method are 0.61±0.29, 0.94±0.06,
University of Alabama at Birmingham. This type of and 0.69±0.20, while the corresponding values of P.C.
plates contains the clear LB agar which is widely used and C.C. are (0.44±0.24, 0.68±0.24, 0.44±0.13) and
in laboratories for Escherichia Coli culture. (0.00±0.00, 0.00±0.00, 0.00±0.00), respectively.
In our second experiment, we further apply the
3.1. Dish/Plate detection proposed method on 15 different achromatic images
taken from the same dish, but with different
In this experiment, we compare the proposed background surfaces, zooms, and lighting conditions.
dish/plate detection algorithm with Otsu’s method. We measure the precision, recall, and F-measure of the
Some sample segmentation results are demonstrated in proposed counter. The average precision, recall, and F-
Figure 3. In addition, we also evaluate the performance measure on the 15 achromatic images are 0.93±0.11,
of the proposed dish/plate detection algorithm and 0.87±0.04, and 0.90±0.07, respectively. The results of
Otsu’s method by applying both methods on 100 the consistency analysis show the proposed system is
chromatic and achromatic images. The satisfaction quite consistent.
rates for the proposed method and Otsu’s method are
96% and 38%, respectively. For the 25 chromatic Table 1. Performance comparison on achromatic
images, the satisfaction rates for the proposed method images
and Otsu’s method are 92% and 0%, respectively. For Image F-
Method Precision Recall
Condition measure
the 75 achromatic images, the satisfaction rates for the
0.94 ± 0.88 ± 0.90 ±
proposed method and Otsu’s method are 97% and P.C.
0.07 0.02 0.03
50%, respectively. It is obvious that the proposed Good
0.71 ± 0.42 ± 0.52 ±
Quality A.C.
method outperforms Otsu’s method in dish/plate (9)
0.06 0.16 0.12
region detection. 0.00 ± 0.00 ± 0.00 ±
C.C.
0.00 0.00 0.00
0.41 ± 0.98 ± 0.56 ±
3.2. Colony detection P.C.
0.16 0.04 0.13
Poor
0.27 ± 0.84 ± 0.40 ±
Quality A.C.
Since the characteristics of the chromatic and 0.12 0.07 0.12
(15)
0.00 ± 0.00 ± 0.00 ±
achromatic images are quite different, it is more C.C.
0.00 0.00 0.00
appropriate to discuss the counter performance on 0.61 ± 0.94 ± 0.69 ±
P.C.
them separately. In the experiments, we compared the 0.29 0.06 0.20
proposed counter (P.C.) with the Clono-Counter (C.C.) Overall A.C.
0.44 ± 0.68 ± 0.44 ±
[4] which is reported by Niyazi in 2007, and the 0.24 0.24 0.13
0.00 ± 0.00 ± 0.00 ±
automatic counter (A.C.) proposed in our previous C.C.
0.00 0.00 0.00
study [11]. For chromatic images, the precision values P.C. : The proposed counter
of the A.C. and C.C. methods are 0.97±0.03 and A.C. : Automatic counter [11]
C.C. : Clono-Counter [4]
238
Authorized licensed use limited to: UNIV OF ALABAMA-BIRMINGHAM. Downloaded on September 1, 2009 at 14:52 from IEEE Xplore. Restrictions apply.also exists a lot of noise on the plate such as bubbles,
3.3. Splitting clustered colonies small scratches, and small markers. Some round-
shaped small objects are very similar to the colonies
In the process of detecting colonies, there exist and sometimes it is hard to distinguish them from real
some clustered colonies that need to be further divided colonies even by trained human eyes. This makes the
into separate colonies. As mentioned earlier, we adopt colony isolation task extremely difficult. In this paper,
the Watershed algorithm to deal with this problem and we address those challenges and demonstrate a
found it useful in separating connected colonies in our reasonable performance in both color and clear
experimental results. We give an example of the medium images.
splitting result of Watershed algorithm in Figure 5. The above features also make our proposed method
In our experiment, we checked the performance of very flexible and attractive to laboratories. In addition,
the Watershed algorithm on 19 segments with our proposed counter operates automatically without
clustered colonies which actually contain 98 colonies. any human intervention, and the performance is very
After applying the watershed algorithm, we obtain 96 quite promising for both color and clear medium.
colonies. Only 2 overlapped colonies are missed in the In the future work, we plan to detect and distinguish
splitting process. different species of bacteria from a single colony
dish/plate. Ultimately, our goal is to accurately classify
different kinds of bacterial colonies and produce the
correct count for each class, which could greatly
benefit clinical studies.
5. Acknowledgement
This research of Dr. Zhang is supported in part by
NSF DBI-0649894.
Figure 5. Clustered colonies split by watershed 6. References
algorithm
[1] X. Liu, S. Wang, L. Sendi, and M. J. Caulfield, “High-
It is worth noting that the Watershed algorithm is an throughput imaging of bacterial colonies grown on filter
integral part of the proposed system, in which each plates with application to serum bactericidal assays,” Journal
step contributes to the better performance of the of Immunological Methods, vol. 292, pp. 187-193, 2004.
following steps.
[2] C. W. Chang, Y. H. Hwang, S. A. Grinshpun, J. M.
Macher, and K. Willeke, “Evaluation of Counting Error Due
4. Discussions, Conclusions, and Future to Colony Masking in Bioaerosol Sampling,” Applied and
Work Environmental Microbiology, vol. 60, pp. 3732-3738, 1994.
[3] J. Dahle, M. Kakar, H. B. Steen, and O. Kaalhus,
In this paper, we introduce a robust and effective
“Automated counting of mammalian cell colonies by means
automatic bacterial colony counter with the ability to of a flat bed scanner and image processing,” Cytometry A,
recognize chromatic and achromatic images, detect the vol. 60, pp. 182-188, 2004.
dish/plate regions, isolate colonies on the dish/plate,
and further, separate the clustered colonies for accurate [4] M. Niyazi, I. Niyazi, and C. Belka, “Counting colonies of
counting of colonies. The proposed counter has the clonogenic assays by using densitometric software,”
following contributions. Radiation Oncology, vol. 2, pp. 4, 2007.
First, our proposed method can handle various
kinds of dish/plate, including circular and rectangular [5] M. Putman, R. Burton, and M. H. Nahm, “Simplified
shaped dish/plates. Second, it can accept general method to automatically count bacterial colony forming
unit,” J Immunol Methods, vol. 302, pp. 99-102, 2005.
digital camera images as its input. The third
contribution is that our proposed method can recognize [6] Z. Karel, “Contrast limited adaptive histogram
chromatic and achromatic images and deal with both equalization,” in Graphics gems IV: Academic Press
color and clear medium. The most challenging part in Professional, Inc., pp. 474-485, 1994.
this study is to handle clear medium images, since
colonies look very similar to the background. There
239
Authorized licensed use limited to: UNIV OF ALABAMA-BIRMINGHAM. Downloaded on September 1, 2009 at 14:52 from IEEE Xplore. Restrictions apply.[7] V. Luc and S. Pierre, “Watersheds in Digital Spaces: An
Efficient Algorithm Based on Immersion Simulations,” IEEE [11] C. Zhang and W.-B. Chen, “An Effective and Robust
Trans. Pattern Anal. Mach. Intell., vol. 13, pp. 583-598, Method for Automatic Bacterial Colony Enumeration,” in
1991. Proc. of the IEEE Intl. Workshop on Semantic Computing
and Multimedia Systems, in conjunction with the 2007 Intl.
[8] http://www.colifast.no/ Conf. on Semantic Computing, pp. 581-588, September 17-
19, Irvine, CA, USA, 2007.
[9] N. Otsu, “A Threshold Selection Method from Gray-
Level Histograms,” IEEE Trans. on Systems, Man, and
Cybernetics, vol. 9, no. 1, pp. 62-66, 1979.
[10] G. A. F. Seber, “Multivariate Observations”, Wiley,
1984.
240
Authorized licensed use limited to: UNIV OF ALABAMA-BIRMINGHAM. Downloaded on September 1, 2009 at 14:52 from IEEE Xplore. Restrictions apply.You can also read